Determinants of Complementary Feeding Practices and Nutritional Status of Children 6 – 23 Months in Pastoralist Communities of Isiolo, Kenya
Dorcas Anunda Amunga1*
and Sophie Ochola2 1Stellenbosch University, Private Bag X1, Matieland, South Africa.
2Kenyatta University, Nairobi, Kenya.
Corresponding Author Email: dorcasamunga@gmail.com
DOI : http://dx.doi.org/10.12944/CRNFSJ.10.1.21
Download this article as:
![]()
Optimal complementary feeding practices play a vital role in the nutritional status of young children. In Kenya, significantly higher rates of acute malnutrition have been reported among pastoralist communities, particularly among children aged 6-23months. There is inadequate complementary feeding data on pastoralist communities despite their vulnerability. The objective of the study was to establish the determinants of complementary feeding practices and nutritional status of children 6-23 months among pastoralist communities of Isiolo County, Kenya. A cross-sectional analytical study using two-stage cluster sampling methodology was applied to select a sample of 288 children aged 6-23 months from pastoralist communities. Data on the socio-demographic characteristics of the study population, complementary feeding practices and anthropometric measurements of the children aged 6-23 months was collected and analysed. Overall, the prevalence of stunting, underweight and wasting was 19.1%, 7.3% and 5.2% respectively. A variation in malnutrition prevalence was observed with age of children, with the 18-23month age group showing a higher prevalence of all forms of undernutrition. Male children had significantly higher proportions of underweight and stunting (p ≤ 0.05). Complementary feeding practices were sub-optimal - minimum meal frequency (60.4%), minimum dietary diversity (35.4%) and minimum acceptable diet (25.3%). Child age, child sex, caregiver’s age, and caregiver education level were significant determinants for complementary feeding practices and nutritional status of children 6-23months (p ≤ 0.05). We recommend that community based approaches targeting pastoralist communities should address the basic cause of child malnutrition through nutrition education and women empowerment initiatives.
KEYWORDS:Complementary feeding; Infants; Nutritional status; Pastoralist communities; Young children
Introduction
Adequate nutrition is vital to a child’s development, with the period from pregnancy to two years of age being the most critical basis for future optimal growth, health, and development.1 Current global public health recommendations on Infant and Young Child Feeding (IYCF) state that an infant should be exclusively breastfed for the first six months of life and thereafter, complementary foods should be introduced to the child’s diet while they continue breastfeeding up to two years of age and beyond.2,3
Appropriate complementary feeding practices have been ranked among the top three interventions, with a potential of reducing undernutrition and child mortality.4When complementary foods are given, the type and quality of food that is given is an important consideration, because if it is compromised, the result is often poor nutrition.1 In many developing countries, the transition period to family foods is often marked by growth faltering, micronutrient deficiencies and common childhood illnesses such as diarrhoea and acute respiratory infections.1Complementary feeding frequently begins too early and sometimes foods are nutritionally inadequate, or unsafe.1, 2, 5-8
Scientific evidence has established that there is a progressive increase in stunting, underweight and wasting levels between 6-23 months (peaking at 12-23 months), with limitations in the quality and quantity of complementary foods being the single most important determining factor.1,9,10 Complementary feeding support has been shown to have the capability to reduce stunting in children aged five years and under, with or without food supplementation, in both food secure and food insecure households.9 Appropriate complementary feeding practices have also been proven to have an effect on reducing mortality, by means of the role that they play in preventing acute malnutrition.4,11On the other hand, overconsumption of energy-dense complementary foods may induce excessive weight gain in infancy, which has been associated with a higher risk of obesity in school-age children and adulthood.3, 12,13
The social, demographic and geographical context including seasonality of foods is an important determinant of complementary feeding practices in the rural African setting.5, 14 Children who live in pastoralist areas are, however, increasingly referred to as some of the most nutritionally vulnerable in the world.15 In Kenya, some of the highest rates of malnutrition have been reported among the pastoralist communities.1There is still limited published data on complementary feeding practices and the related socio-demographic factors among pastoralist communities in Kenya despite their vulnerability.16This study, therefore, sought to obtain an understanding of the complementary feeding practices for children aged 6-23 months among the pastoralist communities and how they relate to the nutritional status. The study also sought to identify specific socio-demographic factors contributing to poor feeding practices and thereby filling the information gap while simultaneously building upon the current knowledge on complementary feeding practices.
Materials and Methods
Study site
The study was conducted in Isiolo County, Kenya whereby it is estimated that 70% of the population are involved in pastoralist activities and the major economic activities are livestock-based.17
Sampling
A cluster sampling procedure was applied with a design effect of 1.5 to select a sample size of 288 children aged 6-23months. The sample size was calculated based on the highest prevalence of a core complementary feeding indicator with a wide age range (i.e., 6-23 months), a confidence interval (CI), a desired precision, a design effect and an estimated population of children aged 6-23 months. 18,19 Children aged between six completed months and no more than 23 completed months (23.9) at the time of the study and living in households that have been involved in pastoralist activities for longer than three months were included in the cross-sectional analytical study.
Data collection tools
Socio-demographic
Information on selected socio-demographic characteristics was collected for both mother/caregiver and child. These were age, marital status, and education status for the caregiver, as well as age and sex for the child. The children’s age was established using child health cards, or, in the absence of the cards, a calendar of events was used. The actual age of the children was verified using a pre-developed chart for calculating age in months.
IYCF practices
The mother/caregiver was interviewed using a modified and validated structured questionnaire adopted from the World Health Organisation (WHO) standard questionnaire for assessing IYCF practices.20 IYCF indicators assessed included: Child ever breastfed; Continued breastfeeding at 1 year; Continued breastfeeding at 2 years; Introduction of solid, semi-solid and soft (complementary) foods at 6-8 months of age; Minimum dietary diversity (MDD); Minimum meal frequency (MMF) and Minimum acceptable diet (MAD).20 MDD was determined based on consumption of four, or more of seven food groups. MMF was determined by analyzing the percentage of breastfed and non-breastfed children 6-23 months who received complementary foods (including milk feeds for non-breastfed children) a minimum number of times. The minimum in this case was defined as twice for breastfed infants of 6-8 months, three times for breastfed children of 6-23 months and four times for non-breastfed children of 6-23 months.20 MAD was analyzed by the cumulative proportion of children who achieved both MDD and MMF.20
Anthropometric data
: The weight of the nude child was measured, using a graduated hanging Salter scale weighed to an accuracy of 0.1 kg. The incumbent’s length measurements were taken to the nearest 0.1 cm. The enumerators and the mother/caregiver collaborated in taking the measurements for accuracy. WHO child growth standards guided the interpretation of the anthropometric data whereby a Length for Age Z-score (LAZ) of < -2 was referred to as stunting; a Weight-for-Length Z-score (WLZ) of < -2 was referred to as wasting; a Weight-for-Age Z-score (WAZ) of < -2 was referred to as underweight and WAZ of > +2 was referred to as overweight.21
Statistical analysis
Descriptive summary statistics such as frequencies, percentages, means, and standard deviations were used to describe the study population’s socio-demographic characteristics, IYCF practices and nutritional status. Appropriate inferential statistics were used to determine the associations between the variables concerned. Chi-square test for testing the association between different attributes was used. Multivariate analysis was applied using odds ratios (OR) combined with the respective 95% confidence intervals (CI) for finding associations.
Ethical Considerations and Approvals: The survey protocol was approved by the Health Research Ethics Committees of Stellenbosch University, South Africa (Host University) and Kenyatta University, Kenya (Host Country). A research permit to conduct the survey was received from the National Council of Science and Technology (Kenya). Written, informed consent was obtained from the mother/caregiver of each child included in the study. Participation in the study was free and voluntary and participant confidentiality was ensured.
Results
Socio-demographic characteristics
Ninety-nine percent of the respondents (caregivers) were female and 93% of the caregivers were married. Most of the caregivers (58%) had never attended school and out of the 48% who had attended a formal school, nearly all (96%) had only reached primary education level.
Table 1: Socio-demographic characteristic of caregivers of chidren 6-23 months
| Characteristic | N | % |
| Age | ||
| 36 years and older | 29 | 10.1 |
| 25–35 years | 147 | 51 |
| 18–24 years | 104 | 36.1 |
| 17 years and younger | 8 | 2.8 |
| School Attendance | ||
| Had attended school | 120 | 41.7 |
| Had never attended school | 168 | 58.3 |
| Education level | ||
| College/Tertiary institution | 1 | 0.8 |
| Secondary school | 4 | 3.3 |
| Primary school | 115 | 95.8 |
| Marital status | ||
| Single | 7 | 2.4 |
| Married | 268 | 93.1 |
| Separated/Divorced | 7 | 2.4 |
| Widowed | 6 | 2.1 |
Child feeding practices
Nearly all the children surveyed, 97% (n = 278) had been breastfed (female – 52%, male – 48%). Breastfeeding declined from 94% at one year to 64% at two years. There were variations in breastfeeding among female and male children. Almost twice the number of female children continued breastfeeding at one year (63%) than did the male children (37%). More female children (55%) than male children (45%) were breastfed at two years. Figure 1 shows that based on a 24-hour recall on consumption of 7 food groups; the most consumed food groups were grains, roots, and tubers at 89% (n = 256) and dairy products at 58% (n = 166). The least consumed food group was ‘other fruits and vegetables’, at 9% (n = 25).
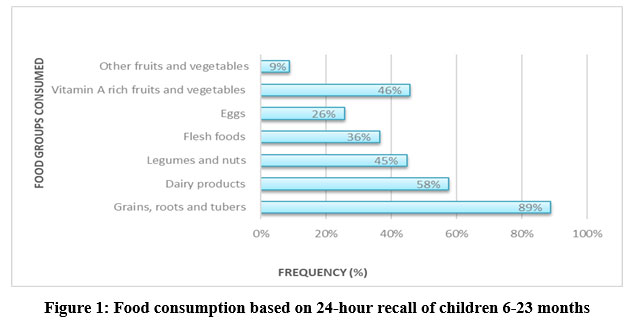 |
Figure 1: Food consumption based on 24-hour recall of children 6-23 months |
Nearly two-thirds (69%) of children aged 6-8 months had received solid, semi-solid and soft (complementary) foods at the time of study, with slightly more females (53%) than males (47%) having achieved this indicator. Sixty percent of the children achieved the MMF while 35% of the children achieved the MDD (34% and 41% for breastfed and non-breastfed children, respectively). Only 25% of the children achieved MAD (with 24% for breastfed and with 30% for non-breastfed). Child feeding practices showed variations with age in children with the highest proportion of MDD, MMF and MAD observed in children aged 18-23months (table 2).
Table 2: Complementary Feeding Practices and Nutritional Status Summary
| Socio-demographic Characteristic |
N (%) | Complementary Feeding Practices | Nutritional Status | ||||
| Minimum Acceptable Diet | Minimum Dietary Diversity | Minimum meal Frequency | Underweight | Stunting | Wasting | ||
| N (%) | N (%) | N (%) | N (%) | N (%) | N (%) | ||
| Child Sex | 73 (25.3) | 102 (35.4) | 174 (60.4) | 21 (7.3) | 55 (19.1) | 15 (5.2) | |
| Female | 151 (52.4) | 37 (12.8) | 53 (18.4) | 93 (32.3) | 5 (1.7) | 21 (7.3) | 6 (2.1) |
| Male | 137 (47.6) | 36 (12.5) | 49 (17.0) | 81 (28.1) | 16 (5.6) | 34 (11.8) | 9 (3.1) |
| Child Age (Months) | 73 (25.3) | 102 (35.4) | 174 (60.4) | 21 (7.3) | 55 (19.1) | 15 (5.2) | |
| 6–11 months | 101 (35.1) | 16 (5.6) | 19 (6.6) | 59 (20.5) | 4 (1.4) | 12 (4.2) | 4 (1.4) |
| 12–17 months | 83 (28.8) | 17 (5.9) | 34 (11.8) | 45 (15.6) | 4 (1.4) | 14 (4.9) | 3 (1) |
| 18–23 months | 104 (36.1) | 40 (13.9) | 49 (17.0) | 70 (24.3) | 13 (4.5) | 29 (10.1) | 8 (2.8) |
Nutritional status
Overall, 80% of the children measured were found to have normal nutritional status (Normal scores: 95% WLZ, 93% WAZ, and 81% LAZ). Stunting was found to be the most prevalent form of malnutrition, at 19.1% as compared with other forms of malnutrition whereby underweight and wasting were at 7.3% and 5.2% respectively (table 2). A variation in malnutrition prevalence was observed in the different child age categories and child sex. A higher prevalence of malnutrition was found in the age group 18-23months and in male children (table 2 above).
Associations and key determinants
Socio-demographic characteristics were analyzed for their risk on undernutrition using odds ratios along with their respective 95% confidence intervals (Table 3). Child age, child sex, caregiver school attendance, and caregiver age were found to be significant risk factors for undernutrition as shown in the table. Proportion of stunting and underweight was significantly higher in children who were male and aged 18-23 months (p ≤ 0.05). The proportion of wasting was significantly higher in children whose caregivers did not attend school (p ≤ 0.05). There were no associations identified between caregiver marital status and nutritional status. On the other hand, the study also found that child age was significantly (p ≤ 0.01) associated with all the key complementary feeding practices highlighted in table 3 with the exception of MMF.
Table 3: Socio-demographic Characteristics and Nutritional Status.
| Socio-demographic Characteristic | N (%) | Nutritional Status | ||
| Underweight | Stunting | Wasting | ||
| OR (95% CI) | OR (95% CI) | OR (95% CI) | ||
| Child Sex | ||||
| Female | 151 (52.4) | Reference | Reference | Reference |
| Male | 137 (47.6) | 4.0 (1.4 – 12.6)** | 2.2 (1.1 – 4.1)* | 1.8 (0.6 – 5.1) |
| Child Age (Months) – Mean [SD] | 14.7 [5.6] | 1.1 (1.0 – 1.2)* | 1.1 (1.0 – 1.2)** | 1.0 (0.9 – 1.2) |
| Caregiver’s Age (Years)- Mean [SD] | 27.2 [7.6] | 1.0 (0.9 – 1.0) | 0.9 (0.9 – 0.9)** | 1.0 (0.9 – 1.1) |
| Caregiver School Attendance | ||||
| No | 168 (58.3) | Reference | Reference | Reference |
| Yes | 120 (41.7) | 0.4 (0.1 – 1.2) | 0.7 (0.4 – 1.4) | 0.1 (0.0 – 0.8)* |
| Caregiver’s Marital Status | ||||
| Single | 20 (6.9) | Reference | Reference | Reference |
| Married | 268 (93.1) | 1.2 (0.1 – 11.1) | 1.0 (0.3 – 3.5) | 0.6 (0.1 – 2.4) |
** p ≤ .01.
* p ≤ .05.
Table 4: Socio-demographic Characteristics and Complementary Feeding Practices.
| Socio-demographic Characteristic | N (%) | Complementary Feeding Practice | ||||
| Continued breastfeeding at 1 year | Timely Complementary Feeding | Minimum Acceptable Diet | Minimum Dietary Diversity | Minimum Meal Frequency | ||
| OR (95% CI) | OR (95% CI) | OR (95% CI) | OR (95% CI) | OR (95% CI) | ||
| Child Sex | ||||||
| Female | 151 (52.4) | Reference | Reference | Reference | Reference | Reference |
| Male | 137 (47.6) | 0.6 (0.3 – 1.1) | 0.8 (0.3 – 2.3) | 1.2 (0.7 – 2.1) | 1.1 (0.7 – 1.9) | 0.9 (0.6 – 1.5) |
| Child Age (Months) – Mean [SD] | 14.7 [5.6] | 0.9 (0.9 – 0.9)** | 0.3 (0.2 – 0.5)** | 1.1 (1.1 – 1.2)** | 1.1 (1.1 – 1.2)** | 1.0 (0.9 – 1.1) |
| Caregiver’s Age (Years)- Mean [SD] | 27.2 [7.6] | 0.9 (0.9 – 1.0) | 0.9 (0.8 – 1.0) | 1.0 (1.0 – 1.1) | 1.0 (0.9 – 1.1) | 1.0 (0.9 – 1.0) |
| Caregiver School Attendance | ||||||
| No | 168 (58.3) | Reference | Reference | Reference | Reference | Reference |
| Yes | 120 (41.7) | 0.9 (0.5 – 1.7) | 0.4 (0.1 – 1.4) | 1.8 (1.0 – 3.2)* | 1.6 (0.9 – 2.7) | 1.2 (0.7 – 1.9) |
| Caregiver’s Marital Status | ||||||
| Single | 20 (6.9) | Reference | Reference | Reference | Reference | Reference |
| Married | 268 (93.1) | 0.7 (0.2 – 2.3) | 3.2 (0.5 – 22.8) | 0.9 (0.3 – 2.7) | 1.1 (0.4 – 2.8) | 1.1 (0.4 – 3.0) |
** p ≤ .01.
* p ≤ .05.
Discussion
Overall, complementary feeding practices were sub-optimal among pastoralist communities. With further analysis, the older children (18-23months) had a significantly higher proportion achieving appropriate MDD and MAD as compared to the other age categories. This trend is similar to the findings of a study conducted in Ethiopia which found that dietary diversity was 17%, 11% and 5% for 18-23 months, 12-17 months and 6-11 months, respectively.22 Among African communities, breastfeeding is common practice, however the decline in breastfeeding with an increase in age could be attributed to the increase in consumption of complementary foods as well as to increasing household and childcare demands on the caregiver hence reducing time for continued breastfeeding.1,5-8,22-24
Despite the WHO recommendations that complementary foods be introduced at six months of age2 this is often not the case. In the context of pastoralist communities, the late introduction of complementary foods as found in this study might be due to the challenges relating to food access and availability in relatively harsh climatic conditions, increased maternal workload as well to poor knowledge regarding infant feeding. Pastoralist communities like other communities living in sub-Saharan Africa tend to rely heavily on milk, livestock products and especially cereals for food.1,6,15,22,24 These diets lack in diversity, adequate amounts of micronutrients necessary for growth and development and contribute to malnutrition.
Stunting was the most prevalent (19.1%) form of undernutrition found in this study. The 18–23month age group also had higher proportions of stunting as compared to the other age groups. Child age was significantly associated (p ≤ 0.05) with the rates of stunting, underweight and wasting. This finding is comparable with the other national Demographic Health Surveys (DHS) that have been undertaken in 14 different developing countries (including Kenya), where, overall and for each country, the prevalence of stunting increased with increase in age group.25 As is illustrated in the WHO conceptual framework for childhood stunting, the main cause of stunting is chronic inadequate complementary feeding, which subsequently leads to both short-term and long-term health, nutritional and economic consequences.26 The Lancet 2008 series highlighted that appropriate complementary feeding practices have the capability to reduce stunting in children aged five years and under – with or without food supplementation – and in both food-secure and food-insecure households by 6%.11 Therefore, the higher stunting proportions in children 18-23 months (as compared to 6-11 and 12-17 months) among the pastoralist communities might be due to the poor complementary feeding practices starting early on. While the overall severity of underweight prevalence was low (<10%), children aged 18-23 months were found to have a higher proportion of underweight, as compared to the other groups (6-11, 12-17 months). This increasing trend had a close similarity to the trend in the weighted total prevalence of underweight conducted in 14 low-income countries.25
Similar to stunting, higher underweight levels among children aged 18-23 months might be an indication of poor complementary feeding practices that start early on in an infant’s life, prior to attaining this age. The study did not however find significant relationships between nutritional status and complementary feeding practices. This was contrary to evidence suggesting that the relationship between nutritional status and complementary feeding practices is significant.1; 25-28The study found that undernutrition (stunting and underweight) was significantly higher in male children than female children. Other studies have also established similar findings of male children having a higher prevalence of undernutrition than their female counterparts.1, 8 Although the cause of the feeding disparities was not identified in this study, cultural issues and beliefs might have played a key role. While no relationship was found between caregiver’s age and caregiver education level with child feeding practices; the study found that these socio-demographic characteristics had an association with underweight and wasting (p ≤ 0.05).
Conclusions
Appropriate complementary feeding is crucial in determining short-term and long-term effects on the human being. The study found that sub-optimal complementary feeding practices started early in life thereby contributing to undernutrition. This study has established that among pastoralist communities, the key determinants for complementary feeding practices and nutritional status of children 6-23months are child’s age, child’s sex, caregiver’s age, and caregiver’s education level. In addition to strengthening nutrition education targeting the household members, scale up of women empowerment interventions is recommended in promoting child nutrition through education/literacy programmes, food-based approaches, and income generation activities. Behaviour change communication programmes should be integrated across to promote and sustain appropriate child feeding practices, particularly with regards to dietary diversity and to the inappropriate introduction of complementary foods. Doing so would address the underlying causes of poor complementary feeding practices that relate to cultural practices. Multi-disciplinary qualitative studies should be conducted to determine the sociocultural aspects influencing feeding practices, such as why boys, in comparison to girls, tend to be fed poorly in pastoralist communities. Establishing the reason for the gender bias in feeding practices would facilitate a gaining of insight into which evidence-based interventions should be put in place.
Strength and limitation
The study identified meaningful insights, leading to an improved understanding of the determinants of complementary feeding practices and nutritional status of pastoralist communities. On the contrary, the study suffers some bias because only one pastoralist tribe in the county was studied due to accessibility.
Acknowledgement
The authors would like to express gratitude to Merti health centre that supported with anthropometric equipment, and the enumerators who worked diligently to ensure that credible information was collected. The principal researcher would also like to sincerely thank her mother, Beatrice for moral support.
Author’s contribution
DA Amunga, developed the idea and the protocol, planned the study, undertook, and supervised data collection by the enumerators, captured the data for analysis, analysed the data with the assistance of statistician (Prof J Harvey), interpreted the data, and drafted the manuscript. Dr L Daniels and Prof S Ochola participated in all the stages of the study and contributed to the revision of the manuscript.
Conflict of Interest
We declare that there was no conflict of interest.
Funding Sources
The study was funded by Stellenbosch University Rural Medical Partnership Initiative (SURMEPI) grant.
References
- Kenya National Bureau of Statistics. Demographic and Health Survey.; 2008. Accessed 2012. https://www.dhsprogram.com/pubs/pdf/FR229/FR229.pdf
- World Health Organization. Global Strategy for Infant and Young Child Feeding.; 2003. Accessed January 2013. https://www.who.int/publications/i/item/9241562218
- World Health Organization. HIV and Infant Feeding Guidelines on Principles and Recommendations for Infant Feeding in the Context of HIV and a Summary of Evidence 2010.; 2010. Accessed January 2013. https://apps.who.int/iris/handle/10665/44345
- Scaling up Nutrition: A Framework for Action. Vol 31.; 2010:178-186. doi:10.1177/156482651003100118
CrossRef - Macharia-Mutie CW, Brouwer ID, Mwangi AM, Kok FJ. Complementary feeding practices and dietary intake among children 12-23 months in Mwingi District, Kenya. International Journal of Food Safety, Nutrition and Public Health. 2010;3(1):45-56. Accessed February 2013. https://doi.org/10.1504/IJFSNPH.2010.032034
CrossRef - Mamiro PS, Kolsteren P, Roberfroid D, Tatala S, Opsomer AS, Van Camp JH. Feeding Practices and Factors Contributing to wasting, stunting, and iron-deficiency Anemia among 3-23-month-old Children in Kilosa district, Rural Tanzania. Journal of Health, Population and Nutrition. 2005;23(3):222-230.
- Kimani-Murage EW, Madise NJ, Fotso J-C, et al. Patterns and determinants of breastfeeding and complementary feeding practices in urban informal settlements, Nairobi Kenya. BMC Public Health. 2011;11(1). doi:10.1186/1471-2458-11-396
CrossRef - Gupta N, Gehri M, Stettler N. Early Introduction of Water and Complementary Feeding and Nutritional Status of Children in Northern Senegal. Public Health Nutrition. 2007;10(11):1299-1304. doi:10.1017/s1368980007696384
CrossRef - Black RE, Allen LH, Bhutta ZA, et al. Maternal and Child undernutrition: Global and Regional Exposures and Health Consequences. The Lancet. 2008;371(9608):243-260. doi:10.1016/s0140-6736(07)61690-0
CrossRef - Bloss E, Wainaina F, Bailey RC. Prevalence and Predictors of Underweight, Stunting, and Wasting among Children Aged 5 and under in Western Kenya. Journal of Tropical Pediatrics. 2004;50(5):260-270. doi:10.1093/tropej/50.5.260
CrossRef - Jones G, Steketee RW, Black RE, Bhutta ZA, Morris SS. How many child deaths can we prevent this year? The Lancet. 2003;362(9377):65-71. doi:10.1016/s0140-6736(03)13811-1
CrossRef - Agostoni C, Decsi T, Fewtrell M, et al. Complementary Feeding: A Commentary by the ESPGHAN Committee on Nutrition. Journal of Pediatric Gastroenterology and Nutrition. 2008;46(1):99-110. doi:10.1097/01.mpg.0000304464. 60788.bd
CrossRef - Schack-Nielsen L, Sørensen TI, Mortensen EL, Michaelsen KF. Late Introduction of Complementary Feeding, rather than Duration of Breastfeeding, May Protect against Adult Overweight. The American Journal of Clinical Nutrition. 2009;91(3):619-627. doi:10.3945/ajcn.2008.27078
CrossRef - Sellen DW. Weaning, Complementary Feeding, and Maternal Decision Making in a Rural East African Pastoral Population. Journal of Human Lactation. 2001;17(3):233-244. doi:10.1177/089033440101700307
CrossRef - Sadler K, Katley A. Milk Matters: The Role and Value of Milk in the Diets of Somali Pastoralist Children in Liben and Shinile, Ethiopia.; 2009. http://hdl.handle.net/10427/71180
- Ministry of Health, Kenya. Nutrition Portal | MIYCN Assessments Reports. Nutrition Portal. Published 2013. Accessed November 2013. https://www.nutritionhealth.or.ke/reports-capacity-assessment-reports/miycn-assessments-reports/#toggle-id-5
- Kenya National Bureau of Statistics. Kenya Population and Housing Census.; 2019.
- World Health Organization. Indicators for Assessing Infant and Young Child Feeding Practices Part 1 Definitions.; 2007. http://apps.who.int/iris/bitstream/handle/10665/43895/9789241596664_eng.pdf?sequence=1
- Cooperative for Assistance and Relief Everywhere, Inc. (CARE). Collecting and Using Data: A Step-By-Step Guide Infant and Young Child Feeding Practices.; 2010. https://www.nutritioncluster.net/sites/nutritioncluster.com/files/2019-12/final-iycf-guide-iycf-practices_eng.pdf
- World Health Organization. Indicators for Assessing Infant and Young Child Feeding Practices Part 2 MeasureMent.; 2010. Accessed November 2012. http://apps.who.int/iris/bitstream/handle/10665/44306/9789241599290_eng.pdf?sequence=1
- World Health Organization. The WHO Child Growth Standards. www.who.int. Published 2006. https://www.who.int/toolkits/child-growth-standards/standards
- Aemro M, Mesele M, Birhanu Z, Atenafu A. Dietary Diversity and Meal Frequency Practices among Infant and Young Children Aged 6–23 Months in Ethiopia: a Secondary Analysis of Ethiopian Demographic and Health Survey 2011. Journal of Nutrition and Metabolism. 2013;2013:1-8. doi:10.1155/2013/782931
CrossRef - Sawadogo SP, Yves M-P, Claire M-R, et al. Late introduction, and poor diversity were the main weaknesses of complementary foods in a cohort study in rural Burkina Faso. Nutrition. 2010;26(7-8):746-752. doi:10.1016/j.nut.2010.02.010
CrossRef - Food and Agriculture Organization: Food Security Analysis Unit. Somali Knowledge Attitudes and Practices Study: Infant and Young Children Feeding and Health Seeking Practices.; 2007.
- Marriott BP, White A, Hadden L, Davies JC, Wallingford JC. World Health Organization (WHO) Infant and Young Child Feeding Indicators: Associations with Growth Measures in 14 low-income Countries. Maternal & Child Nutrition. 2011;8(3):354-370. doi:10.1111/j.1740-8709.2011.00380.x
CrossRef - Stewart CP, Iannotti L, Dewey KG, Michaelsen KF, Onyango AW. Contextualising Complementary Feeding in a Broader Framework for Stunting Prevention. Maternal & Child Nutrition. 2013;9(Suppl2):27-45. doi:10.1111/mcn.12088
CrossRef - Bhutta ZA, Das JK, Rizvi A, et al. Evidence-based Interventions for Improvement of Maternal and Child nutrition: What Can Be Done and at What cost? The Lancet. 2013;382(9890):452-477. doi:10.1016/s0140-6736(13)60996-4
CrossRef - Arimond M, Ruel MT. Dietary Diversity Is Associated with Child Nutritional Status: Evidence from 11 Demographic and Health Surveys. The Journal of Nutrition. 2004;134(10):2579-2585. doi:10.1093/jn/134.10.2579.
CrossRef
Accepted on: 07 Apr 2022
Second Review by: Shipra Gupta India
Final Approval by: Dr. Neha Sanwalka


Web of Science Coverage
Emerging Sources Citation Index (ESCI)
2024 Journal Impact Factor: 1.1
Scopus Journal Metrics
CiteScore 2025: 2.6
CiteScore Details
Sustainable Nutrition: Food Systems, Nutrient Retention, and Public Health Impact
![]()
This journal is a member of, and subscribes to the principles of, the Committee on Publication Ethics (COPE)


