Assessment of Fast and Junk Food Consumption and Addiction among Saudi Population. National Descriptive Study 2020.
Samar A.Amer1*
, Mostafa A.Amer3, Nouf Al Aleisa4 and Eman Elsayed Abd-Ellatif5 1Department of Public Health and Community Medicine, Faculty of Medicine, Zagazig University, Egypt..
2Department of Clinical Health Education, Ministry of Health, Riyadh, Saudi Arabia .
3Faculty of Medicine, Zagazig University, Egypt.
4Department of Clinical Health Education, Ministry of Health, Riyadh, Saudi Arabia.
5Department of Public Health and community medicine, Faculty of Medicine, Mansoura University, Egypt.
Corresponding Author Email: samar11@yahoo.com
DOI : http://dx.doi.org/10.12944/CRNFSJ.10.1.02
Download this article as:
![]()
Kingdome of Saudi Arabia (KSA) has undergone lifestyle changes that have resulted in unhealthy dietary patterns So this study aims to investigate the frequency, determinants, and the context of Fast Food (FF), and Junk Food (JF) consumption, to study the effect of the Saudi Food and Drug Authority (SFDA) food related policy, and to study the use of Ministry of Health (MOH) calorie guide among Saudi population all over KSA. Through a cross-sectional study recruited 355 randomly selected Saudis stratified to represent the 20 health regions in KSA through a self-administered and validated questionnaire. Ethical approval was obtained for this work. Results; The majority had age distribution between 20- less than 40 y, and 218 (61.4%) were single. The prevalence of FF, and JF consumption was 308 (86.7 %).The most frequently consumed FF in descending order were (French fries, Shawarma, Burger, then Pizza) , while the most frequently consumed JF in descending order were (all kinds of cocoa, and cakes, then Ice cream), and more than half of participants did not drink carbonated soft drinks. Dinner was the main time of consuming FF (79.2%), and soft drinks (55.6%), while sweets were consumed mainly as snack (68.8%). The consumption of FF, and JF were significantly higher among young participants. The most common causes for consuming the above mentioned foods were entertainment 173 (48.5%), eating with friends 100 (28.1%) and due to better taste 92 (25.8%). The majority 48.7% of Saudi were unaware about the SFDA food related policy. Although the use of calorie labeling policy significantly (p less than 0.05) affected the food choices, reduced the average weekly spending on Saudi Riyal, but not on weight loss. We concluded that FF, and JF consumption among Saudis is a prevalent, and complex problem, indicating a critical need for community-based interventions to change the attitudes and behaviors toward healthy eating.
KEYWORDS:Consumption; Fast food; Junk food; mandatory menu labeling; Nutrition; policy; Saudi Arabia
Introduction
Since few decades, Kingdome of Saudi Arabia (KSA) was considered as a country with advanced nutrition transition, and undergoing epidemiological and demographic transition1. Because of moderate level of undernutrition and high levels of overweight 30.7% and obesity 28.7% 2, its health detriments aggravates Non Communicable Diseases (NCDs) which responsible and for approximately 73% with more than 90,000 deaths per year 3,4
In United States (US) in 1918, was the first established Fast food (FF) restaurant, and popularized among US adults in 1950s. At present fast food restaurants are one of the largest segments of the food industry with over 200,000 restaurants and $120 billion in sales in the U.S. Alone, nowadays, McDonald’s, KFC and Pizza Hut are multinational corporations with global outlets.5
Junk Food (JF) are food products which are high in salt, sugar, saturated fats and energy (calories) and contain little or no proteins, vitamins or minerals, most JF regarded as fast foods ( FF) as they are easily prepared, served fast but not all , a readily available, usually inexpensive, maybe nutritious, as candy, soft drink, energy drink, chips, and sweets dessert.6, 7 It has short and long terms harmful effects that leads to gain weight and being overweight, obesity, and be a risk for diseases e.g., heart diseases, diabetes.8 It has too much salt, which worsen hypertension. Similarly, soft drinks, cordials, cakes, and biscuits have high amount of sugars, which affects teeth badly.9 It is a risk factor of raised low density lipoprotein (LDL) cholesterol levels, compromise immune system and a greater chance of contracting cancers (colon, breast, prostate, gallbladder, ovarian) because so low levels of antioxidants.10
In KSA Fast food (FF) is a major enterprise, it is designed for ready availability, with little consideration to quality11, e.g., Hamburgers, French fries, chicken nuggets, Pasta, Pizza and Shawarma, which are offered in all restaurants with most meal packages 15–20 Saudi Riyal( SAR). Therefore, its trend and market is increasing expected to reach $4.5 billion in overall sales by 2015, due to increasing demand.9 It contains high amounts of sodium and unhealthy fats that leads to elevating the systolic and diastolic blood pressure among both adults and children. Also due to its increasing availability, energy density, and large portions, it is positively associated with the obesity epidemic. 12, 13,10
Saudi vision 2030 emphasizes on the importance of compacting to NCDs because of the cost and ineffectiveness of the treatment. The Saudi Ministry of Education (SMOE) established the “Regulations of Health Conditions for School Canteens” in 2004 and updated the regulations in 2013 14 to reduce chronic diseases and improve health of students. The ministry of health (MOH) establish calorie guide and the food calorie calculator on it’s website.2 In the end of 2018, Restaurants and cafés display calories on the menus, according to an initiative launched by the Saudi Food and Drug Authority, which is a supportive health policy decision to realize the vision. 15
Significance of the study
KSA controls about 38.5 % of all restaurant investments in Arab countries. In 2018, the Commercial records of restaurant activity in KSA grew by 19 percent, with 13,501 restaurant-exported records compared to 11,290 in 2017 with a total number of 64,074 registers of existing restaurant activity.16 The increased consumption of FF and JF associated with increased risk of early development of diet-related NCDs , and its related complications17 and all can be prevented, the evidence paints a convincing picture. For better weight control, reduced risk of NCDs and to improve the overall health status, make FF, and JF consumption an occasional treat, not an everyday indulgence.
Therefore, this study aims to assess and improve the dietary habits among Saudi population through evidence-based assessment of FF, And JF consumption to aid policy makers and health sectors for better management and preventive measurements. Through the following objectives among Saudi population during January 2020; 1) To study the frequency determinants, and the context of Fast Food (FF), and Junk Food (JF) consumption; 2) To study the effect of the Saudi Food and Drug Authority (SFDA (food related policy, and 3) To study the use of Ministry of Health (MOH) calorie guide among Saudi population all over the KSA.
Materials and Methods
Study design, setting, participants
A descriptive study (cross section study, targeted 355 randomly selected Saudis from all over 20 health region in KSA who fulfilled the selections criteria (Saudi, aged between 10 – ≤65 years. 15,531,201,18 Internet users (91%) 19, after excluding illiterate (5.2%), and population with mental, or psychological disorders.
Sample size
Sample size was participants calculated using EPI info website, with all total no of 15,531,201 after excluding illiterate around 3 million so the target population 12,212,742 . The prevalence of internet users 91%19 so the total population will be 11,125,581. FF, JF consumption among Saudi Arabia was 86.5% 8 with a precision of 0.5% at a 95% confidence level and power of the study 80%.
Data collection instrument
Pre-tested, pre-coded, well structured, and a self-administrated questionnaire was used to collect data. The questionnaire was designed in Arabic on the Google forms. An assessment schedule was developed and experts for validating its content and its reliability was estimated
The questionnaire was constructed from four main parts to collect data about:
The demographic characteristics.
The Frequency of the consumption of different kinds of JF and FF.
- FF items ( Burger , French fries, Prostaed, Shawarma , Quick-preparation noodles (Indomi) ,Pizza , and Tortilla)
- JF items ( Drinks Consumption ,and sweets consumption)
- Drinks consumption includes (Pepsi, Citrus, Energy Drinks (Kudrd-Payson-Red bull)
- Sweets consumption (Cookies and biscuits, All kinds of Cakes , Cheesecake, Basbousa – Kunafa – Bakalwa, Pancake – Crepe – Donant , and Ice cream)
The frequency of food consumption was collected through a Likert scale as the following;
I don’t eat at all (never) =0 1-2 a month=1 Less than 4 times a month=2
once a week=3 2-4 times a week =4 5 times or more times a week =5
The total food consumption score is the sum of the frequency of each items of the studied food
The context of its consumption locations, weekly cost and reasons .20
Public knowledge about the following three SFDA food related polices (Compulsory free price application of calories labelling all restaurants and cafes, elimination of Trans and saturated fats use in food manufactures by 2020, and school canteens are free from harmful food and beverages) and its effect on food choices, losing weight and weekly spending .
The knowledge, and use of MOH’s Guide to Calories, and MOH applications to calculate calories.21
Statistical analysis
The collected data were coded and analyzed by using SPSS (version 22), mean, median, standard deviation and range were used for quantitative data summarization, and Kruskall Wallis test was used for their analysis. Frequency (F) and Percentage (%) were used for qualitative data analysis and Chi-square test was used for its analysis. The considered level of significant was (P-value ≤ .05).
Results
Demographic data
Out of the 355 Saudis who completed the questionnaire. 200 (56.3%) aged between 20-< 40 y, 218 (61.4%) were single, 228 (63.9 %) holding university degree or higher. 151 (42.5% and 41.7%) were employee and students respectively, 185 (52.1%) had enough monthly income. 95 (26.7%) were suffering from weight gain or obesity and 208 (58.4%) do not suffer any chronic illness. Most of our participants reported that their own health was very good 139 (39.2%) and excellent 133 (37.5%) (Table 1).
Table 1; Socio-demographic Characteristics and its relationship with the FF, Sweets, and drinks total scores among the studied Saudi participants
tbody>
| JF consumption | FF consumption | ||||
| TotalF(%) | Total FF ,and JF consumption scoreMedian (mean±SD)(range) | Total drink consumption scoreMedian (mean±SD) | Total sweet consumption scoreMedian (mean±SD) | Total score Median (mean±SD) |
|
| Age groups (y) 10-<20 20-<40 40-<50 50 -<6060 y or more |
96(27%) 200(56.3%) 41(11.5%) 14(3.9%) 4(1.1%) |
32(32.6±11.6) (6-64) 28(27.7+-14.2) (0-74) 19(20.6+-8.1) (4-38) 24(22.9±7.8) (13-34)6 |
4(4.5±3.6) 1(2.7±3.6) 0(0.7±1.7) 0(1.5±1.9) 0 |
15(14.6±5.6) 13(12.6±7.3) 10(11.4±6.3) 9.5(10.1±4.7) 8(8±4.6) |
13(13.3±6.1) 12(11.9±6.6) 8(8.8±4.9) 12(11.1±5.6) 5.5(7±6.2) |
| P | 0.00* | 0.00* | 0.01* | 0.002* | |
| Level of education Primary/preparatory Secondary/high school University or higher | 19(5.1%) 108(29.9%) 228(63.9%) |
32(33.4±8.9) (33-58) 29.9(28.9±12.9) (0-46) 27(27.4±13.6) (0-74) |
4(4.6±2.8) 3(3.5±3.6) 1(2.6±3.3) |
15(14.6±4.2) 14(13.2±6.7) 12(12.8±6.9) |
13(14.6±3.9) 12(11.8±6.2) 12(11.9±8.6) |
| P | 0.29 | 0.03* | 0.27 | 0.53 | |
| OccupationNon-employee/ housewife EmployeeStudent |
56(15.8%) 151(42.5%) 148(41.7%) |
22(24.2±12.6) (3-56)31 (31.4±13.4) (0-74)25 (25.9±12.7) (0-66) |
0(2.2±3.4) 4(4.1±3.6) 0(2.1±2.9) |
12(12.5±6.4) 14(13.9±6.4) 12(12.2±7.1) |
10(9.6±6.3) 12.5(13.1±6.6) 11(11.5±5.9) |
| P | 0.00* | 0.000* | 0.053 | 0.001* | |
| Marital status • Single • Married • Divorced • Widower |
218(61.4%) 119(33.5%) 14(3.9%) 4(1.1%) |
30(29.9±13.5) (0-74) 25(25.7±12.4) (0-66) 22(20.6±8.5) (12-38) 9(10.3±5.3) (6-17) |
3(3.6±3.7) 0(1.9±2.8) 0(0.8±1.7) 0(1.3±2.5) |
14(13.5±6.6) 12(12.5+-7.0) 10.5(11.1±6.4) 4(4.5+-1.7) |
12(12.7±6.6) 10(11.7±6.5) 7.5(9.2±4.1) 3.5(4.5±3.3) |
| P | 0.000* | 0.000* | 0.027* | 0.002* | |
| Monthly income • Enough • Not enough • Enough and more |
185(52.1%) 110(31%) 60(16.9%) |
26(26.6±11.9) (0-60) 30(32.7±15.1) (0-74) 24(23.6±10.9) (0-74) |
2(2.8±3.3) 3(3.9±3.9) 0(1.6±2.3) |
12(12.2±6.3) 14(14.7±1.3) 12(12.1±6.6) |
11(11.4±5.9) 14(13.7±7.2) 10(10±5.7) |
| P | 0.00* | 0.00* | 0.005* | 0.001* | |
| The self-assessment of own health • Excellent • Very good •Good .Bad |
133(37.5%) 139(39.2%) 74(20.8%) 9(2.5%) |
28(28.9±12.9) (0-74) 28(28.5±13.5) (0-65) 28(28.2±13.1) (6-66) 41(34.3±16.3) (12-58) |
2(2.7±3.4) 2(2.7±3.1) 3(3.5±3.9) 5(5.3±4.1) |
13(12.4±6.4) 14(13.8±7.2) 11(12.2±6.6) 17(13.9±7.1) |
12(11.5±6.4) 12(12.1±6.3) 11(11.8±6.4) 17(15.1±7.4) |
| P | 0.39 | 0.06 | 0.28 | 0.42 | |
*p <0.05 there was a statistical significant difference
The frequency of FF and JF consumption was 308 (86.7%). Fifty SAR is the median weekly spending on FF and JF while the range is (0-1500) (Table 2).
Table 2; FF and JF; Frequency of consumption, average weekly spending on and comorbidities among the studied participants
| F | % | |
| Comorbidities • No comorbidities • Overweight or obesity • Hypertension •Diabetes Mellitus • Dyslipidemia • Thyroid disorders • Heart diseases • Liver or kidney disorders • Mental or neurological disorders • Other |
208 95 9 16 14 16 8 6 21 35 |
58.4 26.7 2.5 4.5 3.9 8.4 2.2 1.7 5.9 9.8 |
| Average weekly spending in Riyal on fast food | Median (mean ±SD )100(116.9±158.2) | (Range)(0-1500) |
| The consumption of FF or JF • Consume of FF and/or JF • Don’t Consume of FF and/or JF |
F 308 47 |
%86.8 13.2 |
As regards the Determinants of FF , and JF consumption
The scores of FF, dessert, soft drinks and total FF consumption were significantly higher in the age group of (10-<20 y) and lowest in (40-<50 y). Furthermore, these scores were higher in participants with educational level of Primary/preparatory and lower in those with university or higher qualifications. Moreover, the highest scores were in; employee, single persons, those with insufficient monthly income and those with bad self-health self-assessment (Table 1)
As regards the frequency rate of FF consumption
(table 3); the total score of FF consumption; median (mean± SD) equals 12 (11.9±6.4) (0-35). The FF of highest consumption rate were of descending order (French fries, Shawarma, Burger, and then Pizza).
As regards the frequency rate of drinks consumption
interestingly, more than half of study participants did not drink carbonated soft drinks. Of those who consumed, (15.5 % and 8.7% drank Pepsi and Citrus once per week, respectively, while only 5.1% drank energy drinks 2-4 times per week. The total score of soft drink consumption; median (mean± SD) equals two (2.9±3.4) (0-15). (Table 3).
Table 3; The Frequency of consumption of different types of FF, and JF among the studied Saudi participants
| Never F (%) | 1-2/monF (%) | <4 /monF (%) | 1 / wk. F (%) | 2-4 /wk. F (%) | ≥5 /wk F (%) | Total score Median(mean±SD) | |
| Fast Food Consumption | |||||||
| Burger | 70(19.7%) | 92(25.9%) | 51(14.4%) | 84(23.7%) | 49(13.8%) | 9(2.5%) | 2(1.9±1.4) |
| French fries | 73(20.6%) | 32(9%) | 101(28.5%) | 79(22.3%) | 11(3.1%) | 3(2.3±1.5) | |
| Prostaed | 142(40%) | 80(22.5%) | 56(15.8%) | 54(15.2%) | 20(5.6%) | 3(0.8%) | 1(1.3±1.3) |
| Shawarma | 71(20%) | 78(22%) | 45(12.7%) | 96(27%) | 51(14.4%) | 14(3.9%) | 2(2.1±1.5) |
| Quick-preparation noodles (Indomi) | 195(54.9%) | 47(13.2%) | 39(11%) | 33(9.3%) | 26(7.3%) | 15(4.2%) | 0(1.1±1.5) |
| Pizza | 64(18%) | 95(26.8%) | 51(14.4%) | 95(26.8%) | 37(10.4%) | 13(3.7%) | 2(1.95±1.4) |
| Tortilla | 160(45.1%) | 60(16.9%) | 51(14.4%) | 58(16.3%) | 17(4.8%) | 9(2.5%) | 1(1.3±1.4) |
| Total score | Median(mean±SD)(range) = 12(11.9±6.4)(0-35) | ||||||
| JF Consumption | |||||||
| a- Drinks Consumption | |||||||
| Pepsi | 177(49.9%) | 30(8.5%) | 14(3.9%) | 55(15.5%) | 50(14.1%) | 29(8.2%) | 1(1.6±1.8) |
| Citrus | 246(69.3%) | 21(5.9%) | 14(3.9%) | 31(8.7%) | 21(5.9%) | 22(6.2%) | 0(0.9±1.6) |
| Energy Drinks (Kudrd-Payson-Red bull) | 303(85.3%) | 12(3.4%) | 8(2.3%) | 11(3.1%) | 18(5.1%) | 3(0.8%) | 0(0.42+-1.1) |
| Total score | Median(mean±SD)(range ) = 2(2.9±3.4)(0-15) | ||||||
| – Sweets Consumption | |||||||
| Cookies and biscuits | 119(33.5%) | 61(17.2%) | 32(9%) | 90(25.4%) | 45(12.7%) | 8(2.3%) | 1(1.7±1.6) |
| All kinds of Cakes | 80(22.5%) | 78(22%) | 31(8.7%) | 101(28.5%) | 55(15.5%) | 10(2.8%) | 2(2.0±1.5) |
| Cheesecake | 141(39.7%) | 83(23.4%) | 51(14.4%) | 61(17.2%) | 16(4.4%) | 3(0.8%) | 1(1.3±1.3) |
| Basbousa – Kunafa – Bakalwa | 92(25.9%) | 82(23.1%) | 39(11%) | 101(28.5%) | 30(8.5%) | 11(3.1%) | 2(1.8±1.5) |
| Pancake – Crepe – Donant | 127(35.8%) | 78(22%) | 45(12.7%) | 65(18.3%) | 28(7.9%) | 12(3.4%) | 1(1.5+-1.5) |
| Ice cream | 82(23.1%) | 80(22.5%) | 30(8.5%) | 106(29.9%) | 42(11.8%) | 15(4.2%) | 2(1.8±1.5) |
| Total score | Median(mean±SD)(range ) 13(12.9+6.9)(0-35) | ||||||
Mon —month wk—-week / —— per
As regards the frequency rate of sweets consumption
The total score of dessert consumption; median (range) equals 13 (0-35).The highest consumption rate of various desserts were in the descending order (Cocoa of all kinds, the cake of all kinds, Ice cream, and then Cookies and biscuits) (table 3).
As regards the context (timing, and causes) of FF, and JF consumption
Dinner was the main times of consuming FF (79.2%), and soft drinks (55.6%) while sweets were consumed mainly as snack (68.8%) (Table 4). As regards the reasons for eating the aforementioned food or beverages, the most common causes were entertainment 173 (48.5%), eating with friends 100 (28.1%), and due to better taste of fast food 92 (25.8%) (Fig 1).
Table 4: Times of FF, and JF consumption among the studied Saudi participants.
| BreakfastF (%) | LunchF (%) | DinnerF (%) | SnackF (%) | |
| FF consumption | 17(4.8) | 38(10.7) | 282(79.2) | 26(7.3) |
| JF consumption ü Sweets ü Soft drinks |
27(7.6) 21( 5.9) |
26(7.3) 106(29.8) |
71(19.9) 198(55.6) |
245(68.8) 59(16.6) |
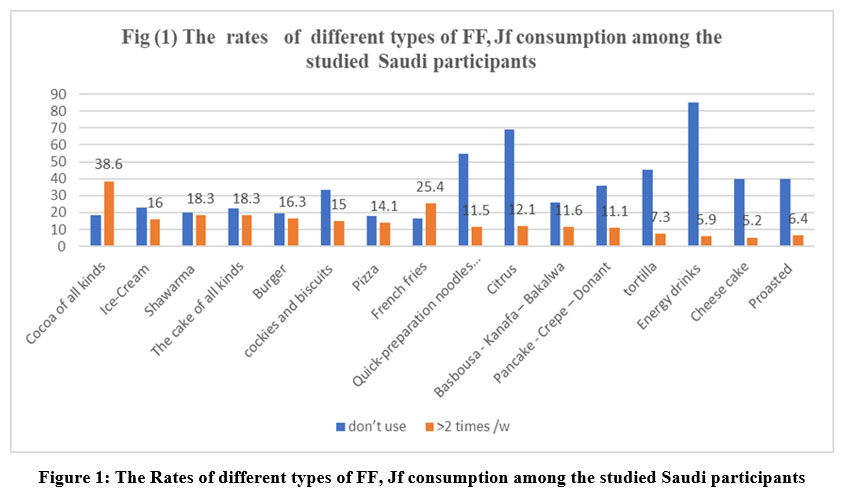 |
Figure 1: The rates of different types of FF, Jf consumption among the studied Saudi participants |
As regards the knowledge about SFDA , and MOH food related polices
Table (5) displays that about 173 (48.7%) did not know about any of the SFDA food related policies in KSA. While {222 (62.4%), 220 (61.4%), 130 (36.5%) and 108(30.3%)} had a knowledge regarding compulsory free price application of calories labelling by all restaurants and cafes, elimination of trans- and saturated-fats use in food manufactures by 2020 school canteens were free of harmful food and beverages and didn’t know any of these the SFDA food related policies, respectively, in the descending order .
Table 5: Saudi Publics’ knowledge about the SFDA food related policies and use of (MOH) applications related to foods
| F | % | |
| Know about any of the policies related to fast or harmful foods yes no may be |
84 173 98 |
23.7 48.7 27.6 |
| The Knowledge about SFDA food related policiesØ Compulsory free price application of calories labelling all restaurants and cafes Ø Elimination of Trans and saturated fats use in Food manufactures by 2020 Ø School canteens are free from harmful food and beverages Ø Don’t know any of the abovementioned SFDA food related policies |
222 220 130 108 |
62.4 |
| Know about the MOH’s Guide to Calories know it Don’t know |
193 162 |
54.4 54.6 |
| Use or open MOH’s Guide to Calories Use Don’t Use |
99 256 |
27.9 72.1 |
| Know about the MOH’s application to calculate calories know it Don’t know |
182 173 |
51.3 48.7 |
| Use or open MOH’s application to calculate calories Use Don’t Use |
96 259 |
27 73 |
In terms of the impact of the mandatory application of calories policy, our study participants changed their fast foods choices [98 (27.6%), 119 (33.5%)] and reduced average weekly FF spending [90 (25.4%), 92 (25.9%)] but weight loss did not occur in 221 (62.3%) Table (6).
Table 6: the effect of the compulsory application of calories labelling policy in SA
| Yes F (%) | To some extent F (%) | Not changed /unaffected F (%) | |
| The food choices are affect | 98(27.6) | 119 (33.5) | 138 (38.9) |
| Losing weight. | 53 (14.9) | 81 (22.8) | 221 (62.3) |
| Reduction in average wk. spending(SR ) | 90 (25.4) | 92 (25.9) | 173 (48.7) |
Discussion
This study highlighted the high prevalence of fast food consumption among Saudis. Recently, Saudi Arabians’ lifestyles have changed dramatically in two ways: dietary patterns and sedentary lifestyles. Today’s dietary patterns favor energy-dense foods like fast foods and sugar-sweetened beverages over nutrient-dense foods like fruits and vegetables. 22
In the current study, we found the frequency of FF, and JF consumption was 308 (86.7%), which was higher what 70.8% of Adults. 23 This higher prevalence could be explained by the increasing number of franchised FF, and JF restaurants, cultural trends, tasty flavor, eating at social gatherings, easy access, and appealing high calorie snacks, particularly in urban areas and found in supermarkets across the country, because of the invasion of Western lifestyle, which has a significant impact on the Saudi community. 24
French fries, Shawarma, Pizza, and Burger were the most frequently consumed food items on a weekly basis. This finding matched the findings of Washi and Ageib 22, who reported that more than two-thirds (69.5 percent) of the participants chose from all of the unhealthy options, such as, pizza, hamburgers, and French fries.
Pepsi, citrus fruits, and Energy Drinks were consumed once or more per week. Ice cream, cake, Basbousa – Kanafa – Bakalwa, cookies and biscuits, and cocoa of all kinds were consumed once or more per week. These findings are consistent with those of a study conducted in Dammam, KSA, which found that 77.4 % of participants consumed soft drinks at a slightly higher rate in females than males (85 percent and 67 percent, respectively), and that 30 percent of them did so three times or more per week. The majority of participants (91.3%) admitted to eating FF the majority of whom did so twice or less per week, and approximately 25% of the students; the majority of whom were males (85%) and did so three times or more per week.25
This study reported that FF, and JF consumption were significantly higher among younger Saudis, in agreement with our finding; Washi and Ageib22 discovered that the majority (84.9%) of adolescents in Jeddah rely on FF rather than homemade food. Similarly, Hijazi et al.26 discovered that nearly one-third (39%) of children aged 12, consumed FF “occasionally” (2-3 times by week). Young people preferred FF, and JF to home-cooked meals, and this was common practice among this age group because the attractive advertisement, its pocket friendly nature.10
Consistent with our finding; Adams et al 27 , reported that higher education, and highest occupational social class were significantly less likely to consume fast food, and was associated with a higher level of job involvement, including more complex work tasks and increased responsibility. 28
Furthermore, those with insufficient monthly income and those with poor self-health self-assessment scored the highest scores of FF, and JF consumption. These findings indicated that traditional food consumption decreased in societies with low income and lower education levels, while FF and prepared foods increased. These could be attributed to a lack of knowledge about healthy food consumption or insufficient levels of physical activity. 27
Our findings showed that participants with a low educational level, employees, and single people consumed significantly more FF. In different populations, reports of associations between education and fast food consumption produced inconclusive results. Hidaka et al. found that higher education was associated with more frequent fast food consumption among women but not men. A representative sample of adults aged 18–64 years in Michigan, on the other hand, found no correlation between fast food consumption frequency and education 29. Americans People who worked ate fast food more frequently than people who do not work.30 These findings are consistent with those of a study conducted by Adams et al.27, which revealed that FF consumption was higher among adults who worked.
The reported reasons or motives for eating FF among our participants were entertainment, eating with friends, and better taste of fast food in descending order. These finding were consistent with the findings of the Benajiba study (2020) , which reported that other factors that may encourage people to eat at FF restaurants, included ease of access, availability, quick service, no wait staff, heavily advertised, low prices, paying for meals before they are received, and the option to consume the meal at the restaurant, takeout, drive through, or even free delivery.1 Furthermore, they enjoy the flavor of fast foods, such as eating fast food at social gatherings, and they have easy access to fast foods, particularly in urban areas.24
Despite the fact that three-quarters of the participants (272) rated their own health as excellent or good, 147 (41.6%) of the participants suffered from comorbidities, such as, weight gain and obesity, mental and neurological disorders, diabetes mellitus, thyroid diseases, high cholesterol, and heart disease in the descending order. Several studies have found an increased risk of weight gain with increased consumption of FF. These findings could be explained by the fact that much FF is energy-dense meals with a high content of fat, refined starches and sugars, and a correspondingly low water content. Consumption of FF and JF leads to high cholesterol levels and heart attacks due to deep-frying in partially hydrogenated oils (or Trans fats). These foods, when combined with starchy vegetables and sugary drinks, have a high glycemic load, which contributes to obesity and diabetes.1
Without a doubt, this excessive FF, and JF consumption has serious consequences for the nation’s health and well-being. The SFDA implemented many new policies, such as, mandatory calorie labeling in restaurants and cafes, which nearly half of participants were unaware. This finding contradicts the findings of Radwan et al.31, study in the United Arab Emirates, which discovered that the majority of participants supported the mandatory menu labeling policy.
The policy requiring the use of calorie labeling reduces average weekly spending and alters participants’ food choices (the average total calories per meal). This finding was similar to that of Roseman et al.32 in the southwest United States, who discovered that adding calories to menus had a positive impact on study participants. This finding, however, contradicts the findings of Alassaf et al.32, who discovered that people with a high school degree and frequent fast food customers were less likely to change their eating habits. This can be explained by their lack of knowledge about the average daily calorie intake, the Ministry of Health’s calorie calculator, and the Ministry of Health’s Calories Guide. Understanding what calories are and other background information had no effect on their eating habits. Furthermore, the findings of a 2009 study conducted in the state of Washington revealed no significant change in behavior. 33
The food choices significantly affected, because about 61% of the studied Saudi participants were aware about the SFDA sharp strict measurements from the respective importers and manufacturers about the vitality of complete adherence to the requirements of Saudi Standard Specifications/Gulf Specifications GSO 2233 “requirements of nutritional facts on food products labeling” and GSO 2483” Trans Fats” (Amino Acids) and forced them to write the trans fats in the nutritional facts” and stressed that the nutritional facts table shall to include the amount of Trans fatty acids in food, including nutritional supplements, and shall reflect the content in grams and percentage of the daily value, which should appear in a column on the right side of the label.34
The participants reported no change in body weight following the implementation of a mandatory policy requiring the use of calorie labeling. This could be explained by the fact that weight loss takes time to occur, and this study was conducted soon after the policy was implemented.
Strength; this is a transparent national study, which involved all the 20 regions, of different cultures in the KSA.
Conclusion
FF, and JF consumption was a prevalent problem among different group in the KSA. Their consumptionwas significantly higher in the age group of (10-<20) y, single, employee category, and in people with poor self-health assessment. The majority were unaware of the SFDA policies. The compulsory application of calories labelling policy reduced the average weekly spending by SR, and affected the food choices.
Recommendations
the Saudi community should take this alarming fact seriously to help stop or reverse this trend; comprehensive plan and action that should be implemented includes;
Health education and promotion campaigns increasing the awareness about calorie values and the average caloric intake and about the negative health consequences of frequent FF, and JF consumption, according to the American Heart Association (AHA), FF is good for the heart with a little planning and the willpower to see . The AHA recommends skipping “value” meals as well as the extras, such as, double meat,, French fries, and bacon, improving the nutritional value of a FF meal by requesting a whole wheat grain bun and holding back the mayonnaise and sauces.
Plans with integrated efforts at all levels stakeholders, parents, teachers in all civil society organizations e.g., limiting advertising, availability,….
Supportive environment through providing healthy and accessible alternatives to make a healthy food choice. 4) A critical need for the development of community-based effective interventions to change the attitudes and the behaviors,
Frequent screening in order to early detection,
Obesity Control Programs and people should be given priority for effective management.
Acknowledgment
We would like to thank all participants involved in the study, the support provided by the General Directorate of Clinical Health Education, Ministry of Health (MOH), Saudi Arabia.
Conflict of interest
This study has no conflict of interest to be declared by any author.
Funding Sources
There is no funding sources.
References
- Benajiba N. Fast food intake among saudi population:Alarming fact. Am J Food Nutr. 2016;6(2):44-48. doi:10.5251/ajfn.2016.6.2.44.48
- Saudi Ministry of Health. Food Calorie Calculator for Weight Loss. Published 2018. https://www.moh.gov.sa/en/HealthAwareness/EducationalContent/Food-and-Nutrition/Pages/Food-Calorie-Calculator.aspx
- World Health Organization. Noncommunicable diseases: Mortality. Published 2020. https://www.who.int/data/gho/data /themes/topics/topic-details/GHO/ncd-mortality
- Asiri AM, Alomary SA, Alqahtani SA, Adam IF, Amer SA, Zoccai B. Determinants of the Underlying Causes of Mortality during the First Wave of COVID-19 Pandemic in Saudi Arabia: A Descriptive National Study. Published online 2021. doi:10.3390/ijerph182312647
CrossRef - Wani PH, Sarode N, Technology C. Impact of Fast Food Consumption on Health. Int J Recent Trends Bus Tour. 2018;2(3):79-83.
- Mandoura N, Al-Raddadi R, Abdulrashid O, et al. Factors Associated with Consuming Junk Food among Saudi Adults in Jeddah City. Cureus. 2017;9(12). doi:10.7759/cureus.2008
CrossRef - Jahan I, Karmakar P, Mm H, Jahan N, Mz I. Fast Food Consumption and its Impact on Health. East Med Coll J. 2020;1(November):28-36. https://www.researchgate.net/publication/346220090_Fast_Food_Consumption _and_its_Impact_on_Health
- MCSP. MCSP Nutrition Brief Junk Food Consumption is a Nutrition Problem among Infants and Young Children : Evidence and Program Considerations for Low and Middle Income Countries. Published 2016. https://www.mcsprogram.org/wp-content/uploads/2016/09/MCSP-Nutrition-Brief.pdf
- Naeem Z. Increasing Trend of Junk Food Use in Saudi Arabia and Health Implications. Int J Health Sci (Qassim). 2012;6(1):V-VI. doi:10.12816/0005967
CrossRef - Mohammadifard N, Khaledifar A, Khosravi A, et al. Dietary sodium and potassium intake and their association with blood pressure in a non-hypertensive Iranian adult population: Isfahan salt study. Nutr Diet. 2017;74(3):275-282. doi:10.1111/1747-0080.12304
CrossRef - Merriam-Webster. Fast-food Definition & Meaning – Merriam-Webster. Accessed December 12, 2021. https://www.merriam-webster.com/dictionary/fast-food
- Rosenheck R. Fast food consumption and increased caloric intake: a systematic review of a trajectory towards weight gain and obesity risk. Obes Rev. 2008;9(6):535-547. doi:10.1111/J.1467-789X.2008.00477.X
CrossRef - Poti JM, Duffey KJ, Popkin BM. The association of fast food consumption with poor dietary outcomes and obesity among children: is it the fast food or the remainder of the diet? Am J Clin Nutr. 2014;99(1):162-171. doi:10.3945/AJCN.113.071928
CrossRef - Aldubayan K, Murimi M. Compliance with school nutrition policy in Saudi Arabia: a quantitative study. East Mediterr Health J. 2019;25(4):230-238. doi:10.26719/EMHJ.18.034
CrossRef - Saudi Food and Drug Authority. The Saudi food and drug authority mandates restaurants and cafes to display calorie counts. 2018. Accessed December 12, 2021. https://www.sfda.gov.sa/ar/news/1828
- Saudi Ministry of commerce. The growth of commercial records issued for restaurant activity by 19% during the year 2018. 2018. Accessed December 13, 2021. https://www.mc.gov.sa/ar/mediacenter/News/Pages/03-05-19-01.aspx
- Hossam Al-Esawi SAA. Prevalence of Complications among Saudi Males type 2 diabetic Patients in Riyadh Primary Health Care Centers, 2019. Diabetes Updat. Published online 2021. doi:10.15761/DU.1000158
- General Authority for Statistics. Population by Gender , Age Groups and Nationality (Saudi/Non-Saudi) | General Authority for Statistics. General Authority for Statistics. Published 2018. Accessed December 12, 2021. https://www.stats.gov.sa/en/5680
- Gmi_blogger. Saudi Arabia Social Media Statistics 2021 (Infographics) – GMI Blog. globalmediainsight. Published 2021. Accessed December 12, 2021. https://www.globalmediainsight.com/blog/saudi-arabia-social-media-statistics/
- AlFaris NA, Al-Tamimi JZ, Al-Jobair MO, Al-Shwaiyat NM. Trends of fast food consumption among adolescent and young adult Saudi girls living in Riyadh. Food Nutr Res. 2015;59. doi:10.3402/FNR.V59.26488
CrossRef - Shree V, Prasad RR, Kumar S, Sinha S, Choudhary SK. Study on consumption of fast food among medical students of IGIMS, Patna. Int J Community Med Public Heal. 2018;5(7):2750. doi:10.18203/2394-6040.ijcmph20182416
CrossRef - Washi SA, Ageib MB. Poor diet quality and food habits are related to impaired nutritional status in 13- to 18-year-old adolescents in Jeddah. Nutr Res. 2010;30(8):527-534. doi:10.1016/J.NUTRES.2010.07.002
CrossRef - Naidoo N, van Dam RM, Ng S, et al. Determinants of eating at local and western fast-food venues in an urban Asian population: A mixed methods approach. Int J Behav Nutr Phys Act. 2017;14(1):1-12. doi:10.1186/S12966-017-0515-X/TABLES/3
CrossRef - Ambreen Anjum IJ. Fast food addiction, body esteem psychological wellbieng. Pak Armed Forces Med J. 2020;70(4):1114-1119. https://www.pafmj.org/index.php/PAFMJ/article/view/5104
- Al-Qahtani MH, Al-Qahtani M. Dietary Habits of Saudi Medical Students at University of Dammam. Int J Health Sci (Qassim). 2016;10(3):353. doi:10.12816/0048729
CrossRef - Hijazi N, Abalkhail B, Seaton A. Diet and childhood asthma in a society in transition: A study in urban and rural Saudi Arabia. Thorax. 2000;55(9):775-779. doi:10.1136/thorax.55.9.775
CrossRef - Adams J, Goffe L, Brown T, et al. Frequency and socio-demographic correlates of eating meals out and take-away meals at home: Cross-sectional analysis of the UK national diet and nutrition survey, waves 1-4 (2008-12). Int J Behav Nutr Phys Act. 2015;12(1):1-9. doi:10.1186/S12966-015-0210-8/TABLES/3
CrossRef - Griep RH, Toivanen S, van Diepen C, et al. Work-Family Conflict and Self-Rated Health: the Role of Gender and Educational Level. Baseline Data from the Brazilian Longitudinal Study of Adult Health (ELSA-Brasil). Int J Behav Med. 2016;23(3):372-382. doi:10.1007/S12529-015-9523-X
CrossRef - Anderson B, Rafferty AP, Lyon-Callo S, Fussman C, Imes G. Fast-food consumption and obesity among michigan adults. Prev Chronic Dis. 2011;8(4). Accessed December 12, 2021. /pmc/articles/PMC3136980/
CrossRef - French SA, Harnack L, Jeffery RW. Fast Food Restaurant Use among Women in the Pound of Prevention Study: Dietary, Behavioral and Demographic Correlates. Vol 24.; 2000. www.nature.com/ijo
- Radwan H, Faroukh EM, Obaid RS. Menu labeling implementation in dine-in restaurants: the Public’s knowledge, attitude and practices. Arch Public Heal. 2017;75(1). doi:10.1186/S13690-017-0177-9
CrossRef - Roseman MG, Joung H-W, Choi E-K, Kim H-S. The effects of restaurant nutrition menu labelling on college students’ healthy eating behaviours. Published online 2016. doi:10.1017/S1368980016002871
CrossRef - Finkelstein EA, Strombotne KL, Chan NL, Krieger J. Mandatory menu labeling in one fast-food chain in king county, Washington. Am J Prev Med. 2011;40(2):122-127. doi:10.1016/j.amepre.2010.10.019
CrossRef - Saudi Food and Drug Authority. Applied Strict Measures to Reduce Consumption of “Trans Fats” in Food Products to Eliminate their complications n Health | Saudi Food and Drug Authority. 2016. Accessed December 12, 2021. https://www.sfda.gov.sa/en/news/1660
Accepted on: 19 Jan 2022
Second Review by: Debasis Mitra India
Final Approval by: Prof. Jiwan S. Sidhu


Web of Science Coverage
Emerging Sources Citation Index (ESCI)
2024 Journal Impact Factor: 1.1
Scopus Journal Metrics
CiteScore 2025: 2.6
CiteScore Details
Sustainable Nutrition: Food Systems, Nutrient Retention, and Public Health Impact
![]()
This journal is a member of, and subscribes to the principles of, the Committee on Publication Ethics (COPE)


