
Characterization of Different Cultivars of Oat (Avena sativa L.) for Development of Oat-incorporated Cookies
 , , 2*, Jumken Lendo2, Priyanka Thakur3, Sumaira Jan1, Qurat Ul Eain Hyder Rizvi1, Aastha Dewan4 and Shiv Kumar5
 1Department of Food Technology, Dr Khem Singh Gill Akal College of Agriculture, Eternal University, Sirmour, India.
2Department of Food Technology, Rajiv Gandhi University, Doimukh, India
3Department of Food Technology, College of Horticulture and Forestry, Hamirpur, India.
4Department of Food Technology, Guru Jambheshwar University of Science and Technology, Hisar, India.
5MMICT and BM (Hotel Management), Maharishi Markandeshwar deemed to be University, Mullana, India.
Corresponding Auhor E-mail:krishan.kumar@rgu.ac.in
DOI : http://dx.doi.org/10.12944/CRNFSJ.14.2.10
Download this article as:

Five oat cultivars – Kent, OS-6, PLP-1, OL-125 and OL-9 were evaluated for their nutritional composition and further investigated how incorporating the most nutrient-rich cultivar into cookies influenced their nutritional quality. The study was conducted to provide comparative data on the nutritional variability among oat cultivars and their suitability for bakery product development. All cultivars contained substantial levels of proteins (10.70%–15.46%), crude fibre (3.62%–6.16%), crude fat (4.42%–6.13%), ash (1.08%–2.05%), and minerals including copper (3.40–5.47 mg/kg), manganese (25.28–34.08 mg/kg), iron (27.56–56.23 mg/kg), and zinc (25.07–36.47 mg/kg). The Kent cultivar showed relatively high nutrient levels for protein (15.46%), fiber (6.16%), Fe (56.23 mg/kg), and TPC (27.36 mg GAE/100 g). Based on its relatively favourable nutritional and bioactive profiles, Kent was preferred for preparing oat-incorporated cookies. To examine its functional properties in baked products, wheat flour was moderately replaced with Kent oat flour at 0, 25, 50, 75, and 100%. As the fraction of oat flour increased, cookies showed significant increases in protein, fiber, and ash contents (p ≤ 0.05). In addition, oat incorporation affected the crude fat content and calorific value of the developed cookies, adding to their overall nutritional quality. Although sensory ratings gradually declined as substitution levels increased, formulations containing up to 75% oat flour remained acceptable to panellists. All experimental data were statistically scrutinised using one-way ANOVA followed by the LSD test at p ≤ 0.05, while sensory acceptance was judged using a 9-point hedonic scale, and cookies with mean sensory scores ≥7.0 were considered moderately desirable. The 75% substitution level was considered the most suitable formulation based on the amalgamated assessment of nutritional enhancement and sensory acceptability. Overall, the findings established that the Kent cultivar possessed favourable nutritional attributes and could be incorporated into cookies at levels up to 75% while maintaining acceptable sensory quality.
KEYWORDS:Cookies; Nutritional characteristics; Oat cultivars; Organoleptic properties; Supplementation
Introduction
Since the 19th century, Avena sativa, or oat, has evolved from a crop mainly used for animal feed to a familiar human staple food.1 Oats are loaded with high-quality protein, vitamins, minerals, β-glucan, unsaturated fatty acids, and phenolic compounds such as avenanthramides, which contribute to their nutritional and functional properties. These attributes underpin the growing use of oats in functional and health-oriented food products, including breakfast cereals, baby foods, and fortified flakes, as well as their role in managing various diet-related conditions.2,3
Oats have been linked to a number of health advantages, such as lowering cholesterol, improved glycaemic control, and protection against oxidative stress-related disorders. In particular, β-glucan has received considerable attention for its documented cholesterol-lowering and antidiabetic effects, resulting in approved health claims for oat products in several countries.4,5 The first food-specific health claim for oat products was approved by the U.S. Food and Drug Administration (FDA) in 1997. It said that consuming at least 3 g of β-glucan soluble fibre per day may lower the risk of coronary heart disease.6
Since cookies are so widely consumed and accepted in developing nations, they provide a useful means of nutritional enhancement.7 Several studies have reported the use of oats in bakery formulations; however, most investigations have focused either on general oat utilisation or on limited product optimisation studies without a detailed comparative evaluation of oat cultivars.
The incorporation of oat flour influences both the nutritional composition and technological properties of bakery products. β-Glucan and dietary fibre increase water absorption and dough viscosity, thereby affecting cookie spread, texture, and moisture retention, while oat proteins and lipids contribute to dough structure, flavour, and mouthfeel.8,9,10 Furthermore, oat incorporation influences dough rheology and biscuit-making performance and may enhance dietary fibre, protein content, and antioxidant potential of cookies.11,12
Even though the nutritional value of oats is widely acknowledged, little is known about the functional and nutritional differences among various oat cultivars and whether they are suitable for use in value-added baked goods. Specifically, there is still insufficient research on how increasing oat flour substitution affects cookies’ nutritional value and sensory appeal. Over 500 oat cultivars have been registered worldwide, and many more have been produced and released.13 Cultivar selection for food production, however, necessitates a methodical, evidence-based approach. Recent studies have demonstrated substantial variation among oat varieties in their nutritional, phytochemical, and technological characteristics, which can influence their suitability for bakery applications.11 Five major oat cultivars cultivated at the university experimental farms were selected for evaluation based on their regional importance and previously reported differences in β-glucan content, protein quality, lipid profile, antioxidant capacity, and technological performance, all of which are known to influence the nutritional and functional quality of oat-based.5,8,11 Therefore, a systematic comparison of five major oat cultivars (Kent, OS-6, PLP-1, OL-125, and OL-9) cultivated on the university experimental farms was undertaken to identify the most suitable cultivar for functional bakery applications.
Accordingly, cookie development focused on enhancing the nutritional composition of a widely consumed bakery product by incorporating oat flour, particularly to increase dietary fibre, β-glucan, protein, minerals, and phenolic compounds. Oat flour substitution levels were systematically varied to evaluate their effect on the nutritional, physical, and sensory characteristics of cookies.
Thus, the present study aimed to characterize and compare five regionally important oat cultivars based on their physicochemical, nutritional, and bioactive properties to identify a cultivar with superior functional potential and subsequently evaluate its incorporation into cookies at different substitution levels to assess nutritional composition, physical characteristics, and sensory acceptability. The results of the current investigation will provide a scientific basis for oat cultivar selection and the development of nutritionally enhanced bakery products.
Materials and Methods
The five oat (Avena sativa L.) cultivars, namely Kent, OS-6, PLP-1, OL-125, and OL-9, were obtained from the Genetics and Plant Breeding Department at Punjab Agricultural University, Ludhiana, India. and subsequently multiplied at the experimental farms of Eternal University, The five oat (Avena sativa L.) cultivars, namely Kent, OS-6, PLP-1, OL-125, and OL-9, were obtained from the Genetics and Plant Breeding Department at Punjab Agricultural University, Ludhiana, India. and subsequently multiplied at the experimental farms of Eternal University, Baru Sahib, ensuring varietal purity and reliability of experimental observations. The oat samples were harvested at full physiological maturity under recommended agronomic practices followed at the experimental farms to minimise variability associated with cultivation conditions. After harvesting, grains were hand-cleaned to remove impurities and damaged kernels before further processing. The experimental design involved initial screening and comparative description of oat cultivars, followed by selection of the nutritionally enhanced oat cultivar for incorporation into cookie formulations at varying substitution levels. This sequential approach was adopted to improve the robustness and scientific relevance of the study. Among the estimated cultivars, Kent was preferred for cookie-preparation studies due to its superior nutritional and bioactive profiles, including higher protein, fibre, total phenolic content, and iron. The wheat flour used to make control cookies was ground in a flour mill (SANCO).
Physical measurements were performed with a digital Vernier calliper and an electronic weighing balance (Shimadzu, Japan), and chemical measurements were carried out by using standard laboratory glassware and analytical equipment available in the Department. All the flour samples were packaged in clean, food-grade polypropylene packages and stored in a sealed container under ambient laboratory conditions until analysis. Analytical determinations were conducted within one week after milling to minimise possible changes in nutritional and functional properties. Equipment used for chemical and physical analyses was calibrated in accordance with standard laboratory procedures to ensure the accuracy and reproducibility of experimental observations.
Analysis of physical, chemical, and organoleptic properties
The different oat cultivars were analysed for physical and optical characteristics, i.e., thousand-grain weight (TGW), length, thickness, width, WAC, bulk and tap density, WSI, and optical characteristics (L, a, and b values). The chemical characteristics analysed include moisture, ash, crude fibre, fat, protein, minerals (Fe, Zn, Cu, Mn), phytic acid, β-glucan, and total phenolic content (TPC). The Atwater values of 4.0, 9.10, and 4.2 kcal/g of crude protein (N × 6.25), lipids, and carbohydrates were used to calculate the calorific value.14 These parameters were selected to comprehensively evaluate the nutritional, functional, and technological suitability of oat cultivars for the development of nutritionally improved cookies. The experiments conducted in the present study employed ultrapure-grade chemicals from reliable vendors, such as Sigma, BDH Chemicals, Qualigens, Merck India, and Hi-Media. The moisture content was estimated using the AOAC15 specified air-oven drying method. The concentrations of ash, crude fibre, crude fat, and crude protein were calculated using the method described by Ranganna.16 The mineral compositions were estimated using an Atomic Absorption Spectrometer (Agilent Technology, CA, USA; AA240FS). (15) The phytic acid analysis was conducted using the Vaintraub and Lapteva’s modified colorimetric approach.17
The Folin-Ciocalteu colorimetric approach18 was employed for the determination of TPC of oat using Ainsworth and Gillespie’s method. The calibration curve was created using gallic acid as a reference standard. Next, 0.5 mL of the plant extract (100 µg/mL) and 2 mL of the Folin-Ciocalteu reagent (diluted 1:10 with deionised water) were combined, and the mixture was neutralised with 4 mL of a 7.5% (w/v) sodium carbonate solution. To develop colour, the reaction mixture was periodically shaken during incubation at room temperature for 30 minutes. Using a microprocessor-based visible spectrophotometer (711-SNV), the absorbance of the generated blue colour was measured at 765 nm. The linear equation of the standard curve made using gallic acid was used to calculate the total phenolic contents, which were then represented as milligrams of gallic acid equivalents (mg GAE) per 100 grams of sample. Thousand-grain weight was determined by randomly selecting and counting 1,000 intact oat grains from each cultivar. The grains were weighed, and the results were expressed in grams. This parameter was used to assess grain size, uniformity, and physical quality of oat cultivars.
Bulk density (BD) of oat grains was estimated following the procedure explained by Narain et al.19 A known-volume container was filled with grains without applying external force. The grains were levelled without compacting, and the mass of grains occupying the given volume was recorded. The BD was measured as the mass-to-volume ratio and reported in g/mL. Tap density was determined using the procedure outlined by Jones et al.20 The 10 g of oat grains were placed into a 250 mL graduated measuring cylinder, and the initial volume was recorded. The cylinder was then tapped manually at a uniform rate until no further change in volume was observed. The final volume was noted, and tap density was calculated as the mass of the sample divided by the tapped volume, expressed in g/mL
The centrifugal method of Sosulski21 was used to calculate the WAC of different oat cultivars. Flour’s sedimentation value was calculated using the method described by Misra et al.22 The β-glucan was extracted from different oat cultivars according to the method of Ahmad et al.23 A Hunter Lab chromameter (Konica Minolta Inc., Model No. CR-400, Japan) was used for determining the colour of the oat grains in the form of L, a, and b values.
Dry gluten content was estimated according to the standard methods described by the AACC.24 Dough was prepared from the flour samples, and gluten was separated by washing out starch and soluble components under controlled conditions. The dry gluten content was calculated as a percentage of flour weight after the wet gluten was dried at 105°C until a consistent weight was attained.
The physical characteristics of the cookies, such as diameter, thickness, spread ratio, and weight, were determined as per the following protocols. The spread ratio of oat-incorporated cookies was determined by measuring cookie diameter and thickness after baking and cooling to room temperature.25 Diameter was measured by placing six cookies edge-to-edge and averaging the measurements, while thickness was measured by stacking the cookies vertically. The average diameter divided by the average thickness (D/T) yielded the spread ratio. The spread ratio measures the expansion of cookies during baking, with lower values indicating more structurally sound cookies and higher values representing increased cookie expansion. After baking and cooling at room temperature, the weight of the prepared cookies containing oats was estimated using a calibrated digital analytical balance. Six cookies were randomly selected from each treatment, weighed individually, and the average weight was recorded in grams (g).
All analytical determinations were performed using standardised procedures and calibrated instruments to improve the accuracy, reliability, and reproducibility of the experimental results.
Sensory Evaluation
The sensory assessment was conducted in a controlled setting to minimise external influences on panellists’ perceptions. The space was kept at a normal temperature, quiet, well-lit, and odour-free. To ensure accurate and consistent responses, 15 semi-trained panellists aged 18 to 45 years, familiar with cookie products and sensory assessment techniques, were selected. The panellists had prior exposure to sensory evaluation activities conducted in the Department of Food Technology and were therefore considered semi-trained. A panel size of 10–20 semi-trained assessors is commonly considered adequate for laboratory-based sensory evaluation studies.26,27
Colour, aroma, appearance, taste, texture, and overall acceptability were assessed using a 9-point hedonic scale (1 being “disliked extremely,” 5 being “neither liked nor disliked,” and 9 being “liked extremely”). Overall acceptability was assessed by asking panellists to provide an overall impression score for each sample after evaluating all individual sensory attributes using the same 9-point hedonic scale. Samples were coded with three-digit random numbers and served in a randomised order to minimise order and carryover effects. To avoid flavor carry-over, panelists rinsed their mouths with water between samples. All cookies were made under the same conditions and presented at room temperature. Samples with a mean score of at least 7.0 were considered acceptable. Each attribute was rated separately, and mean scores were computed. Appropriate statistical analysis was performed on the data to identify significant differences among treatments.28 Participation in the sensory evaluation was voluntary, and informed consent was obtained from all panellists. Additional ethical considerations are provided in the Ethics Statement section.
Preparation of oat-incorporated cookies
The baking ingredients, such as commercially milled wheat flour, granulated sugar, food-grade sodium chloride, and hydrogenated vegetable oil, were all purchased from the local market. The oat flour-incorporated cookies (OIC) were manufactured by blending OF with WF at proportions of 25, 50, 75, and 100%. This resulted in five formulations: a control (100% wheat flour), OIC1 (75% WF + 25% OF), OIC2 (50% WF + 50% OF), OIC3 (25% WF + 75% OF), and OIC4 (100% OF).
The formulation and processing conditions for cookies were standardized through a series of preliminary laboratory trials to achieve desirable dough-handling properties, baking performance, texture, and sensory acceptability. These substitution levels were selected to evaluate the progressive effect of oat flour incorporation on the nutritional, physical, and sensory characteristics of cookies. To guarantee even dough development and fat dispersion, cookies were prepared using the traditional creaming method. The formulation and processing conditions were optimized to ensure satisfactory texture and product quality. The cookie preparation procedure was carried out under hygienic laboratory conditions following standard food safety and sanitation practices to ensure product quality and reproducibility. The base cookie was formulated to achieve satisfactory handling properties, texture, and sensory properties of the dough. The formulation consisted of 100 g of wheat flour or wheat-oat flour blends, 35 g of hydrogenated vegetable oil, 35 g of powdered sugar, 1 g of glucose, 1 g of skim milk powder, 1 g of ammonium bicarbonate and sodium bicarbonate, 0.05 g of vanillin, and 15–18 mL of water. A control batch was also prepared using 100% wheat flour with the same ingredient proportions. Finely crushed sugar and a mixture of vanillin and hydrogenated vegetable oil were thoroughly mixed for 2-3 minutes to make a homogeneous mixture. The dry ingredients, such as wheat flour, oat flour, skim milk powder, glucose, sodium chloride, ammonium bicarbonate, and sodium bicarbonate, were mixed separately before preparing the dough to ensure even distribution of ingredients in the dough matrix. This mixture was mixed with wheat flour, skim milk powder, glucose, salt, leavening agents, and oat flour to produce a homogeneous dough before shaping and baking.
The prepared dough was then rolled out on an aluminium plate with a wooden rolling pin to get a uniform thickness of 2.5 mm. The circular pieces of the sheet were cut with a 48 mm diameter round cutter, and the cookie pieces were uniformly placed on the baking trays (with a maximum capacity of 40 pieces per baking run). The fat was brushed lightly onto the baking tray to prevent the cookie pieces from sticking together. To minimize variability among cookie treatments and repeatability of results, the same baking procedure was employed for all cookies. The tray was then moved to a baking oven (SANCO) and was baked at 205°C for 7-8 min. The cookies were removed from the oven after baking and allowed to cool to room temperature. Once baked and cooled, each cookie was weighed individually on a digital analytical balance, and the mean value was reported under the Physical characteristics of cookies. After which cookies were stored in polypropylene pouches (100-gauge) to avoid moisture penetration and loss of crispness during storage. These were then kept at ambient temperature (18-30°C) in an airtight container (Figure 1).
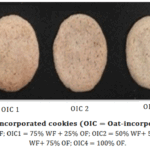 |
Figure 1: Oat incorporated cookies (OIC = Oat-incorporated cookies; |
Statistical analysis
Each experiment was repeated 3 times, and for the sensory evaluation, 15 panellists were involved. One-way analysis of variance (ANOVA) was used to analyse data on proximate composition, mineral content, functional properties, physical properties of cooking, and sensory evaluation scores in IBM SPSS Statistics version 16.0. Multiple comparisons were made with the Least Significant Difference (LSD) post hoc when significant differences were found among means. The results were interpreted as being statistically significant when p was ≤ 0.05. The corresponding p-values were used to provide a clearer statistical interpretation for making a direct comparison between wheat flour and Kent cultivar data. Principal component analysis (PCA) was performed on all measured variables using Minitab 16. Minitab was selected for PCA due to its suitability for multivariate statistical analysis and effective graphical visualisation of component loading patterns and sample distribution.
Results
Physical and colour parameters of different cultivars of oat
Data about the physical parameters of different cultivars of oats are presented in Table 1. The data shows that the thousand-grain weight varied from 26.77g to 31.80g. Values were lowest for cultivar PLP-1 (26.77g) and highest for Kent (31.80g). The bulk and tap densities of the different cultivars ranged from 1.17 to 1.45 g/mL and 1.48 to 1.93 g/mL, respectively. Values for bulk density were lowest for cultivar OL-9 (1.17 g/mL) and highest for Kent (1.45 g/mL).
Table 1: Physical and optical characteristics of different cultivars of oat
|
Parameters |
Kent | OS-6 | PLP-1 | OL-125 |
OL-9 |
|
1000 Grain Weight (g) |
31.80±0.04 a | 30.06±0.07b | 26.77±0.02c | 30.00±0.08 b | 29.23±0.05 b |
| Length (mm) | 13.17±0.76 b | 11.83±0.29c | 10.83±0.29 d | 12.33±0.29 bc |
14.17±0.76 a |
|
Thickness (mm) |
2.42±0.09 b | 2.50±0.17b | 3.07±0.38a | 2.79±0.26 ab | 2.67±0.29 ab |
| Width (mm) | 3.50±0.10 a | 2.83±0.76a | 3.33±0.29a | 3.00±0.50 a |
3.50±0.00 a |
|
BD (g/mL) |
1.45±0.09a | 1.18±0.03b | 1.30±0.05a | 1.22±0.08 b | 1.17±0.08 b |
| TD (g/mL) | 1.92±0.10a | 1.82±0.3ab | 1.75±0.05 b | 1.48±0.03 c |
1.93±0.11 a |
|
L value |
55.92±0.61b | 59.37±0.40a | 53.57±0.62c | 47.05±0.13 d | 39.10±0.28 e |
| a value | 6.37±0.38b | 6.16±0.20b | 1.11±0.24c | 6.43±0.29 b |
8.63±0.37 a |
|
b value |
39.14±0.26b | 33.63±0.49e | 37.07±0.15c | 39.99±0.25a | 35.09±0.22c |
| WAC (mL/g) | 3.20±0.10c | 3.81±0.11a | 3.66±0.04 b | 3.28±0.01 c |
3.86±0.09 a |
|
WSI (%) |
5.35±0.11b | 5.85±0.12a | 4.50±0.15 c | 4.61±0.10 c |
5.41±0.10 b |
The data are presented as mean ± standard deviation (SD). Mean values within the same row followed by identical superscript letters do not differ significantly according to Duncan’s least significant difference (LSD) post hoc test at p≤0.05. Abbreviations: BD, Bulk density; TD, Tap density; WAC, Water Absorption Capacity; WSI, Water Solubility Index.
Similarly, tap density values were lowest for cultivar OL-125 (1.48 g/mL) and highest for OL-9 (1.93 g/mL). Grain length varied from 14.17 mm for OL-9 to 10.83 mm for PLP-1; width ranged from 2.83 mm for OS-6 to 3.50 mm for Kent and OL-9; and thickness from 2.42 mm for Kent to 3.07 mm for PLP-1.
Water Absorption Capacity (WAC) of different cultivars of oats ranged from 3.20 (Kent) to 3.86 mL/g (OL-9). The values for the Water Solubility Index (WSI) ranged from 4.50 (PLP-1) to 5.85% (OS-6). The Colour parameters, measured as L, a, and b values, are presented in Table 1. Values for ‘L’ ranged from 39.10 for OL-9 to 59.37 for OS-6, for ‘a’ ranged from 1.11 for PLP-1 to 8.63 for OL-9, and values for ‘b’ ranged from 33.63 for OS-6 to 39.99 for OL-125.
Chemical composition of different cultivars of oat
The chemical composition of five cultivars of oats is presented in Table 2. The moisture content of five varieties ranged from 10.24% (OL-9) to 10.75% (OL-125). Crude fat contents ranged from 4.42 (Kent) to 6.13% (OL-9). Oat contained a high level of crude fibre content, and the values ranged from 3.62 (PLP-1) to 6.16% (Kent).
Table 2: Chemical composition of flour obtained from different oat cultivars
|
Parameters |
Kent | OS-6 | PLP-1 | OL-125 |
OL-9 |
|
Moisture (%) |
10.52±1.20 a | 10.26±1.06 a | 10.67±1.15 a | 10.75±0.84a | 10.24±0.99 a |
| Protein (%) | 15.46 ±0.31a | 15.19±0.44 a | 12.16±0.44b | 10.70±0.18c |
13.19 ±1.11 b |
|
Ash (%) |
1.93±0.05 a | 1.74±0.06 b | 1.08±0.03c | 2.05±0.03a | 1.67±0.19 b |
| Crude Fat (%) | 4.42±0.51c | 4.50±0.17 c | 4.94±0.19bc | 5.32±0.58b |
6.13±0.32 a |
|
Crude fibre (%) |
6.16±0.23a | 3.67±0.11 d | 3.62±0.23d | 4.47±0.15c | 4.99±0.12 b |
| Carbohydrates (%) | 61.50±0.91c | 64.62±1.59 ab | 67.53±1.34a | 66.72±0.27a |
63.77±2.58 bc |
|
Calorific value (kcal/100g) |
360.36±7.39b | 373.20±4.39 a | 377.16±6.54a | 371.44±5.98 a | 376.43±4.71a |
| Iron (mg/kg) | 56.23±3.75 a | 27.56±1.20 d | 30.04±3.04 cd | 47.51±0.49 b |
34.52±2.32 c |
|
Zinc (mg/kg) |
31.58±0.20 b | 31.67±1.54 b | 27.62±1.40 c | 25.07±0.08 d | 36.47±1.07 a |
| Copper (mg/kg) | 4.98±0.56 ab | 3.99±0.39 cd | 5.47±0.49 a | 4.27±0.20 bc |
3.40±0.13 d |
|
Manganese (mg/kg) |
34.08±0.66 a | 30.97±0.27 b | 25.28±0.98 c | 29.89±1.14 b | 26.91±1.64 c |
| Phytic acid (%) | 0.24±0.03b | 0.27±0.02b | 0.27±0.05b | 0.43±0.03a |
0.46±0.03a |
|
β-glucan (g/100g) |
3.45±0.27b | 2.47±0.22c | 5.08±0.09a | 2.71±0.15c | 3.68±0.15b |
| TPC (mg GAE/100g) | 27.36±1.01a | 18.17±1.05d | 22.68±0.93c | 23.47±0.60 c |
25.42±0.70 b |
The data are presented as mean ± standard deviation (SD). Mean values within the same row followed by identical superscript letters do not differ significantly according to Duncan’s least significant difference (LSD) post hoc test at p≤0.05. TPC-Total Phenolic Contents
Similarly, the crude protein contents ranged from 10.70% (OL-125) to 15.46% (Kent). The ash contents in oat cultivars varied from 1.08% in PLP-1 to 2.05% in OL-125. The carbohydrate value ranged from 61.50% (Kent) to 67.53% (PLP-1).
Data on the mineral content of different cultivars are shown in Table 2. The data show that the Cu content varied from 3.40 mg/kg (OL-9) to 5.47 mg/kg (PLP-1). The Mn content ranged between 25.28 mg/kg (PLP-1) and 34.08 mg/kg (Kent), and the Fe content varied from 27.56 mg/kg (OS-6) to 56.23 mg/kg (Kent) in oat cultivars. Whereas Zn content varied from 25.07 (OL-125) to 36.47 mg/kg (OL-9) in different cultivars. The level of anti-nutritional component, i.e., phytic acid, ranged from 0.24% (Kent) to 0.46% (OL-9) in oat cultivars. β-glucan, which is a major component of oat grains, ranged between 2.47 (OS-6) to 5.08 g/100g (PLP-1). Values for total phenolic contents (TPC) ranged from 18.17 for OS-6 to 27.36 mg GAE/100g for Kent.
The oat cultivars were screened for their nutritional and bioactive components. The cultivar Kent was found to have the highest contents of protein (15.46%), crude fibre (6.16%), iron (56.23 mg/kg), and total phenolic content (27.36 mg GAE/100g), and lower contents of phytic acid (0.24%), carbohydrates (61.5%), and calorific value (360.36 Kcal/100g).
Principal Component Analysis
Principal component analysis (PCA) was used to identify the major variables contributing to variation among oat cultivars. Based on the Kaiser criterion (eigenvalue > 1), the first two principal components (PC1 and PC2) were retained for interpretation. The variance proportions explained by these components are presented in Table 3, with the corresponding values indicated on the PCA axes in Figure 2.
PC1 was primarily associated with crude protein, crude fibre, crude fat, zinc, 1000-grain weight, water solubility index (WSI), and ash content, indicating that these variables contributed most strongly to cultivar differentiation. PC2 was mainly influenced by water absorption capacity (WAC), moisture content, iron content, and colour parameters. Thus, the majority of the nutritional and functional characteristics contributed substantially to the separation of cultivars.
The direction and magnitude of the vectors in the biplot indicate the relative contribution of each variable to the principal components. Variables located in the same direction were positively associated, whereas variables positioned in opposite directions showed negative associations. Variables represented by longer vectors had a greater influence on cultivar discrimination.
The PCA biplot revealed clear separation among cultivars based on their compositional and functional characteristics. Cultivars positioned in the positive region of PC1 were associated with favourable nutritional and functional attributes, whereas those located in the opposite direction were associated with comparatively lower values of these characteristics. Distinct clustering patterns among cultivars further demonstrated the variability present in their physicochemical, nutritional, and functional properties.
Table 3: Principal Component Analysis and Variable Loadings of the First Four Principal Components
|
Factor Number |
1 | 2 | 3 |
4 |
|
Initial Eigen values |
8.339 | 6.309 | 0.000 | 0.000 |
| Variance proportion | 0.379 | 0.287 | 0.191 |
0.143 |
|
Cumulative proportion |
0.379 | 0.666 | 0.857 | 1.000 |
|
Factor Loadings |
||||
| Moisture (%) | -0.209 | -0.310 | 0.068 |
-0.050 |
|
Protein (%) |
0.241 | 0.057 | -0.309 | 0.172 |
| Ash (%) | 0.223 | -0.132 | 0.051 |
-0.385 |
|
Crude Fat (%) |
-0.010 | 0.165 | 0.443 | -0.024 |
| Crude fibre (%) | 0.269 | -0.207 | 0.136 |
0.122 |
|
Carbohydrates (%) |
-0.333 | 0.045 | 0.057 | -0.127 |
| 1000 Grain Weight (g) | 0.295 | -0.146 | -0.078 |
-0.192 |
|
Length (mm) |
0.284 | 0.041 | 0.275 | -0.001 |
| Thickness (mm) | -0.320 | 0.007 | 0.160 |
0.113 |
|
Width (mm) |
0.103 | -0.082 | 0.236 | 0.449 |
| Bulk density (g/mL) | 0.019 | -0.301 | -0.135 |
0.333 |
|
Tap density (g/mL) |
0.214 | 0.141 | 0.333 | 0.386 |
| Iron (mg/kg) | 0.159 | -0.342 | 0.101 |
-0.050 |
|
Zinc (mg/kg) |
0.241 | 0.236 | 0.062 | 0.216 |
| Copper (mg/kg) | -0.166 | -0.255 | -0.179 |
0.268 |
|
Manganese (mg/kg) |
0.239 | -0.197 | -0.214 | -0.165 |
| L value | -0.025 | -0.092 | -0.473 |
0.019 |
|
a value |
0.279 | 0.086 | 0.177 | -0.233 |
| b value | -0.036 | -0.374 | 0.150 |
-0.062 |
|
Water absorption capacity (WAC) (mL/g) |
-0.046 | 0.388 | -0.012 | 0.103 |
| Water solubility index (WSI) (%) | 0.262 | 0.200 | -0.202 |
-0.041 |
|
Total Phenolic Contents (mg GAE/100g) |
0.142 | -0.219 | 0.286 |
0.242 |
Variance proportion indicates the fraction of total variance explained by each principal component, whereas cumulative proportion represents the cumulative variance explained by successive components. Principal components with eigenvalues greater than 1 (PC1 and PC2) were retained for interpretation according to the Kaiser criterion.
Among the cultivars, Kent was closely associated with protein, fibre, fat, iron, zinc, WSI, and functional properties, supporting its selection for cookie development. The PCA also highlighted differences among cultivars and confirmed that compositional and functional attributes effectively differentiated oat cultivars. Overall, PCA provided a simplified visual representation of relationships among variables and cultivars, facilitating the identification of nutritionally desirable cultivars for product development.
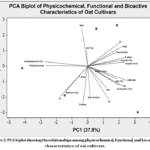 |
Figure 2: PCA biplot showing the relationships among physicochemical, functional, and bioactive characteristics of oat cultivars. |
Analysis of properties of wheat and oat flour and oat-based cookies
Table 4 shows the physicochemical characteristics of wheat flour (WF) and Kent oat flour (OF). Moisture levels were 11.33% for WF and 10.52% for OF, while ash content measured 0.97% and 1.93%, respectively. OF contained significantly higher crude fat (4.42%) than WF (1.37%), and its crude fiber content (6.16%) was also significantly higher compared with WF (1.98%). Similarly, crude protein was found significantly higher in OF (15.46%) than in WF (9.30%). Conversely, carbohydrate content was higher in WF (75.05%) than in OF (61.50%). Water absorption capacity (WAC) was lower in WF (1.37 mL/g) and higher in OF (3.20 mL/g), likely due to the greater fibre content in oat flour. Majzoobi et al.22 reported that oat flour exhibits higher water absorption capacity and improved dough-softening properties compared to wheat flour due to its higher β-glucan and dietary fibre contents.
Figure 3 illustrates the physical attributes of these cookies, including diameter, weight, thickness, and spread ratio. The weight of the oat-enriched cookies ranged from 7.18 g in OIC4 to 8.33 g in the control sample. A significant decrease (p ≤ 0.05) in cookie weight was observed with increasing oat flour incorporation levels. The spread ratio of OIC4 (8.61) was lower than that of the control cookies (9.89), and the reduction in spread ratio at higher oat substitution levels was also found to be statistically significant (p ≤ 0.05).
Table 4: Physicochemical Composition of Oat (Kent) and Wheat Flours Used for Cookie Preparation
|
Parameters |
Wheat flour
(Soft wheat) |
Oat (KENT) Flour |
|
Moisture (%) |
11.33±0.23 | 10.52±1.20 |
| Crude Protein (%) | 9.30±0.18 |
15.46 ±0.31 |
|
Crude Fat (%) |
1.37±0.15 | 4.42±0.51 |
| Crude fibre (%) | 1.98±0.11 |
6.16±0.23 |
|
Ash (%) |
0.97±0.14 | 1.93±0.05 |
| Carbohydrates (%) | 75.05±0.18 |
61.51±0.91 |
|
Dry gluten (%) |
7.87±0.25 | NIL |
| SDS sedimentation value | 22.00±0.70 |
28.33±0.58 |
|
WAC (mL/g) |
1.37±0.12 |
3.20±0.10 |
Values are presented as mean ± SD. Differences between wheat flour and Kent oat flour were analysed using an independent samples t-test at p ≤ 0.05. WAC-Water Absorption Capacity.
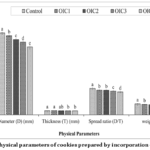 |
Figure 3: Physical parameters of cookies prepared by incorporation of oat flour |
The data are presented as mean ± SD. Bars with different lowercase letters (a–e) within the same physical parameter differ significantly according to Duncan’s least significant difference (LSD) post hoc test at p≤0.05. OIC = Oat-incorporated cookies; Control = 100% WF; OIC1 = 75% WF + 25% OF; OIC2 = 50% WF+ 50% OF; OIC3 = 25% WF+ 75% OF; OIC4 = 100% OF.
The chemical composition of cookies prepared with different levels of oat flour incorporation is presented in Table 5. Moisture content ranged from 1.97% to 3.54% and increased significantly (p ≤ 0.05) with increasing oat flour substitution. Similarly, crude protein, crude fibre, crude fat, and ash contents increased progressively with increasing oat flour incorporation. The crude fibre content was significantly higher in oat-incorporated cookies than in the control, increasing from 2.41% in the control to 3.68% in OIC4. This increase may be attributed to the higher fibre and ash contents of oat flour compared with wheat flour. Likewise, crude fat content increased significantly (p ≤ 0.05) from 18.48% in the control to 23.63% in OIC4 due to the naturally higher lipid content of oat flour.
Crude protein content also increased significantly (p ≤ 0.05) with increasing oat flour incorporation, ranging from 9.38% in the control cookies to 13.63% in OIC4. The observed increase is consistent with the higher protein content of Kent oat flour (15.46%) compared with wheat flour (9.30%) (Table 4). In contrast, carbohydrate content decreased significantly from 67.70% in the control to 53.72% in OIC4 as the proportion of oat flour increased.
Table 5: The chemical composition of cookies prepared by the incorporation of oat flour
| Parameters | Control | OIC1 | OIC2 | OIC3 | OIC4 |
| Moisture (%) | 1.97±0.09d | 2.53±0.05c | 3.05±0.13b | 3.54±0.08a | 3.54±0.16a |
| Crude fat (%) | 18.48±0.16e | 19.09±0.18d | 21.11±0.22c | 22.64±0.10b | 23.63±0.12a |
| Crude fibre (%) | 2.41±0.10d | 2.67±0.07c | 3.32±0.15b | 3.51±0.09ab | 3.68±0.16a |
| Crude protein (%) | 9.38±0.16e | 10.23±0.08d | 11.35±0.12c | 12.30±0.15b | 13.63±0.28a |
| Ash (%) | 1.06±0.04d | 1.23±0.07c | 1.47±0.05b | 1.65±0.12a | 1.80±0.13a |
| Carbohydrates (%) | 67.70±0.36e | 64.25±0.18d | 59.69±0.37c | 56.36±0.37b | 53.72±0.17a |
| CV (kcal/100g) | 485.83±0.52c | 484.50±1.17c | 488.23±0.94c | 491.94±0.46b | 495.15±2.17a |
The data are presented as mean ± SD. Bars with different lowercase letters (a–e) within the same physical parameter differ significantly according to Duncan’s least significant difference (LSD) post hoc test at p≤0.05. OIC = Oat-incorporated cookies; Control = 100% WF; OIC1 = 75% WF + 25% OF; OIC2 = 50% WF+ 50% OF; OIC3 = 25% WF+ 75% OF; OIC4 = 100% OF; CV-Calorific value.
Conversely, the amount of carbohydrates in the cookies decreased significantly. The control cookies have the highest carbohydrate content (67.70%), while the OIC4 has the lowest (53.72%). On the other hand, the calorific value of the oats-containing cookies did not change significantly, ranging from 485.83 to 495.15 Kcal/100g.
The sensory scores for colour, appearance, aroma, texture, taste, and overall acceptability of oat-incorporated cookies are presented in Figure 4. The colour scores decreased from 8.55 in the control cookies to 7.00 in OIC4, indicating that increasing oat flour incorporation altered the visual characteristics. Similar declines were observed in appearance, aroma, texture, and taste as oat flour substitution increased. The overall acceptability scores were 8.55, 8.05, 7.40, 7.25, and 6.90 for control, OIC1, OIC2, OIC3, and OIC4, respectively. As the percentage of oat flour increased, there was a significant (p ≤ 0.05) decrease in the overall acceptability score of cookies. However, cookies with up to 75% oat flour substitution (OIC3) had overall acceptability scores ≥ 7.0 and were thus considered acceptable according to the preestablished sensory acceptance criterion. On the other hand, OIC4 (100% oat flour) had an overall acceptability score of 6.90, showing relatively lower consumer acceptance when replacing 100% of the wheat flour. Different superscript letters in Figure 4 indicate statistical differences among treatments for individual sensory attributes. The Kent cultivar was selected for cookie development due to its relatively high protein, fibre, iron, and total phenolic content. Incorporating Kent oat flour increased the protein, fibre, fat, and ash contents of the developed cookies, demonstrating the nutritional contribution of oat flour. Although total phenolic content was not determined in the baked cookies, the relatively high phenolic content of the selected cultivar suggests the potential presence of oat-derived bioactive compounds in the final product. Cookies containing up to 75% oat flour substitution maintained acceptable sensory quality, indicating that improved nutritional composition can be achieved without substantially compromising consumer acceptability.
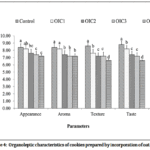 |
Figure 4: Organoleptic characteristics of cookies prepared by incorporation of oat flour. |
The data are presented as mean ± standard deviation (SD). Bars with different lowercase letters (a–e) within the same physical parameter differ significantly according to Duncan’s least significant difference (LSD) post hoc test at p≤0.05. OIC = Oat-incorporated cookies; Control = 100% whole wheat-flour; OIC1 = 75% wheat-flour + 25% oat-flour; OIC2 = 50% wheat-flour + 50% oat-flour; OIC3 = 25% wheat-flour + 75% oat-flour; OIC4 = 100% oat-flour.
Discussion
The physical parameters of different cultivars of oats demonstrate variations in thousand-grain weight, length, thickness, width, bulk density, tap density, and water absorption capacity of five cultivars of oats. The thousand-grain weight, bulk, and tap density were highest for the cultivar Kent. Shah et al.29 found the true density of different oat varieties to range from 1.2 to 1.8 g/mL. He also reported the WAC of different varieties of oats in the range of 1.98-2.36 g/g.
The chemical characteristics varied significantly among oat cultivars. The moisture and fat content ranged between 10.24-10.75% and 5.20-12.40%, respectively. Ren et al.30 examined the moisture content of naked oat cultivar seeds, which was slightly higher and ranged from 9.56 to 18.07% (wet basis), and Sterna et al.31 reported fat content in the range of 5.20 to 12.40% in different cultivars of oat. Zhou et al.32 found that the fat content of oats varied from 4.2 to 11.8 g/100 g across different oat cultivars. Kaur and Singh33 found the fat, ash, and protein contents of the flours of different oat cultivars to be in the ranges of 0.84-3.54%, 2.02-7.27%, and 6.12-13.33%, respectively. The protein estimation results are consistent with the findings of Sterna et al.25, who found protein content ranging from 9.70 to 17.30% across different oat cultivars. Also, Biel et al.34 reported similar results across 11 oat cultivars. These results also align with the findings of Doehlert et al.35, who reported 4.64-7.81% lipids, 14.60-19.60% protein, and 1.84-2.07% ash in oat grains. According to Musa Özcan et al.29 the mature oat seed contains 374.00 cal, 11.00 g moisture, 13.10 g protein, 6.10 g fat, 5.80 g fibre, and 2.40 g ash per 100 g.
The different oat cultivars were found to be rich in micronutrients like Cu, Mn, Fe, and Zn. Musa Özcan et al.36 reported Zn content ranging from 17.20 to 26.10 mg/kg in four oat cultivars. The levels of phytic acid were lower compared to those observed by Lolas37 (0.79-1.01%) in different cultivars of oats. The amount of β-glucan was equivalent to the values reported by Liu and White38, i.e., 4.4 to 7.2 g/100g, and that reported by Sterna et al.31, i.e., 2.70 to 3.50 g/100g, in different cultivars of oat. The results of total phenolic content were comparable to the findings of Peterson et al.39, who reported the TPC content in the range of 14.4-36.1 mg/100g in different oat fractions, and similar results were observed by Kerienė et al.40 in both husk and huskless oat grains.
Based on nutritional and bioactive components, Kent emerged as the superior oat cultivar due to its highest protein (15.46%), crude fibre (6.16%), iron (56.23 mg/kg), and total phenolic content (27.36 mg GAE/100 g), along with its lower phytic acid (0.24%), carbohydrate (61.5%), and caloric value (360.36 Kcal/100 g) and was utilized for preparation of oat incorporated cookies after processing it to flour.
The Principle component Analysis (PCA) revealed that PC1 explained most of the variation (92.70%), driven by crude fibre, crude fat, 1000-grain weight, zinc, magnesium, and WSI, while PC2 was influenced by WAC, moisture, Fe, and b value; PC3 by L value and TPC; and PC4 by Cu content, bulk density, and tap density, indicating that proximate components were the strongest discriminators among oat cultivars, as also reflected in Figure 2.
The comparison of wheat flour (WF) and oat flour (OF) shows clear differences in their physicochemical composition. OF contained higher ash, crude fat, crude fibre, and protein than WF, while WF has higher carbohydrate content. The greater fibre content in OF also contributes to its higher water absorption capacity (WAC), which was more than double that of WF. These compositional differences directly influenced the properties of oat-incorporated cookies (OIC).
As the proportion of OF increased in the cookie formulations, noticeable changes occurred in their physical characteristics. Cookies became lighter in weight and exhibited reduced diameter and spread ratio, especially at higher levels of oat substitution. This reduction in spread ratio may be attributed to the better binding capacity of oat protein,41 which decreased cookie diameter (D) and, in turn, reduced the spread factor (D/T). Alka et al.42 reported a decrease in the diameter of oat-incorporated cookies from 62.43 mm to 59.5 mm, resulting in a decrease in spread ratio from 10.33 to 8.15 when wheat flour was replaced with oat flour at 0, 10, 20, and 30%. The mineral and total phenolic content analyses were conducted on oat cultivars, not on the developed cookies. Therefore, conclusions regarding oat-incorporated cookies were limited to the physicochemical, nutritional, physical, and sensory characteristics evaluated.
When OF was mixed with WF at increasing proportions, the nutritional profile of the cookies improved progressively. Protein, fibre, and fat contents increased because of the naturally richer composition of oat flour. Kaur et al.43 found that when the amount of oat flour in the blend increased, the cookies’ crude protein and crude fibre contents increased significantly (p=0.05). Similarly, Alka et al.42 found an increase in the crude fibre content of oat-incorporated cookies when wheat flour was replaced with oat flour at 10-30%. Chappalwar et al.44 found that cookies made with oats and oat-based composite flour had comparable outcomes. Onweluzo and Iwezu45 noted that adding flour of fibre-rich grains, i.e., soybean and cassava flour, to cookies increased their crude fibre content. At the same time, carbohydrate levels declined, reflecting the lower carbohydrate content of oat flour. Despite these changes, the caloric value of the cookies remained relatively stable, likely due to compensatory increases in fat and decreases in carbohydrates.
The improvement in nutritional composition was also associated with changes in the functional and physical characteristics of cookies. The higher water absorption capacity and fibre content of oat flour influenced dough consistency, spread ratio, and texture of the developed cookies. Increasing oat flour incorporation slightly reduced sensory scores for texture, taste, and overall acceptability, particularly at higher substitution levels, which may be attributed to oat flour’s higher fibre and phenolic contents. However, cookies containing up to 75% oat flour substitution maintained desirable sensory acceptability along with improved nutritional quality.
Sensory evaluation revealed that although cookies with higher oat incorporation were still acceptable, their scores declined slightly as the level of incorporation of OF. Kaur et al.37 observed the highest level of acceptance for cookies made from blends with a 60:40 wheat to oat ratio. Similar findings were reported by Bornare and Khan46 during the sensory evaluation of cookies incorporated with rolled oats and honey, and they found that increasing the level of oats lowered the overall acceptability of cookies from 4.54 to 2.94. Nevertheless, the cookies were rated “moderately desirable” up to a 75% replacement level, consistent with previous research showing reduced acceptability at very high oat concentrations.
The gradual decline in sensory scores at higher substitution levels may be associated with increased fibre concentration and characteristic oat flavour, which affected the texture, mouthfeel, and taste perception of cookies. However, cookies containing up to 75% oat flour substitution maintained desirable sensory acceptability, indicating that moderate incorporation levels can improve nutritional quality without markedly affecting consumer preference. The acceptable sensory quality observed in optimised formulations may also be related to balanced ingredient composition and controlled baking conditions adopted during product preparation. Overall, the results support the use of oat flour to enhance cookie nutrition while maintaining acceptable sensory quality at moderate incorporation levels.
The present investigation demonstrates that incorporating oat flour enriched the nutritional quality of cookies, specifically in terms of protein and fibre content, while maintaining acceptable sensory attributes up to a 75% substitution level. These findings support the potential application of selected oat cultivars in the development of nutritionally improved cookies with acceptable consumer acceptability.
Conclusion
The current research was conducted to provide limited comparative data on the nutritional and functional differences among oat cultivars and to evaluate the acceptability of different oat substitution levels in cookies. Comparative evaluation of five oat cultivars revealed considerable variation in their physicochemical, nutritional, and bioactive characteristics. Among the different cultivars evaluated, Kent showed the highest crude fibre content (6.16%), protein content (15.46%), iron concentration (56.23 mg/kg), and total phenolic components (27.36 mg GAE/100 g), and was therefore selected for cookie development.
The substitution of Kent oat flour progressively increased the protein (9.38–13.63%), crude fibre (2.41–3.68%) and ash contents of cookies, consistent with the compositional properties of the oat flour. Sensory evaluation showed that acceptance declined significantly with increasing oat flour incorporation; however, cookies with 75% oat flour incorporation (OIC3) had an overall acceptability of 7.25, compared with 6.90 for 100% oat flour cookies (OIC4). The cookies with up to 75% oat flour substitution. Therefore, met the predefined sensory acceptance criterion (7.0 or more) and had a higher nutrient content than the control formulation.
These findings demonstrate that cultivar selection plays a significant role in oat-based product development and that up to 75% of Kent oat flour can be used in cookies without compromising the physical and sensory properties. The study demonstrates the potential of nutrient-rich oat cultivars for bakery product formulations and provides a scientific rationale for selecting cultivars in cereal-based product development.
In the future, the storage stability and nutrient bioavailability of the oat-incorporated cookies, as well as their glycaemic response, should be further investigated to prove their nutritional relevance and possible use in value-added bakery products.
Acknowledgement
The authors gratefully acknowledge the Eternal University, Baru Sahib, Sirmour, HP, for facilitating this study and the Vice Chancellor, Eternal University, for providing the motivation and research infrastructure.
Funding Sources
The authors are grateful for the funding provided by the Ministry of Food Processing Industries (MoFPI) through the Government of India grant (F. No. 5-11/2010-HRD) for the development of infrastructure facilities at Eternal University, Baru Sahib.
Conflict of Interest
The authors do not have any conflict of interest.
Data Availability Statement
This statement does not apply to this article.
Ethics Statement
This research did not involve human participants, animal subjects, or any material that requires ethical approval.
Informed Consent Statement
Informed consent was obtained from all panelists before their involvement in the sensory evaluation study.
Clinical Trial Registration
This research does not involve any clinical trials.
Permission to Reproduce Material from Other Sources
Not Applicable
Author Contributions
- Divya Chauhan: Methodology, formal analysis, visualisation and validation, writing-original draft preparation.
- Krishan Kumar: Conceptualisation, supervision, writing, review and editing.
- Jumken Lendo: Setting up references and citations with EndNote, reviewing, and editing.
- Priyanka Thakur: Methodology and analysis.
- Sumaira Jan: Methodology and analysis.
- Qurat Ul Eain Hyder Rizvi: Methodology and analysis.
- Aastha Dewan: Review and editing.
- Shiv Kumar: Principal component analysis.
References
- Alemayehu GF, Forsido SF, Tola YB, et al. Proximate, mineral and anti-nutrient compositions of oat grains (Avena sativa) cultivated in Ethiopia: Implications for nutrition and mineral bioavailability. Heliyon. 2021; 7(8): e07722.
CrossRef - Singh R, De S, Belkheir A. Avena sativa (Oat), a potential neutraceutical and therapeutic agent: an overview. Crit Rev Food Sci Nutr, 2013; 53(2): 126-144.
CrossRef - Head D, Cenkowski S, Arntfield S, et al. Superheated steam processing of oat groats. LWT – Food Sci Technol. 2010; 43(4): 690-694.
CrossRef - Chen, O, Mah, E, Dioum, E, Marwaha, A, et al. The role of oat nutrients in the immune system: a narrative review. Nutrients. 2021; 13(4): 1048.
CrossRef - Paudel, D, Dhungana, B, Caffe, M, & Krishnan, P. A review of health-beneficial properties of oats. Foods. 2021; 10(11): 2591.
CrossRef - Wood PJ. Cereal β-glucans in diet and health. J Cereal Sci. 2007; 46(3): 230–238.
CrossRef - Arshad MU, Anjum FM, Zahoor T. Nutritional assessment of cookies supplemented with defatted wheat germ. Food Chem. 2007; 102(1): 123-128.
CrossRef - Butt MS, Tahir-Nadeem M, Khan MKI, et al. Oat: unique among the cereals. Eur J Nutr. 2008; 47: 68-79.
CrossRef - Tosh, SM, & Bordenave, N. Emerging science on benefits of whole grain oat and barley and their soluble dietary fibers for heart health, glycemic response, and gut microbiota. Nutrition reviews. 2020; 78 (Supplement_1): 13-20.
CrossRef - Qi, X, & Tester, R. The health benefits of wheat versus oats. Cereal Chemistry. 2024; 101(5): 926-936.
CrossRef - Ruja A, Cozma A, Cozma B, Horablaga NM, Dinulescu C, Alexa E, Buzna C, Cocan I, Berbecea A, Dossa S, et al. Nutritional, phytochemical, and rheological profiles of different oat varieties and their potential in the flour industry. Agronomy. 2024;14(7):1438.
CrossRef - Le MS, Hermansen C, Hui LS, Vuong QV. Oat okara flour and its use for nutritional enhancement and glycemic reduction in cookies. Food Frontiers. 2026;7(2):e70185.
CrossRef - Flachowsky, G. Minerals in Animal and Human Nutrition: LR McDowell, Elsevier, The Netherlands. 2003; 644.
- WHO F. Energy and protein requirements. in Geneva: FAO/WHO. (FAO Nutrition Meetings Report Series 52. 1973.
- Official Methods of Analysis. 15th edn. Association of Official Analytical Chemists. Washington DC, 2000.
- Ranganna S. Handbook of analysis and quality control for fruit and vegetable products. 1986: Tata McGraw-Hill Education.
- Vaintraub IA, Lapteva NA. Colorimetric determination of phytate in unpurified extracts of seeds and the products of their processing. Anal Biochem. 1988; 175(1): 227-230.
CrossRef - Ainsworth EA, Gillespie KM. Estimation of total phenolic content and other oxidation substrates in plant tissues using Folin–Ciocalteu reagent. Nat Protoc. 2007; 2(4): 875-877.
CrossRef - Narain M, Bose-Siripurapu S, Jha M, et al. Physico-thermal properties of rice bran. J Food Sci Technol. 1978; 15: 18-19.
- Jones D, Chinnaswamy R, Tan Y, et al. Physiochemical properties of ready-to-eat breakfast cereals. Cereal Foods World 2000; 45(4): 164-168.
- Sosulski, F. The centrifuge method for determining flour absorption in hard red spring wheats. Cereal Chem., 1962. 39: p. 344-350.
- Misra BK, Gupta RK, Ram S. Protocol for Evaluation of Wheat Quality Directorate of Wheat Research Karnal India, 1998: 11-32.
- Ahmad A, Anjum FM, Zahoor T, et al. Extraction and characterization of β-d-glucan from oat for industrial utilization. Int J Biol Macromol. 2010; 46(3): 304-309.
CrossRef - Approved methods of analysis. American Association of Cereal Chemists. St. Paul, M. N, 2000.
- Majzoobi M, Raiss Jalali A, Farahnaky AJJoFQ. Impact of whole oat flour on dough properties and quality of fresh and stored part‐baked bread. 2016; 39(6): 620-626.
CrossRef - Lawless HT, Heymann H. Sensory evaluation of food: Principles and practices. 2nd ed. New York: Springer; 2010.
CrossRef - Meilgaard M, Civille GV, Carr BT. Sensory evaluation techniques. 5th ed. Boca Raton, FL: CRC Press; 2016.
- Clapham, D, Belissa, E, Inghelbrecht, S, et al. A guide to best practice in sensory analysis of pharmaceutical formulations. Pharmaceutics. 2023; 15(9): 2319.
CrossRef - Shah A, Masoodi FA, Gani A, et al. Geometrical, functional, thermal, and structural properties of oat varieties from temperate region of India. J Food Sci Technol. 2016; 53: 1856-1866.
CrossRef - Ren G-y, Yao P, Fu N, et al. Physical properties of naked oat seeds (Avena nuda). Int J Food Eng, 2014; 10(2): 339-345.
CrossRef - Sterna V, Zute S, Brunava L. Oat grain composition and its nutrition benefice. Agric Agric Sci Procedia. 2016; 8: 252-256.
CrossRef - Zhou M, Robards K, Glennie-Holmes M, et al. Oat lipids. J Am Oil Chem Soc. 1999; 76: 159-169.
CrossRef - Kaur M, Singh S. Physical characteristics of different oat cultivars: influence on pasting, functional and antioxidant properties. Qual Assur Saf Crops Foods. 2017; 9(3): 285-293.
CrossRef - Biel W, Bobko K, Maciorowski R. Chemical composition and nutritive value of husked and naked oats grain. J Cereal Sci. 2009; 49(3): 413-418.
CrossRef - Doehlert DC, McMullen MS, Hammond JJ. Genotypic and environmental effects on grain yield and quality of oat grown in North Dakota. Crop Sci. 2001; 41(4): 1066-1072.
CrossRef - Musa Özcan M, Özkan G, Topal A. Characteristics of grains and oils of four different oats (Avena sativa) cultivars growing in Turkey. Int J Food Sci Nutr. 2006; 57(5-6): 345-352.
CrossRef - Lolas G. The phytic acid-total phosphorus relationship in barley, oats, soybeans, and wheat. Cereal Chem. 1976; 53: 867-871.
- Liu Y, White PJ. Molecular weight and structure of water soluble (1→ 3),(1→ 4)‐β‐glucans affect pasting properties of oat flours. J Food Sci. 2011; 76(1): C68-C74.
CrossRef - Peterson DM, Emmons CL, Hibbs AH. Phenolic antioxidants and antioxidant activity in pearling fractions of oat groats. J Cereal Sci. 2001; 33(1): 97-103.
CrossRef - Kerienė I, Mankevičienė A, Bliznikas S, et al. Biologically active phenolic compounds in buckwheat, oats and winter spelt wheat. Zemdirbyste-Agriculture. 2015; 102(3): 289-296.
CrossRef - Mohamed A, Biresaw G, Xu J, et al. Oats protein isolate: Thermal, rheological, surface and functional properties. 2009; 42(1): 107-114.
CrossRef - Alka K, Ali O, Shweta S. Study on the development and evaluation of oat (Avena sativa ) fortified cookies. J Res ANGRAU, 2017; 45(3): 56-61.
- Kaur J, Kaur A, Singh J. Nutritional evaluation and utilisation of composite whole flours for making functional cookies rich in β-glucan and isoflavones. Br Food J. 2017; 119(4): 909-920.
CrossRef - Chappalwar VM, Peter D, Bobde H, et al. Quality characteristics of cookies prepared from oats and finger millet-based composite flour. Eng Sci Technol Int J. 2013; 3(4): 677-683.
- Onweluzo J, Iwezu E. Composition and characteristics of cassava-soybean and wheat-soybean biscuits. J Food Sci Technol. 1998; 35(2): 128-131.
- Bornare D, Khan KSA. Physical and sensory evaluation of cookies incorporated with oats and honey. Int J Eng Res Technol. 2015; 4(8): 407-411.
CrossRef
Abbreviations
OF:- Oat Flour
OIC:- Oat-incorporated cookies
PCA:- Principal component analysis
SMP:- Skimmed milk powder
TGW:- Thousand-grain weight
TPC:- Total phenolic contents
WAC:- Water absorption capacity
WSI:- Water solubility index
 PlumX:
 Views: 1355
  PDF Downloads:
309
PDF Downloads:
309 
Accepted on: 31 Jul 2026
Second Review by: Yohanes Kristianto
Final Approval by: Dr. Vikas Chopra





Web of Science Coverage
Emerging Sources Citation Index (ESCI)
2024 Journal Impact Factor: 1.1
Scopus Journal Metrics
CiteScore 2025: 2.6
CiteScore Details
Sustainable Nutrition: Food Systems, Nutrient Retention, and Public Health Impact

This journal is a member of, and subscribes to the principles of, the Committee on Publication Ethics (COPE)