
Influence of Different Drying Conditions on the Physicochemical Properties of Chitosan/Soy Protein Acid Hydrolysate Biocomposite Films loaded with Marjoram oil for Food Packaging Applications
 , Talha Shireen Khan1, Yasir Abbas Shah1and Ahmed Al-Harrasi1
 1Natural and Medical Sciences Research Center, University of Nizwa, Nizwa, Oman
2School of Health Science, University of Petroleum and Energy Studies, Dehradun, India
Corresponding Author Email: sbsaurabhbhatia@gmail.com
DOI : http://dx.doi.org/10.12944/CRNFSJ.14.2.4
Download this article as:

In this study, chitosan and soy protein acid hydrolysate biocomposite films loaded with Marjoram essential oil were developed using the solvent-casting method. The film-forming solutions were subjected to four different drying conditions such as sun, vacuum, room temperature, and hot air oven drying. The effects of these drying conditions on the structural, thermal, mechanical, and antioxidant properties were evaluated. The SEM analysis revealed that the vacuum-dried and hot air oven-dried films showed smooth, dense, and uniform morphology. The tensile strength ranged from 8.36 MPa to 15.73 MPa with the highest tensile strength observed for hot-air oven-dried films. The water contact angle ranged from 42.97° to 44.99° that indicates that all the film samples remained hydrophilic. The water vapor transmission rate ranged from 256.4 to 301.5 g/m²/day, while the water vapor permeability ranged from 4.58 × 10⁻⁴ to 8.25 × 10⁻⁴ g·mm/m²·h·kPa. The vacuum dried sample showed the highest haze value of 82.74%,light transmittance value of 79.07%., and elongation at break (110.34%). The XRD analysis showed that all the film samples showed broad diffraction peaks around 2θ ≈ 20–21°. This shows their semi-crystalline nature with dominant amorphous regions. The hot-air oven-dried film showed highest crystallinity of 41.6% while the room temperature-dried film showed the lowest crystallinity of 24.6%. All the samples demonstrated strong ABTS radical scavenging activity from 50.70% to 56.30% and the DPPH radical scavenging activity ranged from 27.25% to 30.78%. The room-temperature dried film showed the highest ABTS activity whereas the vacuum-dried film showed the highest DPPH activity. However, the DPPH values were not significantly different among the samples.These findings highlight drying condition as a crucial processing parameter in developing sustainable food packaging materials.
KEYWORDS:Antioxidant; Biopolymer; Drying; Essential Oil; Food packaging
Introduction
Plastic-based packaging waste has become a significant concern that led to degradation into micro or nano-sized particles. These microplastics can quickly enter the soil and plants.1 These particles can adversely affect both terrestrial and aquatic animals through ingestion, entanglement, and subsequent impairment of growth, reproduction, and survival.2 biopolymer offer a more environmentally sustainable alternative because they are generally biocompatible and biodegradable that allows them to decompose more readily in the environment. Thus reducing their long-term ecological impact.3 Nowadays, food safety and environmental protection are becoming important topics. The bio-based food packaging films are gaining popularity because of their safety and biodegradability.4-6
Casting process is a cost-effective lab scale process commonly utilized to cast the film forming solutions to develop films for packaging applications.7 This lab scale process is a crucial process in a way as to conveniently study the behavior (i.e. physical and chemical properties) of the films. This lab scale process has several merits over the bulky and costly machines such as electrospinning, three-dimensional printing and extrusion. Drying after casting is a crucial parameter that can significantly impact the physical and chemical properties of biopolymer-based films.8 Drying of film forming solution is performed to remove solvent (like water or organic solvents) to form a solid homogenous film however variation in rate of drying or inappropriate drying condition can lead to the formation of precipitates or insoluble aggregates or any heterogeneous structure or any structural deformities.9 Exaggerated drying conditions such as high temperature drying, prolonged drying, non-uniform drying, uneven drying rate can impact the distribution of polymers.10 This can also cause aggregation, flocculation, phase separation, crack formation. Studying the effect of drying process after casting the film forming solution is imperative especially when it contain volatile components as in case of essential oil loaded packaging as aggressive drying can alter not only oil composition, but it can also cause the degradation of the components.
Composite biopolymer based active films are gaining more attention as incorporation of copolymer can drastically improve the functional properties of films fabricated with one polymer. Previous studies have shown that chitosan may interact with proteins to form films with improved properties.11 Chitosan- soy protein isolate composite has been recently studied as polymers that interact via electrostatic interactions. This is mainly due to charge differences, chitosan (positively charged)12 and soy protein (negatively charged)13 forms stable complex. Recent study also showed that chitosan (CS) addition reduced soy protein isolate (SPI) solubility and change the tertiary structure of SPI and enhance its relative crystallinity.14 However, this type of composite packaging lacks antioxidant and antimicrobial properties that are imperative in food packaging industry to extend the shelf life of any food product. EOs have been widely used in active packaging as they are alternative to harmful synthetic preservatives and possess antimicrobial as well as antioxidant properties.15 Origanum majorana plant is native to Africa, Egypt, Spain, and naturalized in Southern Europe.16 Origanum majorana essential oil (MEO), commonly known as marjoram essential oil used as flavoring agent or adjuvant. According to the 21 CFR Part 182 (Subchapter B), this oil is generally considered as safe (GRAS) for its intended use under the Section 409 of the Act.17,18 This herb exhibits a wide range of antioxidant, antibacterial, antifungal, nephroprotective, anti-proliferative, anti-cancer activities.19 These properties are primarily attributed to its rich composition bioactive compounds such as thymol, carvacrol, tannins, hydroquinone, β-sitosterol, cis-sabinene hydrate, limonene, terpinene, camphene, and flavonoids like diosmetin, quercetin, luteolin, and apigenin.20
The components of EO also serve as crosslinking against which can also improve compatibility between CS and SPI, that could further help in developing stable and uniform films for food packaging application.21 However, EOs contain volatile components that are susceptible to drying process, thus selection of drying condition plays a crucial role in preventing the unnecessary changes in the essential oil chemical composition.
Several studies reported that the drying rate and temperature significantly alter polymer chains arrangement, crystallinity, and retention of bioactive components. Thus, these factorsinfluence the functional properties such as tensile strength, antioxidant, and transparency of the developed biopolymer films. However, the primary goal of these studies has mainly focused on single drying methods. Moreover, the systematic comparative evaluation across various drying environments is limited.22,23 Therefore, the objective of this study was to compare the influence of four different drying protocols such as sun drying, vacuum drying, room-temperature drying, and hot-air oven drying on the physicochemical properties of the chitosan/soy protein acid hydrolysate films loaded with marjoram essential oil. This study focuses on drying-based changes within a fixed formulation on the structural, thermal, optical, mechanical, and antioxidant properties of developed bioactive films.
Materials and Methods
Materials
Chitosan was obtained from Sisco Research Laboratories Pvt. Ltd., based in Andheri, India. Marjoram oil was sourced from Nature Natural India, located in Uttar Pradesh, India. Soy Protein acid hydrolysate powder was bought from Sigma Aldrich, United States. Glycerol was acquired from BDH Laboratory Supplies, located in Dorset, UK. Tween 80 (Polysorbate 80) extra pure was sourced from Sisco Research Laboratories Pvt. Ltd., based in Andheri, India.
Films fabrication
The films were developed using the solvent-casting method. Chitosan solution was prepared by dissolving 2 g of chitosan in 100 mL of 1% acetic acid solution to obtain a 2% w/v chitosan solution. The soy protein acid hydrolysate solution was prepared by dissolving 1 g of soy protein acid hydrolysate in 100 mL of distilled water to obtain a 1% w/v solution. Both solutions were stirred separately at 45°C and 300 rpm for 2 h. The chitosan and soy protein solutions were then mixed to obtain a composite film-forming solution. Glycerol was added as a plasticizer at 0.3% (v/w based on the total polymer content in the solution). Both marjoram essential oil and Tween 80 were added at 0.4% v/v. Tween 80 was used to facilitate the dispersion of oil in the polymer matrix. The film-forming solution was mixed at 45°C and 300 rpm until a visually homogenous emulsion was obtained. The solution was divided into four equal portions for drying treatments. For each treatment, 20 mL of film-forming solution was cast into 90 x 15 mm petri dishes. Film samples were prepared using five independent batches per treatment, and characterization was performed independently of the prepared films. Five independent film batches were prepared for each drying treatment (five film samples per treatment). Each independently casted film sample was treated as one experimental replicate. Thus, after mixing the final film-forming solution contained 1% w/v chitosan and 0.5% w/v soy protein acid hydrolysate. This corresponds to a total polymer concentration of 1.5% w/v.
For sun drying treatment, the cast solutions were placed outdoors in a clean and dust-protected area under sunlight. The plates were covered with a breathable protective cover to minimize contamination that allowed the evaporation of moisture. The drying period was 24 h and drying continued until constant film weight was achieved. During drying, the environmental conditions varied. The sun-dried films were labelled as CP1.
For vacuum drying, VACUCELL vacuum dryer Model: VUS-B2V-M/VU55 from Germany was used. A 20 mL of solution was poured in the petri plates and labelled as CP2. The film forming solution was kept at 35±1°C under the reduced pressure of 0 bar. The airflow inside the chamber was static. The drying time was 18 hours until constant weight of the films was achieved.
For room-temperature drying, 20 mL of solution was poured in the petri plates and labelled as CP3. The film forming was kept in a controlled laboratory environment at 25±2°C under the static air conditions without forced airflow. The samples were placed on a plain horizontal vibration-free surface inside a closed laboratory room to minimize the environmental variability. The drying time was 48 hours until constant weight of the films was achieved.
For hot-air oven drying, BiobaseBioland Co., Ltd Constant-Temperature Drying Oven Model: BOV-T105F from China was used. A 20 mL of solution was poured in the petri plates and labelled as CP4. The film forming was kept in a hot-air drying oven at 35±1°C under forced airflow. The drying time was 12 hours until constant weight of the films was achieved.
Table 1: Composition of bio-composite films with different drying methods
| Sample Code | Chitosan
(w/v) |
Soy Protein Acid Hydrolysate (w/v) | Glycerol (w/v) | Marjoram Oil (v/v) | Tween 80 (v/v) |
| CP1 (Sun-drying) | 2% | 1% | 0.3% | 0.4% | 0.4% |
| CP2 (Vacuum-drying) | 2% | 1% | 0.3% | 0.4% | 0.4% |
| CP3 (Room temperature-drying) | 2% | 1% | 0.3% | 0.4% | 0.4% |
| CP4 (Hot air oven-drying) | 2% | 1% | 0.3% | 0.4% | 0.4% |
Gas Chromatograph Mass Spectrometry
The GC-MS analysis of marjoram oil was conducted using a Shimadzu GC-MS-QP-2010 Plus mass spectrometer. For this analysis we followed procedure reported in our previous study. The flow rate of carrier gas (Helium) was 1.0 mL per minute. The temperature of the ion sources was maintained at 220°C and the temperature of the injector was kept steady at 260°C. The chemical components of marjoram oil were analyzed by observing their retention times and peak area in the chromatogram.
Thickness
Digital micrometer (Dequmont digital vernier caliper (ROHS NORM 2011/65/EU)) was used to measure the thicknesses of the film at different areas. The thickness of film was measured at five different positions on each film sample and the average of these five readings was used as the thickness value.
Mechanical attributes
The tensile strength (TS) and the percentage elongation to break (EAB) of the films were determined using texture analyzer (TA.XT plus C from Stable Micro Systems, TA Instruments, Godalming, UK) as per ASTM D882. Before testing, the films were conditioned at relative humidity (RH) of 50±5%, temperature of 23±2°C for 24 h. The film samples were cut into 7 by 60 mm strips. To determine the mechanical strength of the films jaws of TA.XT plus C was set with a separation of 40 mm and an operating speed of 8.30 mm/s. The mechanical properties were measured by using three film samples from each drying treatment and the results were measured obtained using the software Exponent Connect by Stable Micro Systems.
Color Parameters of the films
CIELAB color parameters of the films, including a*: redness, b*: yellowness, and L*: lightness was evaluated by using a portable digital chromameter (CR-410, Konica Minolta, INC, Japan) against a standard white background. The readings were obtained in a triplicate manner by taking the measurements at 3 different sites per film sample [29]. For each drying treatment, three film samples were analyzed. For each sample, color readings were taken in triplicate at three different sites and the average value was obtained from the mean values of L*, a*, and b* of each sample. The overall color difference (∆E) was determined as per the equation reported in our previous study.
Haze value and Light Transmittance
The light transmittance and haziness of the fabricated films were measured using a Haze meter (YH1200) from Guangdong Sanenshi Technology Co., Ltd, China. For each drying treatment, three film samples were analyzed and each sample was measured in triplicate. The average values were then presented as percentage (%).
Morphological properties
To check the morphology of the fabricated CP biocomposite films a scanning electron microscope (JSM6510LA from Jeol, Japan) was used. The SEM operated at 20kV accelerating voltage at x200 magnification to generate the micrographs. During the preparation of film samples for imaging the samples were attached to the aluminium stubs with double-sided adhesive tape. Before image process of the prepared samples a thin layer of gold was applied through sputter-coating. The surface visibility and image clarity were improved by gold coating.
X-ray diffraction
An advanced Bruker D8 Discover instrument was used to conduct the crystallinity and amorphous nature of fabricated biocomposite films. The instrument was set to operate at 40kV. A comprehensive scan of the samples was taken from a 2-theta (2Ɵ) range from 5°-55°. A scan rate of 0.500 seconds per data point was used to acquire data with high precision. Copper radiation with a wavelength of 1.5418 Å was used to obtain a detailed and accurate diffraction pattern for analysis. The Bragg’s law was used to measure the Interplanar spacing (d) by using the following equation:
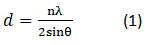
Where n represents the order of diffraction (usually n=1), λ represents X-ray wavelength (here, Cu Kα = 1.5406 Å), d represents interplanar spacing, and θ represents diffraction angle (half of the measured 2θ).The percentage of crystallinity was determined directly by using DIFFRAC.SUITE Software.
FTIR spectrometry
To investigate the chemical interactions between chitosan, glycerol, marjoram oil, tween 80 and soy protein FTIR spectroscopy was used. An InfraRed Bruker Tensor 37 spectrometer from Ettlingen, Germany, was used for functional group analysis. The spectra were recorded with an extensive spectral interval ranging from 400 cm-1 to 4000 cm-1. The scans were processed using Origin Pro software (1.5 2024).
Thermal Gravimetric Analysis (TGA)
The thermal stability of chitosan and soy protein loaded with plant extract was investigated by Thermogravimetric analysis (TGA) and Derivative Thermogravimetry (DTG). This thermal analysis was carried out using a TA- SDTQ600 thermal analyzer (New Castle, DE, USA). A total of 5.0 ± 0.1 mg of film sample was heated from 10°C to 600°C at 10°C min−1 under nitrogen atmosphere (100 mL min−1).
Water Contact Angle (WCA)
The surface hydropobic properties of developed films were determined by using OCA11 Contact Angle analyzer (Data Physics Instruments GmbH, Filderstadt, Germany) was used. For hydrophobic and hydrophilic, a syringe filled with distilled water was used. A 2 x 2 cm film strip was cut and placed on the platform. Then a droplet of water can drop over the surface of the film. A 1044 x 1080 resolution camera was used to capture the image of a water droplet placed on the surface of the films. For each drying treatment, three film samples were analyzed and each sample was measured in triplicate by using dpiMAX software.
Water vapor transmission rate (WVTR) and water vapor permeability (WVP)
The water vapor transmission rate (WVTR) and water vapor permeability (WVP) of film samples were determined by using ASTM standard ASTM E96/E96M. For this analysis, the Payne permeability cups form Elcometers (model elcometers 5100) were used. These cups were filled with silica gel. Then, the film samples were firmly enveloped around the cups. The samples were placed in a climate incubator (model BJPX-A400) from BIOBASE Group, Jinan, Shandong, China. with relative humidity (RH = 75%) at 25°C. The samples were weighted before and after 24 hours to observe the change in weight. The WVTR was calculated by using a specific mathematical formula.
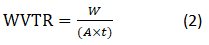
w = weight of water vapor transmitted (g); A = area of film exposed (m2); t = time of transmission (day or hour depending upon units).
The WVP was calculated from the weight changes that were recorded by taking into consideration a specific formula:

Where ∆m/∆t is the moisture absorption rate of the equation, it is calculated as the gain mass moisture uptake in a specified duration of time (g/d). A denotes the film cross-sectional area (m²), while ∆P denotes the pressure difference in water vapor on either side of the film (kPa). d stands for the thickness of the film (mm).
Radical Scavenging Activity
The current study followed the procedure of the ABTS cation scavenging assay described by Re et al.24 The ABTS radical neutralizing potential of the extract-loaded film samples was evaluated by measuring absorbance shifts at 734 nm after a six-minute integration period. This involved using 10 mg of the film sample and 1.9 mL of a 7 mmol/L ABTS radical mixture. The antioxidant analysis results were quantified as the percentage reduction of the ABTS cation radical.
The antioxidant potential was also assessed by using the DPPH assay. 50 mg of the samples were combined with 1.95 mL of methanolic DPPH solution (Sigma-Aldrich, USA) according to the procedure described by Brand-Williams et al.25 After vortexing for 30 seconds, the mixture was allowed to incubate at room temperature in complete darkness for half an hour. The antioxidant activity was then calculated using a spectrophotometer to detect the absorbance at 517 nm.
The values were expressed in percentage (%) and was evaluated by using the formula:

where Ac is the absorbance of the ABTS solution and At is the absorbance of the reduced free radical solution.
Statistical analysis
The statistical analysis was performed by using One-way ANOVA to evaluate the differences among different drying treatments. Fisher’s post-hoc test was used at a significance level of p < 0.05. For most characterization analysis, each sample was measured in triplicate. The data were presented as mean ± standard deviation, and statistical significance was determined at the 95% confidence level.
Results
Gas Chromatograph Mass Spectrometry
Figure 1 illustrates the GC-MS analysis of marjoram oil. A total of 36 compounds were detected and a complex mixture of monoterpenes, oxygenated monoterpenes, and sesquiterpenes were identified in the composition. 3-Cyclohexen-1-ol, 4-methyl-1-(1-methylethyl)- (R)- (systematically known as (R)-(-)-Terpinen-4-ol and commonly known as 4-Terpineol) was the most abundant compound accounting 26.51% of total composition with the molecular weight of 154 g/mol. Caryophyllene a bicyclic sesquiterpenes accumulating 11.61% with the molecular weight of 204 g/mol of the total composition. γ-Terpinene was identified with the molecular weight of 136 g/molaccumulated 10.14% of the total composition. Linalool was detected with the molecular weight of 154 g/mol and accommodating 8.90% of total composition of marjoram oil. A bicyclic monoterpene commonly known as Sabinene with the IUPAC name of Bicyclo[3.1.0]hexane, 4-methylene-1-(1-methylethyl) was detected accumulating 8.71% (molecular weight of 136 g/mol). o-Cymene, is an isomer of cymenes, with the molecular weight of 134 g/mol accommodating 8.44%, as shown in Table 2. Several other volatile compounds such as Linalyl acetate (6.35%), Diethyl phthalate (4.90%), and D-Limonene (3.91%) were also detected.
Table 2: GC-MS analysis of bioactive components from Marjoram Oil
| Compound | Area (%) | Retention time (mins) | Molecular weight (g/mol) |
| 3-Cyclohexen-1-ol, 4-methyl-1-(1-methylethyl)-, (R) | 26.51% | 13.04 | 154 |
| Caryophyllene | 11.61% | 22.32 | 204 |
| γ-Terpinene | 10.14% | 8.01 | 136 |
| Linalool | 8.90% | 9.77 | 154 |
| Bicyclo[3.1.0]hexane, 4-methylene-1-(1-methylethyl) | 8.71% | 5.15 | 136 |
| o-Cymene | 8.44% | 6.78 | 134 |
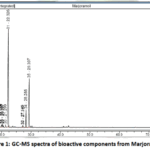 |
Figure 1: GC-MS spectra of bioactive components from Marjoram oil |
Visual Characteristics
Figure 2 shows the visual characteristics of fabricateed biocomposite films. All the film samples demonstrated transparent, visible, and flexible structure. The samples were easy to peel and slight sticky in nature. The CP1 sample demonstrated smooth and homogenous surface. The CP3 and CP4 samples demonstrated moderate smoothness. The CP2 sample was also smooth and homogenous however, wrinkles were observed on the surface of CP2 sample.
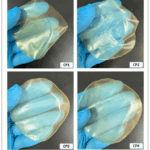 |
Figure 2: Visual Characteristics of CP biocomposite films |
Thickness
Table 3 demonstrates the thickness of chitosan and soy protein biocomposite films loaded with marjoram oil measured at 5 different portions. The CP1 film sample (sun dried) demonstrated the highest thickness of 0.08±0.005a mm among all the samples. The CP2 (vacuum dried) and CP3 (room temperature dried) film samples showed intermediate thickness of 0.07±0.01b mm and 0.07±0.005ab mm. However, the CP4 film sample (hot air oven dried) showed lowest thickness of 0.05±0.005c mm.
Mechanical attributes
Table 3 demonstrates the tensile strength (TS) and elongation at break (EAB) of chitosan and soy protein biocomposite films loaded with marjoram oil. The CP4 sample exhibited the highest TS of 15.73 MPa, whereas the lowest the TS of 8.36 MPa was observed for CP1. Both CP2 and CP3 samples showed intermediate TS values of 10.45 MPa and 11.96 MPa, respectively. The CP2 film sample demonstrated highest EAB value of 110.34% among all the samples. The lowest EAB value was 87.23% observed in CP1 film sample. The CP3 and CP4 demonstrated 109.20% and 108.57% EAB value. However, a non-significant change in the EAB values of CP2 – CP4 samples were observed.
Table 3: Thickness, Tensile strength, and Elongation at break of CP biocomposite films
| Sample Code | Thickness (mm) | Tensile Strength (MPa) | Elongation at Break (%) |
| CP1 | 0.08±0.005a | 8.36±1.45c | 87.23±2.47b |
| CP2 | 0.07±0.01b | 10.45±1.63bc | 110.34±6.50a |
| CP3 | 0.07±0.005ab | 11.96±1.11b | 109.20±2.29a |
| CP4 | 0.05±0.005c | 15.73±1.27a | 108.57±2.52a |
*Values inside a column denoted by different letters (a, b, and c) signify significant differences (p < 0.05).
Color Parameters of the films
Table 4 shows the color parameters of the fabricated films. The L* value ranged from 38.32 to 39.84. Among all the samples the highest L* value was demonstrated by CP2 sample. The a* value varies significantly among samples from 0.14 to 1.01. The b* value represent yellow-blue color. A significant difference among the yellow-blue color from 7.74 to 10.79 was observed. The overall change in color (ΔE) ranged between 13.02 and 14.67 was observed. The CP3 showed the lowest ΔE value of 13.02 and CP1 demonstrated the highest ΔE value of 14.67.
Table 4: Color analysis of CP biocomposite films
| Sample Code | L* | a* | b* | ΔE |
| CP1 | 38.32±0.92b | 1.01±0.08a | 10.79±0.13a | 14.67±0.46a |
| CP2 | 39.84±0.68a | 0.45±0.05b | 8.17±0.20c | 13.84±0.51b |
| CP3 | 38.58± 0.55b | 0.38±0.04b | 8.79±0.01b | 13.02± 0.01c |
| CP4 | 39.13± 0.01ab | 0.14±0.01c | 7.74±0.01d | 13.33±0.39bc |
*Values inside a column denoted by different letters (a, b, and c) signify significant differences (p < 0.05).
Haze value and Light Transmittance
Table 5 shows the haze value and light transmittance of biocomposite films. The haze value varied significantly from 68.42% to 82.74% among all the fabricated samples. The CP1 and CP4 sample exhibited the lowest haze value (68.42% and 68.61%) among all the samples. The CP2 showed the highest haze value of 82.74% and CP3 sample showed moderate value of haze 78.89% among all the samples. The light transmittance of the CP film samples significantly ranged from 72.68% to 79.07%. The lowest light transmittance was observed in CP1 film. The CP3 and CP4 film samples exhibited moderate light transmittance values (77.95% and 78.56%). The highest light transmittance value (79.07%) was demonstrated by CP2 film samples.
Table 5: Haze and Light transmittance of CP biocomposite films
| Sample Code | Haze Value (%) | Light Transmittance (%) |
| CP1 | 68.42±0.52c | 72.68±0.56c |
| CP2 | 82.74±1.87a | 79.07±0.76a |
| CP3 | 78.89±0.55b | 77.95±0.13b |
| CP4 | 68.61±0.10c | 78.56±0.16ab |
*Values inside a column denoted by different letters (a, b, and c) signify significant differences (p < 0.05).
Morphological properties
Figure 3 illustrates the morphological properties of CP biocomposite films. The surface area of CP1 sample showed a relatively smooth morphology with some micro-particles. Additionally, some small, aggregated structures were also observed that might be due to the presence of insoluble protein fractions.The CP4 sample also demonstrated some particles and aggregated particles on the surface area like CP1. The cross-sectional area of CP1 film sample shows homogeneous structure. However, the formation of two distinct layer is observed in the cross-sectional area of CP1 film sample. The surface area of CP2 film sample revealed a homogenous and smooth surface among all the samples. The cross-sectional area of CP2 film sample reveals the formation of a dense and compact structure. The CP3 shows an irregular surface. The cross-sectional area of CP4 film samples appeared to be smooth and homogeneous.
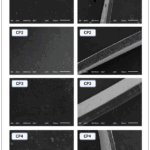 |
Figure 3: Morphological properties of CP biocomposite films |
X-ray diffraction (XRD)
Figure 4 shows the XRD patterns of the developed films. All the samples showed a broad diffraction peak around 2θ ≈ 20–21°. This indicates a semi-crystalline nature of the film matrix with dominant amorphous regions. The chitosan-based film shows a crystalline/semi-crystalline nature at 2θ ≈ 19.8–20°26 while soy protein shows a characteristic diffraction contribution around 2θ ≈ 19.8°27 related to its β-sheet secondary structure. The CP1 sample showed a peak at 20.14° with a d-spacing of 4.405 Å, CP2 showed a peak at 20.02° with a d-spacing of 4.432 Å, CP3 sample showed a peak at 20.30° with a d-spacing of 4.371 Å, and CP4 showed a peak at 20.75° with a d-spacing of 4.277 Å. The CP4 sample showed the highest crystallinity value of 41.6% and the smallest d-spacing of 4.277 Å. This indicates comparatively closer molecular packing. The CP3 samples showed the lowest crystallinity of 24.6%. This indicates the highest amorphous fraction among all the samples. The CP2 sample showed the largest d-spacing of 4.432 Å. This shows the relatively expanded inter-chain spacing.
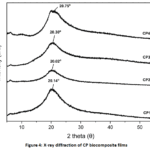 |
Figure 4: X-ray diffraction of CP biocomposite films |
FTIR spectrometry
Figure 5 shows the FTIR-based functional group analysis of developed films. All the developed films showed the main characteristic absorption bands of chitosan-soy protein-glycerol and oil-based matrix. A broad absorption band was observed around 3373 cm-1 in all the samples. This could be due to the overlapping stretching vibrations of O-H and N-H groups from chitosan, soy protein, and glycerol.21The bands at 2922 cm-1 and 2870 cm-1 were detected in the spectra. These bands were assigned to the asymmetric and symmetric stretching vibrations of aliphatic C-H groups, respectively.28,29 These bands are mainly associated with the polysaccharide backbone and lipid/terpenoid components of the incorporated oil. A band observed at 1546 cm-1 corresponds to the amide II region which mainly arises from N-H bending and C-N stretching vibrations of chitosan amino groups30,31 and soy protein peptide bonds.32 Furthermore, the band at 1406 cm-1 might be related to C-H bending and/or C-N stretching vibration. However, the characteristic band at 1031 cm-1 was assigned to C-O-C and C-O stretching vibrations of polysaccharide structure of chitosan.30
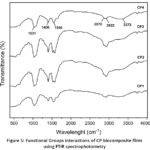 |
Figure 5: Functional Groups interactions of CP biocomposite films using FTIR spectrophotometry |
Thermal Gravimetric Analysis (TGA) and Derivative Thermogravimetry (DTG)
Figure 6 shows the TGA thermograms of the developed films and Figure 7 shows the corresponding DTG curves. The TGA curves exhibited three main thermal degradation stages which were further confirmed by the DTG peak pattern. The first weight loss stage occurred below 150°C and was mainly associated with moisture evaporation. The weight loss in this region followed the order CP4 (8.95%) ≈ CP1 (8.91%) > CP2 (8.23%) > CP3 (7.72%). The apparent onset temperature of the main polymer degradation was observed at approximately 150°C for all the films. This indicates that the drying method did not significantly shift the beginning of polymer degradation. The second major degradation occurred between 150°C and 440°C with weight loss values of 59.77% for CP1, 61.79% for CP2, 59.91% for CP3, and 62.79% for CP4, respectively. This stage corresponded to the main DTG degradation region around 170-280°C and 390-500°C. This indicates the maximum degradation rate of glycerol-associated components and the chitosan-soy protein polymeric matrix. The third stage occurred between 440°C and 550°C and corresponded to the decomposition of carbonaceous residues. At the end of this stage, the CP2 sample showed the highest residual mass (13.15%) followed by CP4 (5.01%), CP3 (3.85%), and CP1 (3.28%). This suggests higher char-forming tendency or slower terminal degradation in the vacuum-dried film. The sharper DTG peaks of CP3 and CP4 samples indicated faster and more defined degradation events, whereas the broader DTG peaks of CP1 suggested more gradual decomposition.
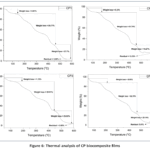 |
Figure 6: Thermal analysis of CP biocomposite films |
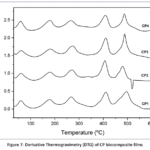 |
Figure 7: Derivative Thermogravimetry (DTG) of CP biocomposite films |
Water Contact Angle (WCA)
Figure 8and Table 6 shows the WCA values of the developed films. The WCA values ranged from 42.97° to 44.99°. The CP1 sample showed the lowest WCA value of 42.97°, followed by CP2 at 43.59° and CP3 at 44.33°. The highest WCA value was observed for CP4 sample with 44.99°. All the WCA values of the developed films are below 90°. This indicates the hydrophilic nature of the films. However, the gradual increase in WCA from CP1 to CP4 sample suggest a reduction in surface hydrophobicity. A higher WCA indicates greater surface hydrophobicity and lower surface affinity towards water.33
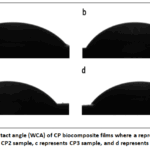 |
Figure 8: Water contact angle (WCA) of CP biocomposite films where a represents CP1 sample, b represents CP2 sample, c represents CP3 sample, and d represents CP4 sample. |
Water Vapor Transmission Rate (WVTR) and Water Vapor Permeability (WVP)
Table 6 shows the WVTR and WVP of the developed films. The WVTR ranged from 256.4 to 301.5 g/m²/day. The CP1 sample showed the highest WVTR value of 301.5 g/m²/day followed by CP2 at 266.8 g/m²/day and CP3 at 263.3 g/m²/day. The lowest WVTR values was observed for CP4 sample with 256.4 g/m²/day. However, this difference in WVTR was non-significant. A similar trend was observed for WVP where CP1 sample showed the highest WVP value of 8.25 × 10⁻⁴ g·mm/m²·h·kPa, whereas CP4 showed the lowest WVP value of 4.58 × 10⁻⁴ g·mm/m²·h·kPa. The CP3 and CP2 sample showed intermediate WVP values of 6.34 × 10⁻⁴ and 5.56 × 10⁻⁴ g·mm/m²·h·kPa, respectively.
Table 6: Water contact angle (WCA), Water Vapor Transmission Rate (WVTR), and Water Vapor Permeability (WVP) of CP biocomposite films
| Sample Code | Water Contact Angle (°) | WVTR (g/m²/day) | WVP ((g*mm)/(m²*h*kPa)) |
| CP1 | 42.97±0.64c | 301.5±18.0a | 8.25×10⁻⁴±0.90a |
| CP2 | 43.59±0.53bc | 266.8±39.4a | 5.56×10⁻⁴±0.72bc |
| CP3 | 44.33±0.14ab | 263.3±31.8a | 6.34×10⁻⁴±0.53b |
| CP4 | 44.99±0.61a | 256.4±26.2a | 4.58×10⁻⁴±0.64c |
*Values inside a column denoted by different letters (a, b, and c) signify significant differences (p < 0.05).
Radical Scavenging Activity
Figure 9 shows the ABTS radical scavenging activity of the developed films ranged from 50.70% to 56.30%. The CP3 sample showed the highest ABTS radical scavenging activity of 56.30% among all the formulations followed by CP2 sample (55.37%). Both CP2 and CP3 samples were significantly similar. However, the CP1 and CP4 samples showed lower ABTS radical scavenging activity of 50.70% and 51.17%, respectively. Both CP1 and CP4 samples were significantly similar to each other but lower that CP2 and CP3 samples.
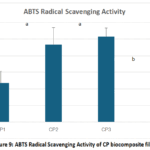 |
Figure 9: ABTS Radical Scavenging Activity of CP biocomposite films |
Figure 10 shows the DPPH radical scavenging activity of the developed films ranged from 27.25% to 30.78%. The CP2 sample showed the highest DPPH activity of 30.78%, followed by CP3 sample (29.61%), CP4 sample (28.24%), and CP1 sample (27.25%). However, there was not significant difference observed among all the samples.
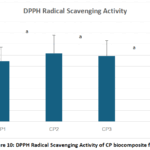 |
Figure 10: DPPH Radical Scavenging Activity of CP biocomposite films |
Discussion
4-Terpineol is widely used due to its various applications. It possess antimicrobial, antiviral, antioxidant, anti-inflammatory, anti-hypertensive, and anti-cancer properties.34 Caryophyllene has reported for several biological activities such as antibacterial, antioxidant, anxiolytic, anti-inflammatory, and gastroprotective.35 γ-Terpinene is well recognized for its potential antioxidant properties.36 Linalool has anti-inflammatory, anticancer, anti-hyperlipidemic, antimicrobial, analgesic, anxiolytic, antidepressive and neuroprotective properties.37 Sabinene is commonly used in perfume and flavor industries because of its potential odor and anti-inflammatory activities.38 Elkousy, R.H. et al. (2022) reported that the GC-MS analysis of marjoram oil is composed of trans-sabinene hydrate, terpinen-4-ol, linalyl acetate, and caryophyllene oxide.39
The high thickness of CP1 sample might be attributed to the retention of more moisture due to surrounding humidity in atmosphere. The low thickness of the CP4 sample might be due to higher water evaporation that compacts the structure which resulted in thinner films. The variation in thickness of the film sample might be attributed to the rate of water loss and shrinking of the samples during the drying process.
The lower TS and EAB of the CP1 sample might be associated with uncontrolled sun-drying conditions, where the changes in temperature, humidity, and evaporation rate could produce less uniform polymer-chain arrangement and weaker matrix cohesion. In contrast, vacuum drying, room-temperature drying, and hot-air oven drying could have promoted more uniform film formation, better plasticizer distribution, and stronger intermolecular interactions between chitosan and soy protein. The chitosan-protein composite films show improved mechanical performance due to interactions such as hydrogen bonding, ionic interactions, and hydrophobic interactions that contribute to matrix cohesion and flexibility. The highest TS of CP4 suggest that hot-air oven drying produced a more compact and mechanically resistant network. This might be due to faster and more controlled solvent removal that improved the polymer-chain packing. The drying temperature has been showed to strongly affect intermolecular interactions and mechanical performance in biopolymer blend films. For example, the drying-induced changes in film compactness and compatibility could enhanced the TS and EAB.41 Furthermore, the marjoram oil and Tween 80 might influence flexibility by modifying the spacing and interaction between polymer chains. However, the essential oils could either reduce TS or have limited effects that depends on their concentration and compatibility with the chitosan matrix.40 The mechanical results suggest that the controlled drying especially hot-air oven drying produced a stronger chitosan-soy protein film without compromising extensibility.
The L* value represents the lightness of the fabricated films. The lower L* value of all the samples indicates that the biocomposite films have relatively dark tones with significant difference in their brightness. The a* value represents red-green color. The (+ve) a* represents red tone and (-ve) a* value indicates green tone.42 All the a* values of fabricated films are positive so this indicates that the films have more red tone in their appearance. The (+ve) b* represents yellow tone and (-ve) b* value blue tone.42 This suggests that all samples have yellow color dominant in their appearance. This might be due to the yellowish color of soy protein that led to (+ve) b* value among all the samples.43The lower L* value and higher a*, b* (but +ve) values in CP1 sample suggests the presence of more reddish-yellow color. This might be attributed to the stronger Maillard-type reaction between chitosan and soy protein acid hydrolysate.44 The higher L* value and lower a*, b* (but +ve) values in CP1 sample suggests the presence of less reddish-yellow color.
The low haze value of CP1 and CP4 sample suggests that drying of film forming solution under the sun or in hot air oven could led to the formation of more uniform film structure thus reducing the scattering of light through fabricated films. The high haze value of CP2 and CP3 samples could be attributed to formation of less transparent films which resulted in the increases in scattering of light. This increase in scattering might be due to the uneven distribution of oil within the polymer matrix during drying.Among all the film samples the vacuum dried film sample (CP2) demonstrated the highest haze value and light transmittance. Similar findings have been reported in the previous literature where addition of oil in the polymer matrix decrease the light transmittance and increases the haze value of fabricated films.45
The formation of sample aggregates on the surface of CP1 sample and CP4 sample might be attributed to the rapid uneven evaporation of the solvent limits the rearrangement of the molecules during film formation. These aggregated particles on the surface might be due to the phenomena of thermodynamic incompatibility of soy protein and chitosan.21 The formation of aggregated particles on the surface of CP1 sample might be attributed to the phase separation phenomena that usually occurs during solvent casting method when the film forming solution is subjected to uncontrolled drying conditions (in the case Sun drying). The chitosan and soy protein are partially miscible so during the uneven evaporation of film forming solution the differences in these biopolymer interactions might cause the phase separation.46 This might be due to the controlled drying of film forming solution that allows the polymer chains to re-arrange into a continuous and compact matrix. This rearrangement of polymer chains gives a smooth, homogenous surface area with dense cross-sectional surface.47 The irregular structure on the surface of CP3 sample might be associated to the formation of dispersed oil droplets or microdomains when the emulsification is incomplete or droplets coalesce during the evaporation of solvent. This behavior is typically observed in chitosan-based oil-loaded films.48 Similar findings have been reported in the previous literature.21,47,48
The XRD patterns of the developed films showed broad diffraction maxima within the range of 2θ ≈ 20–21°. This indicates the presence of semi-crystalline structures embedded within a predominantly amorphous polymer matrix. The observed peak represents the combined short-range molecular ordering of the polymer network rather than the crystalline response of the chitosan alone. The absence of sharp and intense diffraction peaks further confirms that the developed films did not possess a highly crystalline structure but were mainly composed of amorphous domains with limited ordered regions. The shift in the peak position among the samples indicates that different drying conditions might have influenced the molecular packing and the inter-chain spacing of the films. The highest crystallinity of the CP4 samples suggest that hot-air oven drying promoted the formation of more ordered regions in the polymer matrix. The lower d-spacing of CP4 further indicates the close chain packing that might have improved the intermolecular interactions and restricted chain mobility under tensile strength. This structural arrangement is consistent with the mechanical results where CP4 sample showed the highest tensile strength among all the samples. The CP3 sample showed the lowest crystallinity value of 24.6%. This shows the presence of large fraction of amorphous region. Although CP3 sample showed the lowest crystallinity value but the tensile strength of CP3 sample was higher than CP1 and CP2 sample. In some polymer-protein films, hydrogen bonding does not produce crystalline regions unless the chains are arranged in a regular and periodic manner. Hydrogen bonds could also be present within the amorphous domains where they act as physical interaction point and improve the stress transfer during tensile loading. Thus, the higher tensile value of CP3 sample might be related to stronger non-periodic intermolecular interactions, better compatibility between polymers, and fewer structural defects in the amorphous phase rather than to increased crystallinity. In contrast, the CP4 sample showed both highest crystallinity and highest tensile value. This suggest that in CP4 sample closer chain packing and a higher ordered fraction might have contributed more directly to the mechanical reinforcement. Similar finding have been documented in the previous literature where the chitosan and soy protein showed characteristic semi-crystallinity peak at approximately 20°.21
The FTIR spectra indicate that all CP films retained the major functional groups of the film-forming materials. However, the differences in the band broadness and relative intensity among CP1-CP4 suggest changes in the molecular environment of the polymeric network. The broad O-H/N-H band around 3373 cm-1 suggest extensive intermolecular hydrogen bonding among chitosan,49 soy protein,21 and glycerol. The slight changes in the shape and intensity of this region among the treatments might reflect variation in hydrogen-bond formation caused by different drying conditions that could influence polymer chain packing and water/glycerol retention within the film matrix.21 The C-H stretching bands at 2922 cm-1 and 2870 cm-1 showed qualitative intensity differences among the films. This indicates variation in the exposure or distribution of hydrophobic oil components within the polymer matrix. The Amide II band at 1546 cm-1 confirms the contribution of soy protein and chitosan amino groups. However, the change in this band region might be attributed to the interactions between protein amide groups and chitosan through hydrogen bonding and electrostatic interactions. Similarly, the band at 1031 cm-1 suggest that the glycosidic C-O-C and C-O bonds of chitosan remained present in all films but changes in the fingerprint region suggest modification of the local vibrational environment of polysaccharide chains. The absence of new absorption bands indicates that no major new covalent bonds were formed during film fabrication. Thus, the improved integration of film components could be likely due to non-covalent interactions, mainly hydrogen bonding, protein-polysaccharide interactions, and hydrophobic associations that involves oil phase.
The TGA and DTG results together confirmed that the developed films degraded through moisture evaporation, polymer-matrix degradation, and final carbonaceous-residue decomposition. The first degradation could be attributed to the loss of free and bound water from the hydrophilic chitosan-soy protein matrix which is consistent with the known water affinity of the polysaccharide-based films.50,51 The apparent onset of the main degradation stage was approximately 150°C for all the films. This indicates that the drying method affected the degradation intensity, residual mass, and DTG peak sharpness rather than the initial onset of polymer decomposition. The second stage was assigned to decarboxylation, depolymerization, glycosyl decomposition, glycerol-related volatilization/degradation, and breakdown of the chitosan-soy protein network. Previous studies reported that the chitosan degradation mainly around 220-320°C and soy protein/glycerol film degradation through glycerol-related loss at 130-280°C followed by the soy protein backbone decomposition at 280-420°C. Recent studies reported that glycerol-loaded chitosan films show glycerol related degradation before the main chitosan decomposition stage, while chitosan depolymerization and decomposition commonly occur in the range of approximately 228-350°C.50Similarly, chitosan and protein-based films have shown mass loss linked with low-molecular weight proteins, glycerol elimination, and chitosan-chain degradation with the DTG degradation peaks around 281-288°C.51The third stage represented the decomposition of carbonaceous residues where the higher final residue of CP2 sample suggested a greater char-forming tendency or slower terminal degradation under vacuum drying. degradation under vacuum drying. The sharper DTG peaks observed in both CP3 and CP4 sample indicates a higher apparent degradation rate within a narrower temperature interval, whereas the broader DTG peak of CP1 suggests slower and more distributed degradation.
The increase in WCA from CP1 to CP4 sample suggests that the drying conditions influenced the surface properties of the developed films. Chitosan and protein-based films contain several polar groups such as hydroxyl groups, amino, and carbonyl groups that promote water interaction and usually results in hydrophilic surfaces.52,53 The lowest WCA value of CP1 sample shows that the sun-drying produced the most hydrophilic surface among all the samples. This could be due to non-uniform solvent evaporation under fluctuating temperature and humidity. However, the CP4 sample showed the highest WCA value. This indicates a comparatively less hydrophilic surface. The hot-air oven drying might have promoted faster and more uniform water removal, greater chain packing, and improved the surface compactness. The WCA result supports the WVTR and WVP findings. The CP1 showed the lowest WCA and highest WVTR and WVP values. This suggests its weak resistance to water interaction and water vapor transmission. However, the CP4 showed highest WCA and lowest WVTR and WVP values, indicating improved surface water resistance and better water vapor barrier properties.
The variation in WVTR and WVP among the developed films might be attributed to the effect of different drying conditions on the film’s properties such as compactness, molecular packing, and water vapor diffusion pathways. Biopolymer films based on chitosan and protein usually composed of hydrophilic functional groups such as hydroxyl, amino, and carbonyl groups that can interact with water molecules and influence the transmission of water vapors through the film matrix. The CP1 showed the highest WVTR and WVP that suggest that the sun drying might have produced a relatively less compact or more heterogeneous film structure. The fluctuation of temperature and humidity during sun-drying might have caused non-uniform solvent evaporation. This results in less organized polymer-chain packing and easier water vapor diffusion through the matrix. The CP4 sample showed the lowest WVTR and WVP. This shows that the hot-air oven drying might have improved the water vapor barrier properties of the developed films. This could be due to the closed molecular packing, reduction in free volume, and a more tortuous pathway for water vapor movement. Similar finding has been documented in the previous literature for protein-lipid emulsion films where the increased drying temperature have reduced the WVP.54 A chitosan-based study also reported that the films dried at elevated temperature showed lower WVP and improved physical and mechanical properties. The WVP results were consistent with the WVTR results. The film with higher WVTR also generally shows higher WVP. The CP1 sample showed highest WVTR and WVP values this shows its weak water barrier properties. In contrast, the CP4 sample showed lowest WVTR and WVP values that indicates it good water barrier properties.
The highest ABTS radical scavenging activity was observed in CP2 and CP3 samples. This could be attributed to better retention and dispersion of antioxidant compounds within the film matrix. Since all the formulation were same the observed variations might have been associated with different drying method. The radical scavenging activity of the developed films might be due to the combined contribution of marjoram oil, soy protein, and chitosan. The marjoram essential oil has been reported to possess antiradical and lipid oxidation inhibitory activity.55 Furthermore, the soybean protein hydrolysates also contain antioxidant peptides that are capable of scavenging free radicals.56 The chitosan might also contribute to antioxidant activity through its hydroxyl and amino groups. However, the radical scavenging activity of chitosan depends on the molecular weight, degree of deacetylation, and film matrix interactions.57 The vacuum drying and room temperature-based drying might have decreased the loss of volatile and heat-sensitive antioxidant constituents, whereas sun drying and hot-air oven-based drying might have caused the partial degradation or volatilizationof the active compounds.58 Thus, the ABTS results indicate that vacuum and room temperature-based drying were more effective in retaining the antioxidant potential of developed films.
The CP2 sample showed the highest DPPH scavenging activity. However, the absence of significant difference among all the samples suggests that the drying method did not affect the DPPH-based antioxidant activity of the developed films. This could be due to the similar formulation of all the samples that provided comparable amount of radical-scavenging components. The slight increase of antioxidant activity in CP2 samples indicates better retention of antioxidant compounds under vacuum drying. However, the effect was not strong enough to produce a statistically significant difference. When comparing both ABTS and DPPH assay, the DPPH assay might be less responsive in the developed films because DPPH is more limited by solvent compatibility, radical accessibility, and diffusion of antioxidant compounds from the film matrix. In contrast, ABTS is generally more applicable to both hydrophilic and lipophilic antioxidants and could be more sensitive in complex food and packaging matrices.Palavouzi et al. (2025) reported that the antioxidant activity of high-methoxy pectin-tomato paste films decreased as the drying temperature increased.59 Rodríguez et al. (2020) reported that papaya-based films loaded with Moringa oleifera and ascorbic acid dried at room-temperature, dehydrator drying, and oven drying did not show any significant difference.60
Conclusion
In conclusion, this study demonstrated that drying conditions significantly influenced the physicochemical, structural, mechanical, barrier, optical, and antioxidant properties of chitosan/soy protein acid hydrolysate biocomposite films loaded with marjoram essential oil. Since all the films were prepared by using the same formulation, the observed variations were mainly associated with drying-induced difference in solvent evaporation rate, polymer-chain rearrangement, molecular packing, crystallinity, surface hydrophobicity, and distribution of hydrophobic components within the film matrix. Among the drying methods, hot-air oven drying produced films with the highest tensile strength, highest crystallinity, smallest d-spacing, highest water contact angle, and lowest water barrier properties. These findings show that controlled hot air drying promoted the formation of close molecular packing, improved chain organization, reduced water vapor diffusion pathways, and improved the mechanical and barrier performance of the films. However, the room-temperature drying resulted in films with the lowest crystallinity but relatively good tensile strength. The vacuum drying produced films with favorable optical properties and improved flexibility. The antioxidant results showed that the room-temperature and vacuum drying were more favorable for retaining radical scavenging activity, whereas hot-air drying improved the structural and barrier properties of the films. The findings show that drying conditions play an important role in tailoring the functional performance of chitosan/soy protein acid hydrolysate films loaded with marjoram essential oil. However, the direct experimental evidence for polymer-chain rearrangement, oil migration, molecular packing, and specific intermolecular interactions were not evaluated. Additionally, the post-drying GC-MS analysis, retention assessment, phenolic quantification, quantitative SEM image analysis were not performed. Thus, the proposed mechanisms should be considered tentative, and further studies are need to confirm these structural and chemical changes along with the antimicrobial performance, release kinetics, storage stability, and real-time food packaging applications.
Acknowledgement
The Authors are thankful to the Natural and Medical Sciences Research Center, University of Nizwa, Oman, for providing research facilities to conduct the current study.
Funding Sources
The author(s) received no financial support for the research, authorship, and/or publication of this article.
Conflicts of Interest
The author(s) do not have any conflict of interest.
Data Availability Statement
Available from the corresponding author upon request.
Ethics Statement
This research did not involve human participants, animal subjects, or any material that requires ethical approval.
Informed Consent Statement
This study did not involve human participants, and therefore, informed consent was not required.
Clinical Trial Registration
This research does not involve any clinical trials.
Permission to Reproduce Material from Other Sources
Not Applicable.
Author Contributions
- Saurabh Bhatia: Conceptualization, Supervision, Project Administration, Critical review, and Editing of Manuscript.
- TalhaShireen Khan: Literature search, Data Collection, Original Draft Preparation, Manuscript Writing, Table Preparation, and Revision of Manuscript.
- Yasir Abbas Shah: Literature review, Data organization, Validation of Scientific Content, and Manuscript Editing.
- Ahmed Al-Harrasi: Supervision, Project Administration, Resources, Critical review.
References
- Lalrinfela P, Vanlalsangi R, Lalrinzuali K, Babu PJ. Microplastics: Their effects on the environment, human health, and plant ecosystems. Environmental Pollution and Management. 2024/10/01/ 2024;1:248-259. doi:https://doi.org/10.1016/j.epm.2024.11.004
CrossRef - Pilapitiya PNT, Ratnayake AS. The world of plastic waste: A review. Cleaner Materials. 2024;11:100220.
CrossRef - Babaremu K, Oladijo OP, Akinlabi E. Biopolymers: A suitable replacement for plastics in product packaging. Advanced Industrial and Engineering Polymer Research. 2023;6(4):333-340.
CrossRef - Alnadari F, Al-Dalali S, Nasiru MM, et al. A new natural drying method for food packaging and preservation using biopolymer-based dehydration film. Food Chemistry. 2023;404:134689.
CrossRef - Pereira VA, de Arruda INQ, Stefani R. Active chitosan/PVA films with anthocyanins from Brassica oleraceae (Red Cabbage) as Time–Temperature Indicators for application in intelligent food packaging. Food Hydrocolloids. 2015/01/01/ 2015;43:180-188. doi:https://doi.org/10.1016/j.foodhyd.2014.05.014
CrossRef - Nilsen‐Nygaard J, Fernández EN, Radusin T, et al. Current status of biobased and biodegradable food packaging materials: Impact on food quality and effect of innovative processing technologies. Comprehensive reviews in food science and food safety. 2021;20(2):1333-1380.
CrossRef - Pawase PA, Rout S, Tripathy S, et al. Recent advances in cellulose, chitosan, and protein-based edible films for sustainable food packaging: a comprehensive review. International Journal of Biological Macromolecules. 2025:146172.
CrossRef - Qin J, Xiao M, Wang S, Peng C, Wu X, Jiang F. Effect of drying temperature on microstructural, mechanical, and water barrier properties of konjac glucomannan/agar film produced at industrial scale. LWT. 2023/01/01/ 2023;173:114275. doi:https://doi.org/10.1016/j.lwt.2022.114275
CrossRef - Velaga SP, Nikjoo D, Vuddanda PR. Experimental Studies and Modeling of the Drying Kinetics of Multicomponent Polymer Films. AAPS PharmSciTech. 2018/01/01 2018;19(1):425-435. doi:10.1208/s12249-017-0836-8
CrossRef - Kivilcim FN. Heat Treatment Impacts on Film Morphology in Biaxially Oriented Polypropylene Films. Food Sci Nutr. Jun 2025;13(6):e70458. doi:10.1002/fsn3.70458
CrossRef - Boy R, Maness C, Kotek R. Properties of chitosan/soy protein blended films with added plasticizing agent as a function of solvent type at acidic pH. International Journal of Polymeric Materials and Polymeric Biomaterials. 2016;65(1):11-17.
CrossRef - Fabiano A, Beconcini D, Migone C, Piras AM, Zambito Y. Quaternary Ammonium Chitosans: The Importance of the Positive Fixed Charge of the Drug Delivery Systems. International Journal of Molecular Sciences. 2020;21(18):6617.
CrossRef - Schmid E-M, Farahnaky A, Adhikari B, Savadkoohi S, Torley PJ. Investigation into the physiochemical properties of soy protein isolate and concentrate powders from different manufacturers. International Journal of Food Science and Technology. 2024;59(3):1679-1693. doi:10.1111/ijfs.16923
CrossRef - Li X, Hu C, Zhang H, Han L, Zhang W, He J. Soy protein isolate-chitosan complex condensate: Phase behavior, structure and functional properties. Food Chemistry: X. 2025;27:102372.
CrossRef - Sharma S, Barkauskaite S, Jaiswal AK, Jaiswal S. Essential oils as additives in active food packaging. Food Chemistry. 2021/05/01/ 2021;343:128403. doi:https://doi.org/10.1016/j.foodchem.2020.128403
CrossRef - Deans S, Svoboda KP. The antimicrobial properties of marjoram (Origanum majorana L.) volatile oil. Flavour and fragrance journal. 1990;5(3):187-190.
CrossRef - 182.20 Essential oils, oleoresins (solvent-free), and natural extractives (including distillates). https://www.ecfr.gov/current/title-21/section-182.20
- MARJORAM, SWEET, OIL (MAJORANA HORTENSIS MOENCH (ORIGANUM MAJORANA L.)). https://www.hfpappexternal. fda.gov/scripts/ fdcc/index.cfm?set=FoodSubstances&id=MARJORAMSWEETOILMAJORANAHORTENSISMOENCHORIGANUMMAJORANA
- Tripathy B, Satyanarayana S, Khan KA, Raja K. An updated review on traditional uses, taxonomy, phytochemistry, pharmacology and toxicology of Origanum majorana. International Journal of Pharma Research and Health Sciences. 2017;5(4):1717-23.
- Ennaji H, Chahid D, Aitssi S, et al. Phytochemicals screening, cytotoxicity and antioxidant activity of the Origanum majorana growing in Casablanca, Morocco. Open Biol Sci J. 2020;5:053-059.
CrossRef - Li K, Jin S, Liu X, Chen H, He J, Li J. Preparation and Characterization of Chitosan/Soy Protein Isolate Nanocomposite Film Reinforced by Cu Nanoclusters. Polymers. 2017;9(7):247.
CrossRef - Li C, Wu K, Su Y, Riffat SB, Ni X, Jiang F. Effect of drying temperature on structural and thermomechanical properties of konjac glucomannan-zein blend films. Int J Biol Macromol. Oct 1 2019;138:135-143. doi:10.1016/j.ijbiomac.2019.07.007
CrossRef - Mayachiew P, Devahastin S. Effects of drying methods and conditions on release characteristics of edible chitosan films enriched with Indian gooseberry extract. Food Chemistry. 2010/02/01/ 2010;118(3):594-601. doi:https://doi.org/10.1016/j.foodchem.2009.05.027
CrossRef - Re R, Pellegrini N, Proteggente A, Pannala A, Yang M, Rice-Evans C. Antioxidant activity applying an improved ABTS radical cation decolorization assay. Free radical biology and medicine. 1999;26(9-10):1231-1237.
CrossRef - Brand-Williams W, Cuvelier M, Berset C. Antioxidative activity of phenolic composition of commercial extracts of sage and rosemary. Lwt. 1995;28:25-30.
CrossRef - Al-Lami HS, Ali Abdullah B, Hikmet Mutasher S. Thermal and optical properties of characterized plasticized chitosan films. Journal of Umm Al-Qura University for Applied Sciences. 2025:1-11.
CrossRef - Qin Z, Mo L, Liao M, He H, Sun J. Preparation and characterization of soy protein isolate-based nanocomposite films with cellulose nanofibers and nano-silica via silane grafting. Polymers. 2019;11(11):1835.
CrossRef - Kozarski M, Klaus A, Nikšić M, van Griensven L, Vrvić MM, Jakovljević D. Polysaccharides of higher fungi: Biological role, structure and antioxidative activity. Hemijska industrija. 2014;68(3):305-320.
CrossRef - Mekonnen KD. Fourier transform infrared spectroscopy as a tool for identifying the unique characteristic bands of lipid in oilseed components: Confirmed via Ethiopian indigenous desert date fruit. Heliyon. 2023;9(4)
CrossRef - Islam S, Arnold L, Padhye R. Comparison and Characterisation of Regenerated Chitosan from 1‐Butyl‐3‐methylimidazolium Chloride and Chitosan from Crab Shells. BioMed Research International. 2015;2015(1):874316.
CrossRef - Noriega SE, Subramanian A. Consequences of Neutralization on the Proliferation and Cytoskeletal Organization of Chondrocytes on Chitosan‐Based Matrices. International Journal of Carbohydrate Chemistry. 2011;2011(1):809743.
CrossRef - Kaith BS, Bhatia JK, Dhiman J, et al. Synthesis and optimization of soy protein fiber based graft copolymer through response surface methodology for removal of oil spillage. Polymer bulletin. 2013;70(11):3155-3169.
CrossRef - Lee J-S, Lee E-s, Han J. Enhancement of the water-resistance properties of an edible film prepared from mung bean starch via the incorporation of sunflower seed oil. Scientific reports. 2020;10(1):13622.
CrossRef - Chadha J, Khullar L, Mudgil U, Harjai K. A comprehensive review on the pharmacological prospects of Terpinen-4-ol: from nature to medicine and beyond. Fitoterapia. 2024;176:106051.
CrossRef - Gupta P, Phulara S. Chapter 3—Terpenoids: Types and their application. Biotechnology of Terpenoid Production from Microbial Cell Factories. 2021:47-78.
CrossRef - Baginska S, Golonko A, Swislocka R, Lewandowski W. Monoterpenes as medicinal agents: Exploring the pharmaceutical potential of p-cymene, p-cymenene, and γ-terpinene. Acta Pol Pharm—Drug Res. 2023;80:879-892.
CrossRef - Pereira I, Severino P, Santos AC, Silva AM, Souto EB. Linalool bioactive properties and potential applicability in drug delivery systems. Colloids and Surfaces B: Biointerfaces. 2018;171:566-578.
CrossRef - Wang Z, Zhang R, Yang Q, et al. Recent advances in the biosynthesis of isoprenoids in engineered Saccharomyces cerevisiae. Advances in Applied Microbiology. 2021;114:1-35.
CrossRef - Elkousy RH, Mostafa NM, Abd-Alkhalek AM, et al. GC/MS analysis and potential synergistic effect of mandarin and marjoram oils on Helicobacter pylori. Journal of Enzyme Inhibition and Medicinal Chemistry. 2022;37(1):1610-1619.
CrossRef - Shi B, Hao Z, Jia M, Xie S. Mechanical and barrier properties of chitosan-based composite film as food packaging: A review. BioResources. 2024;19(2):4001.
CrossRef - Li C, Wu K, Su Y, Riffat SB, Ni X, Jiang F. Effect of drying temperature on structural and thermomechanical properties of konjac glucomannan-zein blend films. International Journal of Biological Macromolecules. 2019/10/01/ 2019;138:135-143. doi:https://doi.org/10.1016/j.ijbiomac.2019.07.007
CrossRef - Ly BCK, Dyer EB, Feig JL, Chien AL, Del Bino S. Research techniques made simple: cutaneous colorimetry: a reliable technique for objective skin color measurement. Journal of Investigative Dermatology. 2020;140(1):3-12. e1.
CrossRef - Denavi GA, Pérez-Mateos M, Añón MC, Montero P, Mauri AN, Gómez-Guillén MC. Structural and functional properties of soy protein isolate and cod gelatin blend films. Food Hydrocolloids. 2009/12/01/ 2009;23(8):2094-2101. doi:https://doi.org/10.1016/j.foodhyd.2009.03.007
CrossRef - Rhim JW, Gennadios A, Handa A, Weller CL, Hanna MA. Solubility, tensile, and color properties of modified soy protein isolate films. Journal of Agricultural and Food Chemistry. 2000;48(10):4937-4941.
CrossRef - Chaudhary N, Mishra G, Yadav T, Srivastava N, Maurya VK, Saxena SK. Fabrication and evaluation of basil essential oil-loaded halloysite nanotubes in chitosan nanocomposite film and its application in food packaging. Antibiotics. 2022;11(12):1820.
CrossRef - Zhang N, Liu H, Yu L, et al. Developing gelatin–starch blends for use as capsule materials. Carbohydrate polymers. 2013;92(1):455-461.
CrossRef - Oliveira VRL, Monteiro M, Santos F, Leite R, Aroucha E. Effect of drying temperature in biopolymeric films of cassava starch and its effect on wettability, water vapor barrier and mechanical properties. Trans Tech Publ; 2018:270-275.
CrossRef - Pereira dos Santos E, Nicácio PHM, Coêlho Barbosa F, et al. Chitosan/essential oils formulations for potential use as wound dressing: Physical and antimicrobial properties. Materials. 2019;12(14):2223.
CrossRef - Kumirska J, Czerwicka M, Kaczyński Z, et al. Application of Spectroscopic Methods for Structural Analysis of Chitin and Chitosan. Marine Drugs. 2010;8(5):1567-1636.
CrossRef - Muñoz-Núñez C, Gómez-Fernández N, Muñoz-Bonilla A, Fernández-García M. Chemical Modification of Chitosan with Bioactive Molecules: A Sustainable Approach for Advanced Film Development. International Journal of Molecular Sciences. 2025;26(21):10403.
CrossRef - Chand AB, Joshi RD, K.C A, et al. Enhancing chitosan-zein films with Bergenia ciliata extracts toward smart food packaging. Journal of Food Science and Technology. 2025/08/12 2025;doi:10.1007/s13197-025-06413-w
CrossRef - Acquah C, Zhang Y, Dubé MA, Udenigwe CC. Formation and characterization of protein-based films from yellow pea (Pisum sativum) protein isolate and concentrate for edible applications. Current Research in Food Science. 2020;2:61-69.
CrossRef - Plota-Pietrzak A, Pesko M, Fotiadou R, Pavlidis IV, Masek A. Strategies in chitin and chitosan functionalization–From the production of defined oligos to the synthesis of blends. Sustainable Materials and Technologies. 2025:e01543.
CrossRef - Perez-Gago MB, Krochta JM. Drying temperature effect on water vapor permeability and mechanical properties of whey protein− lipid emulsion films. Journal of Agricultural and Food Chemistry. 2000;48(7):2687-2692.
CrossRef - Badee A, Moawad R, ElNoketi M, Gouda M. Antioxidant and antimicrobial activities of marjoram (Origanum majorana L.) essential oil. 2013;
- Abu-Salem FM, Mahmoud MH, El-Kalyoub M, Gibriel A, Abou-Arab A. Characterization of antioxidant peptides of soybean protein hydrolysate. World Academy of Science, Engineering and Technology. 2013;79(7):249-253.
- Hromiš NM, Lazić VL, Popović SZ, Šuput DZ, Bulut SN. Antioxidative activity of chitosan and chitosan based biopolymer film. Food and Feed research. 2017;44(2):91-100-91-100.
CrossRef - Ping H, Ge Y, Liu W, Yang J, Zhong Z, Wang J. Effects of Different Drying Methods on Volatile Flavor Compounds in Idesia Polycarpa Maxim Fruit and Oil. Molecules. Feb 10 2025;30(4)doi:10.3390/molecules30040811
CrossRef - Palavouzi G, Oikonomidis C, Zioga M, Pappas C, Evageliou V. High Methoxyl Pectin–Tomato Paste Edible Films Formed Under Different Drying Temperatures. Polysaccharides. 2025;6(3):55.
CrossRef - Rodríguez G, Sibaja J, Espitia P, Otoni C. Antioxidant active packaging based on papaya edible films incorporated with Moringa oleifera and ascorbic acid for food preservation. Food Hydrocolloids. 12/01 2019;103:105630. doi:10.1016/j.foodhyd.2019.105630
CrossRef
 PlumX:
 Views: 945
  PDF Downloads:
128
PDF Downloads:
128 
Accepted on: 16 Jun 2026
Second Review by: Narisa Rueangsri
Final Approval by: Dr. Cheng Lai Hoong





Web of Science Coverage
Emerging Sources Citation Index (ESCI)
2024 Journal Impact Factor: 1.1
Scopus Journal Metrics
CiteScore 2025: 2.6
CiteScore Details
Sustainable Nutrition: Food Systems, Nutrient Retention, and Public Health Impact

This journal is a member of, and subscribes to the principles of, the Committee on Publication Ethics (COPE)