Administration of a Food Frequency Questionnaire to Elicit the Dietary Advanced Glycation End Product Consumption of Obese Adolescents aged 10-19 Years in a Tertiary Care Hospital
 , Arambakkam Janardhanam Hemamalini1* and Sarala Premkumar2
 1Department of Clinical Nutrition, Sri Ramachandra Faculty of Allied Health Sciences, Sri Ramachandra Institute of Higher Education and Research, Chennai, India.
2Department of Paediatrics, Sri Ramachandra Institute of Higher Education and Research, Chennai, India.
Corresponding Author Email:hemamalini.aj@sriramachandra.edu.in
DOI : http://dx.doi.org/10.12944/CRNFSJ.13.3.23
Download this article as:
![]()
Dietary Advanced glycation end products are compounds formed by a non-enzymatic reaction between reactive carbonyls and proteins which occur during the thermal processing of foods contributing to the pathogenesis of metabolic diseases. Adolescents are the primary consumers of dietary AGE due to the excessive consumption of junk and processed foods. This study aimed to quantify the dietary AGE consumption among obese adolescents in the age group of 10-19 years by employing a validated FFQ. Fifty obese adolescents with a BMI (≥27kg/m2) without any comorbidities were recruited in the study. A previously validated food frequency questionnaire was employed to determine the AGE content among the adolescents. The mean age of the participants was 14±2.7years, the mean weight was 75.5 ±9.49kg, the mean height was 155.5± 10.2cm and the mean BMI was 30± 1.87kg/m2. Ninety-eight percent of the study participants belonged to the upper-lower-income category. 51% of adolescents had a daily consumption of packaged foods namely Biscuits, Maggi, Chocolate, Chips, Pasta, Noodles, Cereals, and Butter. Ice cream was the most frequently consumed item. The daily mean Dage intake among obese adolescents was 18,647.5 ±2826 KU. Majority of the adolescents belonged to the low dietary AGE intake quartile (16,605.5KU) which surpassed the daily mean AGE intake (15,000KU) among adults. A significant correlation (p-value <0.05) between moderate and high Dage quartile and BMI-for-Age was observed. Out of 54 food items, 19 food items showed a significant correlation with either BMI-for-age or waist-to-hip ratio. Obese Adolescents had a high daily AGE intake, with an enormous consumption of junk and processed foods thereby putting them at risk of developing metabolic complications in the future.
KEYWORDS:Adolescents; Dietary advanced glycation end products; Junk foods; Maillard reaction; Obesity
Introduction
Adolescence is a transitioning period that witnesses enormous changes three-dimensionally including physical, psychological, and social evolution. The WHO defines adolescence as a unique stage of life between childhood and adulthood in the age group of 10-19 years.1 Alarming increases in the prevalence of adolescent obesity are observed worldwide. In the year 2022, the global prevalence rate of obesity among children aged 5-19 years was reported to be about 8% (160 million).2 In contrast, India estimated a 19.3% prevalence rate of overweight and obesity among children and adolescents.3 The etiological factors involved in the rise of an epidemic wave of obesity are multifactorial, one of which comprises of the erroneous dietary patterns of adolescents and their exposure to high AGE foods. Advanced glycation end products (AGE) are compounds that are formed as a result of the Maillard reaction, which encompasses foods formed by the amalgamation of protein and fat along with sugar to produce dietary AGE (dAGE). These dietary AGEs are exogenous sources of AGE which contribute to the progression of AGE pool in the body exerting a noxious effect in the development of various metabolic complications such as Diabetes mellitus, Cardiovascular disease, Obesity, and Hypertension.4
Dietary AGEs are primarily formed when processed and saturated fat-rich foods are subjected to exorbitant heating methods of cooking including frying, grilling, baking, BBQ etc. Animal meat such as beef, mutton, chicken, fish, eggs along with baked goods like bread, biscuits, and packaged foods contain the highest content of dietary AGE compared to fruits, vegetables, and legumes which have low AGE Levels.5 The dietary patterns of adolescents have an increased consumption of high fat, salt, and sugar foods (HFSS) thereby exacerbating the accumulation of AGE into the tissues and hence causing chronic diseases or metabolic dysfunctions.6
Numerous studies have highlighted the daily dietary AGE intake among adults irrespective of their age and metabolic status. Jara et al, exhibited the daily AGE intake among healthy adults to be 22,644 KU AGE/day.7 Uribarri et al, estimated the dietary AGE values of older adults (>60 years) to be approximately 12,500 KU AGE/day.8 In contrast, the daily AGE intake among adults diagnosed with type-II Diabetes mellitus was in the range of 9,000-13,000KU AGE/day.9 Therefore, the daily mean AGE intake across the adult population was computed to be 15,000KU AGE/day.10
Exemplary research has been done in the context of dietary AGE and its negative effects on the metabolic status of humans as well as animals. Cai et al, observed that mice administered with a high AGE diet developed insulin resistance, which sustained for four generations.11 Another study done on diabetes-induced-mice administered with a high AGE diet showed elevated levels of TNFα, IL-6, ROS, LDL, and serum AGE levels, whereas, normal mice (without comorbidities) demonstrated similar changes after consuming a high AGE diet.12
In humans, research has found a significant relationship between a high AGE meal and markers of metabolic stress. Consumption of a high AGE diet increases the plasma levels of IL-1, TNFα, Hba1C, LDL, Glycated LDL, and serum AGEs.13
Thus, Advanced glycation end products are an emerging area of interest and can be considered as a “new indicator of risk” for the occurrence of metabolic syndrome among individuals.14 Evaluating the Dage content of adolescents is crucial to improve their nutritional status as well as mitigate the harmful effects of this glycated compound on the vulnerable population of our country.
Food frequency questionnaires are the most widely used dietary tools for assessing the consumption patterns of different communities.15 A previously validated food frequency questionnaire was administered in this study to gauge the dietary AGE content among obese adolescents.16
While there are numerous studies illustrating the link between high dietary AGE intake and metabolic dysfunctions among adults, there is a dearth of information about the harmful effects of AGE on the adolescent population. Hence, this study aims to determine the Dage consumption levels through the administration of a previously validated food frequency questionnaire among obese adolescents aged 10-19 years visiting the outpatient department of a tertiary care hospital.
Materials and Methods
Participants
This study recruited Obese adolescents in the age group of 10-19 years attending the pediatric endocrinology outpatient department. Permission for the study was obtained from the Institutional Ethics Committee. (IEC-NI/22/APR/82/45). The parents were informed about the study and written informed consent and assent consent were obtained from the parents and adolescents respectively.
The sample size of the study was calculated, based on the rule of thumb. It stated that a minimum of 30 participants should be recruited in a study for assessing a parameter.17 Hence, in this study the sample size was kept at 50 for obtaining greater precision and accuracy in results. Also, since there was no previous data regarding the Mean dietary AGE value in the Adolescent population, the above-mentioned technique was used to calculate the sample size. The inclusion criteria for the selection of the participants were as follows- 1. Adolescents in the age group of 10-19 years 2. Adolescents with a BMI ≥27kg/m2.3 Adolescents not fulfilling any of the metabolic syndrome parameters i.e. Cholesterol, Hypertension, Diabetes Mellitus.4 Adolescents willing to participate in the study.
Demographic details of all the participants were obtained during the recruitment of the study by interviewing the adolescents regarding their Age, Gender, Anthropometry parameters, educational level, and socioeconomic status.
Anthropometry
The eligible participants were recruited and anthropometry measurements such as height, weight, BMI, waist circumference, Hip circumference, waist-to-hip ratio were measured. Height was measured with a portable stadiometer, positioning the participant barefoot in a straight arrangement aligning with the shoulder blades, buttocks, and heels touching the back of the stadiometer and the readings were read at the nearest 0.1cm. The weight of the participants was measured using a digital weighing scale by asking the subject to stand upright on the scale until the reading was measured to the nearest 0.01kg.18
Consequently, the Body mass index was calculated by the formula weight in kg divided by height in m2. Waist circumference was measured with the help of a measuring tape placed between the lowest margin of the palpable rib to the top of the iliac crest. Hip circumference was measured using the tape around the widest portion of the buttock region.19
Furthermore, Waist to hip ratio was calculated by dividing the waist (cm) by the hip (cm) value. IAP pediatric growth charts were used for plotting the BMI-for-age of the recruited participants.
Food Frequency Questionnaire
A previously developed and validated food frequency questionnaire was used in the current study to elicit the dietary AGE intake among the target population.16 Before the administration of the questionnaire a brief explanation was provided to the participants and their parents especially the mother for obtaining accurate information on the eating habits of adolescents. The food frequency questionnaire consisted of 54 food items categorized into six food groups- Fried Foods, Baked Foods, Grilled and BBQ Foods, Roasted Foods, Packaged foods, and miscellaneous foods along with frequencies ranging from Monthly, Weekly, Daily, and Never consumed. The quantity of the foods was classified based on Small (5-25g) Medium (30-50g), Large (60-80g), and Super large (≥100g).20 Standardized classification of portion sizes was employed to obtain accurate quantities of food consumed and for an easier understanding by the adolescents. Moreover, as per Fast food trends, manufacturers utilize these terms for quantifying junk and processed foods.21 Since, the questionnaire contained similar foods, the aforementioned quantities were employed in this study. The subjects were shown images representative of these quantities (For Example: French fries- small). Other foods were estimated for portion sizes by using standardized measuring cups and spoons.
Quantifying AGE Content in Foods
A previously published database consisting of 549 food items was used to evaluate the Dage content of the adolescents.22
The AGE was calculated by multiplying the quantity of food consumed by the adolescent with the Dage value per 100g divided by 100. The obtained value was multiplied by the frequency of consumption to estimate the total AGE content consumed by the participant.
Since, the database is comprised mainly of international food items, certain foods such as Cutlet, Shawarma, and Pakoda which are Indian-based dishes, were not included in the AGE database. Hence, were replaced with similar foods with equivalent techniques of cooking. For example, Cutlet was replaced with hash browns, shawarma with roasted meat, and Pakoda with Nuggets.
Results
The mean age of the participants was 14±2.7years. Of the 50 respondents, 56% of the population were boys and 44% belonged to the female category. The mean weight of the adolescents was 75.5±9.49 kg. The mean height of the adolescents was 155.5±10.2 cm.
The mean BMI of the adolescents was 30 ±1.87 kg/m2. The educational qualification of the study participants was classified as Lower Primary age (6-10years) 8% (N=4) Upper Primary age (11-12 years) 24% (N=12) High School age (13-15 years) 36% (N=18) Higher Secondary age (16-18 years) 26% (N=13) and Under-Graduate age (>19 years) 6% (N=3). Table 1
Modified Kuppuswamy scale,2021 was used to obtain the socioeconomic status of the adolescents by evaluating the Education, Occupation, and Income of the head of the family of every participant. 58% (N=29) of the participant’s parents attended middle school, 18% (N=9) attended primary school, 8% (N=4) were illiterate and 16% (N=8) went to high school. 84% of the participant’s parents had an elementary occupation and 16% were plant and machine handlers. 82% had a family monthly income of around 6,175-18,496. 98% belonged to the upper lower category with a score between 5-10 and only 2% belonged to the lower socioeconomic status with a score less than 5.23 Table 2.
Table 1: Age and Anthropometry Indices of the Study Participants
|
Indices |
Males
Mean ±SD |
Females
Mean ±SD |
| Age (In years) | 13.5±2.45 |
14.4±2.97 |
|
Mean Height (cm) |
160.34±11.48 | 156.15±7.49 |
| Mean Weight (kg) | 76.65±9.79 |
74±9.11 |
|
Mean BMI (kg\m2) |
29.7±1.81 | 30.27±1.96 |
| Mean Waist Circumference (cm) | 92.3±3.69 |
91.5±3.62 |
|
Mean Hip circumference (cm) |
107.8±3.64 | 106.9±3.24 |
| Mean Waist to hip Ratio | 0.85±0.01 |
0.85±0.01 |
|
BMI for Age |
2.24±0.42 |
2.66±0.38 |
Table 2: Sociodemographic Information of the Study Participants
|
Variables |
N (%) |
|
Gender |
|
| Male |
28 (56%) |
| Female | 22 (44%) |
| The Educational level of the Participants | |
|
Lower Primary Age |
4 (8%) |
| Upper Primary Age |
12 (24%) |
|
High school Age |
18 (36%) |
| Higher Secondary Age |
13 (26%) |
|
Undergraduate |
3 (6%) |
|
The Educational level of the Head of the Family |
|
|
Middle school |
29 (58%) |
| Primary School |
9 (18%) |
|
Illiterate |
4 (8%) |
| High School |
8 (16%) |
|
Occupation of the Head of the family |
|
| Plant and Machine operators and assemblers |
8 (16%) |
|
Elementary Occupation |
42 (84%) |
|
Updated monthly Family Income (In Rupees) |
|
|
6,175-18,496 |
41 (82%) |
| ≤ 6174 |
9 (18%) |
|
Upper Lower |
49 (98%) |
| Lower |
1 (2%) |
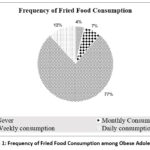 |
Figure 1: Frequency of Fried Food Consumption among Obese Adolescents |
Figure 1 illustrates that 77 % of the adolescents had a weekly consumption (two times/week) of fried foods. 12% of the adolescents had Daily consumption of fried foods. 7% of the adolescents had a monthly consumption and 4% had never consumed these foods. The most popular fried foods among the participants were Samosa, French fries, Bonda, Bread Pakoda, and Yam fry.
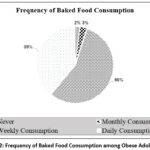 |
Figure 2: Frequency of Baked Food Consumption among Obese Adolescents |
Figure 2 represents 56% of the Weekly consumption of baked goods (2 times/week) among adolescents. 39% of the adolescents had a daily consumption of baked foods. Monthly consumption was calculated as 3% and only 2% of adolescents never consumed baked foods. Cake, bread, biscuits, and puff were the most common baked goods consumed by the participants.
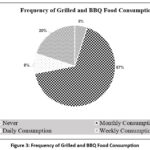 |
Figure 3: Frequency of Grilled and BBQ Food Consumption |
Figure 3- represents the frequency of grilled and BBQ food consumption among adolescents. Sixty-seven percent of the subjects had a monthly consumption of these high AGE foods. Five percent had not consumed these foods. And twenty percent of the obese adolescents had a weekly consumption. Eight percent reported a daily consumption of grilled and BBQ foods. Grill chicken was the most favorable food consumed by the participants.
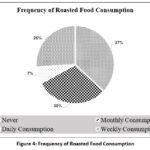 |
Figure 4: Frequency of Roasted Food Consumption |
Figure 4 illustrates the frequency of roasted food consumption among obese adolescents. 37% of the participants reported No consumption of these foods in comparison to the 30% of monthly consumers. Twenty-six percent of the adolescents had a weekly consumption and only seven percent reported a daily consumption of these foods.
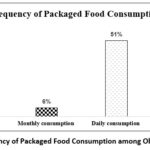 |
Figure 5: Frequency of Packaged Food Consumption among Obese Adolescents |
Figure 5 Represents the data on packaged food consumption among adolescents, wherein 51% of the participants had a daily consumption of packaged foods such as biscuits, Maggi, chocolate, chips, pasta, noodles, cereals, and butter. Among these, biscuits were widely consumed by the adolescents. 41% of the participants had a weekly consumption, 6% had a monthly consumption of packaged foods and 2% had no consumption.
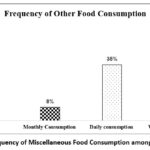 |
Figure 6: Frequency of Miscellaneous Food Consumption among the Subjects |
Figure 6- Elucidates the frequency of miscellaneous/ other foods consumed by the adolescents. 56% of the adolescents had a weekly consumption of other foods namely, ice cream, waffles, and aerated drinks. 35% had daily consumption and Eight percent of the subjects had a monthly consumption of these foods.
Table 3: Quartile Distribution of Dietary AGE Among Obese Adolescents
| Dietary AGE | Mean ±SD
(Kilounits) |
Subjects in each quartile
N (%) |
| Total Dage | 18,647.5±2826 | 50 (100%) |
| LOW | 16,605.5±843 | 25 (50%) |
| MODERATE | 18,622.8±912 | 13 (26%) |
| HIGH | 20,631.3±349 | 12 (24%) |
Table III Illustrates the quartile distribution of AGE such as Low, Moderate, and High AGE consumption. The Low AGE group with a Dage intake of 16,605.5±843KU had a larger number of subjects n=25 (50%), the Moderate group with a Dage intake of 18,622.8±912KU consisted of n=13 (26%) subjects, and the high AGE group with Dage intake of 20,631.3±349KU contained n=12 (24%) of obese adolescents. The mean total Dietary AGE intake was 18,647.5±2826 KU among the obese adolescents.
Table 4: Association between Quartiles of Dietary AGE and Obesity Parameters
| Obesity Parameters | Quartiles Of Dietary AGE | P value |
| Waist-To-Hip-Ratio | Low
(N=25) |
0.635 |
| Moderate
(N=13) |
0.237 | |
|
High (N=12) |
1.00 | |
| BMI-For-Age |
Low (N=25) |
0.241 |
| Moderate
(N=13) |
0.02* | |
|
High (N=12) |
0.03* |
*p-value:<0.05
Table 4 Examines the association of dietary AGE and Obese parameters namely, BMI-for-age and Waist-to-Hip Ratio. It was observed the moderate AGE and High AGE groups were found to have a significantly higher BMI-for-Age than their counterparts with lower consumption of dAGE.
Table 5: Correlation of High AGE Foods with Obesity Parameters
| FOOD ITEMS | BMI-FOR-AGE | WAIST-TO-HIP RATIO |
| FRIED FOODS | ||
| Samosa | 0.03* | 0.154 |
| French fries | 0.003* | 0.854 |
| Bread Pakoda | 0.001* | 0.531 |
| Yam fry | 0.149 | 0.02* |
| Bonda | 0.622 | 0.03* |
| BAKED FOODS | ||
| Bread | 0.625 | 0.01* |
| Cake | 0.01* | 0.718 |
| Biscuit | 0.03* | 0.525 |
| Puff | 0.01* | 0.487 |
| ROASTED FOODS | ||
| Roasted nuts | 0.125 | 0.431 |
| Roasted meat | 0.824 | 0.619 |
| Roasted papad | 0.548 | 0.237 |
| Grill and BBQ Foods | ||
| Grilled chicken | 0.227 | 0.189 |
| Grill vegetable | 0.409 | 0.346 |
| Grill sandwich | 0.627 | 0.549 |
| Grill paneer | 0.876 | 0.713 |
| Shawarma | 0.654 | 0.552 |
| BBQ Chicken | 0.274 | 0.145 |
| PACKAGED FOODS | ||
| Pasta | 0.538 | 0.02* |
| Chocolate | 0.03* | 0.092 |
| Chips | 0.001** | 0.589 |
| Noodles | 0.874 | 0.02* |
| Cereals | 0.01* | 0.429 |
| Butter | 0.714 | 0.01* |
| Maggi | 0.001** | 0.519 |
| OTHER FOODS | ||
| Ice cream | 0.01* | 0.618 |
| Waffles | 0.523 | 0.03* |
| Aerated drinks | 0.814 | 0.001** |
*- p-value <0.05
** p-value < 0.01.
Table V Illustrates the correlation of each high-AGE food item with the obesity parameters such as BMI for AGE and Waist-to-Hip ratio. Out of 54, 19 High AGE food items were found significant with either of the two parameters. The category of Packaged food had a greater number of food items which showed significance compared to the other culinary categories. Two categories- Roasted foods and Grilled & BBQ foods were non-significant with any of the obese parameters.
Discussion
The present study highlighted the enormous consumption of Dage-rich foods which can hinder the physiological and disrupt the metabolic health of adolescents leading them to the development of various chronic inflammatory conditions which can be difficult to amend once they set foot into adulthood.
The main contributor or the main evil was the rise in the establishment of “Food swamps”- an interesting term denoted by the WHO, stating a neighbourhood or area loaded with non-nutritional or highly processed food options in contrast to healthier alternatives,24 causing an increased supply of junk foods to the adolescents to fulfil their high caloric demands, therefore, paving the way for the development of Obesity among these adolescents.
The current study showed that 77% of adolescents every week consumed fried foods which was higher compared to the previous literature (47% two times a week).25
A Research study employed a Focused group discussion technique on adolescents to observe their perception of junk food, an anecdote from the study was illustrated where a boy weighing 70 kg responded with his fondness towards junk food especially Pizza and despite the restriction from his parents, he had the urge to eat the pizza quite frequently and thus, he did not belittle his desires.26 Such is the scenario with every adolescent who is aware of the negative effects of junk food yet consume it to fulfil their gustatory pleasure for the palate.
An Indian study reported weekly consumption of baked foods to be around 33% and daily consumption of 14%,27 whereas in our study the weekly consumption was 56% and 39% of daily consumption was observed among the subjects
The temperature and method of cooking play a significant role in the formation of AGE, with the golden rule that the higher the temperature higher the value of AGE, and the lower the moisture content higher the AGE formation.28 For instance, chicken breast steamed generates 1058KU of AGE in comparison with chicken breast grilled producing 4 times the value of AGE at 4859KU.12
Fast food chains with their convenient “On the Go meals have allured adolescents to tingle their tastebuds with the crunchy texture of grilled chicken and oven-tossed delicacies plunging them onto the AGE Pool and thereby increasing their chances of a metabolic disease.
The present study exhibits 67% of the monthly consumption of grilled foods and around 20% of the weekly consumption. Grilled chicken was the most widely consumed food item compared to the other meats. A previous prospective study indicated a significant correlation between grilled meat and obesity.29 The characteristics of red meat contain saturated fatty acids and high cholesterol both of which contribute to the development of obesity.30 Another interesting theory postulates that the gut microbiome releases an enterotype called Bacteroides thetaiotaomicron typically detected after the consumption of fat-rich diets, which is a potent obesity-inducing enterotype leading to the occurrence of metabolic disorders by accelerating lipid digestion and absorption.31
A study revealed that roasting is a healthier cooking method compared to frying, unless the temperature while roasting food does not exceed 150oC.32 Parallelly, a study done on roasted nuts revealed that subsequent to roasting, the CML levels (A type of Fluorescent AGE) increased by 50% and CEL by 120%, contributing to the formation of a detrimental AGE named ‘pyrralline’ (64%).33
In our study, Roasted chicken was the most favourable food among adolescents. Adolescents from Malaysia had similar attributes towards roasted chicken compared to roasted vegetables or seafood due to the umami taste of the meat.34
Global estimates of meat consumption among children were reported to be 59g/day.35 On the contrary, the current study determined the total consumption of each adolescent to be 75g/day. There was no explicit data in the literature regarding the frequency of roasted foods among adolescents whereas in our study, the frequency of weekly (26%) and monthly (30%) consumption of roasted foods was obtained.
In the current study, the adolescents demonstrated a marked preference for indulging in chocolates, chips, Maggi, and biscuits. A similar statistic was revealed in an Indian study where 22% of adolescents had a daily consumption of chocolates, 20% regarded Maggi as their favourite food, and 72% consumed biscuits daily.36 Another study stated a high consumption of packaged chips and ice cream among adolescents aged 13-16 years.37 Most of the studies reported the frequency of these packaged foods as daily, i.e. in line with the current study where, 51% of the adolescents had a daily consumption and 41% had a weekly consumption of packaged foods.
Many studies illustrated varied reasons by adolescents for opting for packaged foods including economically sustainable, easily accessible, and shorter cooking time. But the primary reason was influenced by the taste quotient.38
Ironically, a Nepal-based study superimposed taste over health considerations indicating that 75% of adolescents knew about the hazardous effects of junk food yet the consumption levels among this population were skyrocketing.39 Therefore, packaged foods were considered the most preferred category of food among adolescents for the T-factor (Taste Factor) despite the harmful effects incurred upon the body.
Carbonated beverages were the most favourable drink in the category of miscellaneous foods among adolescents. In the current study, 19% of adolescents had a daily consumption of Carbonated drinks and 6 % of weekly consumption was observed. In contrast, another study postulated a 49% of weekly consumption among adolescents.40 A study done on dietary patterns of adolescents exhibited 45% consumption of drinks containing carbon dioxide and were hypercaloric in nature, without the specifications of the frequency consumed and were considered as the most preferred drink along with all types of junk foods.41
Frozen treats such as ice cream were another preferred sugar-sweetened snack among the adolescents in the present study with a frequency of once a day. A research study demonstrated the link between once-a-day consumption of fast food and obesity associated with an increase in 234 KJ and an average weight gain of 0.72kg.42
A research study postulated a dietary AGE intake in a cohort of healthy adults to be 15,000KU AGE/day (15 AGE Eq\day).10 The present study obtained a mean dietary AGE intake of 18,647±2826 KU AGE\day (18 AGE Eq\day) which is higher than the previously mentioned levels. Further, the dietary AGE intake observed in the current study was employed to categorize them into quartiles representing low, moderate, and high dietary AGE levels among obese adolescents. It was interesting to note, that a greater number of the subjects belonged to the Low category of AGE consumption (16,000KU AGE/day). The low AGE intake according to this study had indeed crossed the normal threshold of AGE reported by previous literature indicating high consumption of dAGE among adolescents.
An Egyptian study done on diabetic obese and non-obese adults found a significant correlation between CML and obesity parameters namely, BMI and waist-to-hip ratio.43
An international study observed a positive association between dietary AGE intake and BMI along with other anthropometric measurements such as waist circumference and body adiposity index.44 Anthropometric indices such as BMI, Waist to hip ratio and waist circumference are markers of obesity development in human subjects. Hence, a high dietary AGE intake leads to high BMI thereby, accelerating the occurrence of obesity among the study subjects.
Food preservation techniques such as frying food were an age-old tradition followed to preserve food for a longer time, until research discovered the negative effects of frying food could lead to clogging of arteries and increasing the chances of developing a metabolic disease. A novel study found an association between high consumption of fried foods (>four times a week) influenced the genetic portfolio related to obesity, thereby indicating a linear relationship between the two.45 In the current study, five fried food items had a significant association with BMI and Waist-to-hip ratio, indicating an accelerated response towards the development of obesity.
Food contaminants produced as a byproduct of the thermal conduction of foods such as frying and baking with temperatures rising above 1200 C, lead to numerous human health risks.46 Acrylamide is one such food contaminant formed by reducing carbohydrates and protein producing a Maillard reaction which is a precursor to AGE formation.47 Acrylamide is popularly found in bakery products such as bread, biscuits, cake etc causing negative effects namely- central and peripheral nervous system damage, cancer, genotoxicity and dysfunctioning of the reproductive system.48 The current study exhibited a positive correlation between bakery foods with obesity, determining the linkage of advanced glycation end-product formation directly leading to the development of obesity.
Ultra-processed or packaged foods are another perilous category of food considered as the major prime mover for the obesity epidemic due to the characteristic features of high fat, salt, and sugar, the results from the current study witness a positive correlation between seven packaged food items with BMI for age and waist-to-hip ratio. This finding is supported by the high caloric content and low satiety value of these foods, leading to overconsumption and lack of nutritional balance. A UK-based study reported a similar result with the highest quartile of UPF consumption associated with a relatively high risk of obesity evidenced by a 5% increase in BMI, waist circumference, and % body fat along with abdominal obesity.49
These results were in conjunction with the present study which showed a significant relationship between energy-dense snacks (as part of other foods category) and BMI-for-age or Waist-to-hip ratio.
Conclusion
This study highlights the high age consumption among obese adolescents derived from an enormous intake of junk and processed foods. These foods due to their poor nutritional profile led to a detrimental path on the adolescents posing them at risk for various chronic metabolic diseases. There is insufficient data on the age levels prevalent among adolescents and this study contributed to this finding. Prevention steps to tackle high AGE food consumption should be taken and healthier alternatives with optimal nutrition and less processing should be employed as the first line of treatment.
Acknowledgement
The Author would like to thank Sri Ramachandra Institute of Higher Education and Research for granting the PhD Research work. The Author is profoundly grateful to the Department of Clinical Nutrition along with the Department of Paediatrics for their continuous support and guidance for the completion of the research work.
Funding Sources
The author(s) received no financial support for the research, authorship, and/or publication of this article.
Conflict of Interest
The author(s) do not have any conflict of interest.
Data Availability Statement
The manuscript incorporates all datasets produced or examined throughout this research study.
Ethics Statement
This study has obtained permission from the Institutional Ethics Committee of Sri Ramachandra Institute of Higher Education and Research (IEC-NI/22/APR/82/45).
Informed Consent Statement
The research was conducted after obtaining consent from parents and adolescents before enrolling the participants for the study.
Clinical Trail Registration
This trial is registered at Clinical trial registry of India (CTRI) with the registration number CTRI/2023/07/055791
Permission to Reproduce Material from Other Sources
Not Applicable
Author Contributions
- Juhi Punjabi– Data collection, Analysis and Writing – Original Draft.
- Arambakkam Janardhanam Hemamalini– Conceptualization, Editing, Proofing -Original Draft.
- Sarala Premkumar– Reviewing and Editing.
References
- WHO Adolescent Health, World Health Organization. https://www.who.int/health-topics/adolescent-health/. Published October 2, 2024.
- WHO Adolescent Health, World Health Organization. https://www.who.int/news-room/fact-sheets/detail/obesity-and-overweight. Published March 1, 2024.
- Ranjani H, Mehreen TS, Pradeepa R, Anjana RM, Garg R, Anand K, Mohan V. Epidemiology of childhood overweight & obesity in India: a systematic review. Indian J Med Res. 2016;143(2):160-174.
CrossRef - Nowotny K, Schröter D, Schreiner M, Grune T. Dietary advanced glycation end products and their relevance for human health. Ageing Res Rev. 2018;47:55-66.
CrossRef - Wei Q, Liu T, Sun DW. Advanced glycation end-products in foods and their detecting techniques and methods: a review. Trends Food Sci Technol. 2018;82:32-45.
CrossRef - Davis KE, Prasad C, Vijayagopal P, Juma S, Imrhan V. Advanced glycation end products, inflammation, and chronic metabolic diseases: links in a chain? Crit Rev Food Sci Nutr. 2016;56(6):989-998.
CrossRef - Jara N, Leal MJ, Bunout D, et al. Dietary intake increases serum levels of carboxymethyl-lysine in diabetic patients. Nutr Hosp. 2012;27(4):1272-1278.
- Uribarri J, Cai W, Ramdas M, et al. Restriction of advanced glycation end products improves insulin resistance in human type 2 diabetes: potential role of AGER1 and SIRT1. Diabetes Care. 2011;34(7):1610-1616.
CrossRef - Luévano-Contreras C, Garay-Sevilla ME, Wrobel K, Malacara JM, Wrobel K. Dietary advanced glycation end products restriction diminishes inflammation markers and oxidative stress in patients with type 2 diabetes mellitus. J Clin Biochem Nutr. 2013;52(1):22-26.
CrossRef - Uribarri J, Cai W, Peppa M, et al. Circulating glycotoxins and dietary advanced glycation endproducts: two links to inflammatory response, oxidative stress, and aging. J Gerontol A Biol Sci Med Sci. 2007;62(4):427-433.
CrossRef - Cai W, Ramdas M, Zhu L, et al. Oral advanced glycation endproducts promote insulin resistance and diabetes by depleting the antioxidant defenses AGE receptor-1 and sirtuin 1. Proc Natl Acad Sci U S A. 2012;109(39):15888-15893.
CrossRef - Xing L, Gao-Hong L, Guo-Ying D, et al. Food-advanced glycation end products aggravate diabetic vascular complications via modulating the AGEs/RAGE pathway. Chin J Nat Med. 2016;14(11):844-855.
CrossRef - Chao PC, Huang CN, Hsu CC, et al. Association of dietary AGEs with circulating AGEs, glycated LDL, IL-1α and MCP-1 in type 2 diabetic patients. Eur J Nutr. 2010;49:429-434.
CrossRef - Uribarri J, Cai W, Woodward M, et al. Elevated serum advanced glycation endproducts in obese indicate risk for the metabolic syndrome. J Clin Endocrinol Metab. 2015;100(5):1957-1966.
CrossRef - Noor Hafizah Y, Ang LC, Yap F, et al. Validity and reliability of a food frequency questionnaire to assess dietary intake of preschool children. Int J Environ Res Public Health. 2019;16(23):4722.
CrossRef - Punjabi J, Hemamalini AJ, Premkumar S. Development, validity, and reliability of a food frequency questionnaire eliciting the dietary advanced glycation end product consumption among obese adolescents aged 10–19 years. Indian J Public Health. 2024;68(1):83-88.
CrossRef - Browne RH. On the use of a pilot sample for sample size determination. Stat Med. 1995;14(17):1933-1940.
CrossRef - Centers for Disease Control and Prevention. Anthropometry Procedures Manual. https://www.cdc.gov/nchs/data/nhanes/2019-2020/manuals/2020-Anthropometry- Procedures-manual-508-pdf. Published January 2020.
- Shetty P, Kumanyika S. Waist circumference and waist-hip ratio: report of a WHO expert consultation. Geneva: World Health Organization; December 2008:8-11.
- Steenhuis IH, Leeuwis FH, Vermeer WM. Small, medium, large or supersize: trends in food portion sizes in The Netherlands. Public Health Nutr. 2010;13(6):852-857.
CrossRef - Vermeer WM, Steenhuis IH. Small, medium, large or supersize? Consumers and fast‑food representatives’ perceptions of fast‑food portion sizes and their attitudes toward environmental interventions aimed at portion size. In: Chocolate, Fast Foods and Sweeteners: Consumption and Health. Nova Sci Publishers; 2010.
- Uribarri J, Woodruff S, Goodman S, et al. Advanced glycation end products in foods and a practical guide to their reduction in the diet. J Am Diet Assoc. 2010;110(6):911-916.
CrossRef - SSJ SM. Modified Kuppuswamy socioeconomic scale updated for the year 2021. Indian J Forensic Community Med. 2021;8(1):1-3.
CrossRef - Cooksey‑Stowers K, Schwartz MB, Brownell KD. Food swamps predict obesity rates better than food deserts in the United States. Int J Environ Res Public Health. 2017;14(11):1366.
CrossRef - Goel S, Kaur T, Gupta M. Increasing proclivity for junk food among overweight adolescent girls in district Kurukshetra, India. Res. J. Biological Sci. 2013; 16:17.
- Kotecha PV, Patel SV, Baxi RK, et al. Dietary pattern of school‑going adolescents in urban Baroda, India. J Health Popul Nutr. 2013;31(4):490.
CrossRef - Singh M, Mishra S. Fast food consumption pattern and obesity among school‑going (9‑13 year) in Lucknow District. Int J Sci Res. 2014;3(6):1672-1674.
- Goldberg T, Cai W, Peppa M, et al. Advanced glycoxidation end products in commonly consumed foods. J Am Diet Assoc. 2004;104(8):1287-1291.
CrossRef - Nurwanti E, Hadi H, Chang JS, et al. Rural–urban differences in dietary behavior and obesity: results of the Riskesdas study in 10–18‑year‑old Indonesian children and adolescents. Nutrients. 2019;11(11):2813.
CrossRef - Vergnaud AC, Norat T, Romaguera D, et al. Meat consumption and prospective weight change in participants of the EPIC‑PANACEA study. Am J Clin Nutr. 2010;92(2):398-407.
CrossRef - Cho SH, Cho YJ, Park JH. The human symbiont Bacteroides thetaiotaomicron promotes diet‑induced obesity by regulating host lipid metabolism. J Microbiol. 2022;60:118-127.
CrossRef - Ishak SI, Chin YS, Taib MN, Shariff ZM. Malaysian adolescents’ perceptions of healthy eating: a qualitative study. Public Health Nutr. 2020;23(8):1440-1449.
CrossRef - Inan‑Eroglu E, Ayaz A, Buyuktuncer Z. Formation of advanced glycation end products in foods during cooking process and underlying mechanisms: a comprehensive review of experimental studies. Nutr Res Rev. 2020;33(1):77-89.
CrossRef - Pt E, H Y, Y A, A A, J SN. A qualitative study among youth in Malaysia: What drives the purchase of roasted chicken products by young people seeking a better quality of life?. Heliyon. 2023;9(5):e15819.
CrossRef - Miller V, Webb P, Cudhea F, et al. Children’s and adolescents’ rising animal‑source food intakes in 1990–2018 were impacted by age, region, parental education and urbanicity. Nat Food. 2023;4(4):305-319.
CrossRef - Meena M, Varma K. Fast food consumption among adolescent school girls in Jaipur. Age. 2014;14(15):72.
- Borgis S, Kandakur MB, Bharati P. Knowledge level regarding junk food consumption among school children in Dharwad District, Karnataka. EPRA Int J Multidiscip Res. 2020;6:158-161.
CrossRef - Javalkar S, Akshaya KM, Nirgude AS. Food habits and fast food preferences among medical students. Int J Multidiscip Res Dev. 2015;2(10):556-559.
- Pandey A, Sapkota S. Prevalence and knowledge on obesity among school‑going adolescents of Kaski, Nepal. J Nepal Paediatr Soc. 2018;38(2):63-68.
CrossRef - Bhushan C, Taneja S, Khurana A. Burden of packaged food on schoolchildren: based on the CSE survey ‘Know Your Diet’. Centre for Science and Environment; 2017.
- Amin T, Choudhary N, Jabeen AN. Study of fast food consumption pattern in India in children aged 16‑20 years. Int J Food Ferment Technol. 2017;7(1):1-8.
- Veena V, MR SC, Shruthi MN, Khan SI. Junk food eating habits and obesity among medical college students in Bangalore: a cross‑sectional study. Natl J Community Med. 2018;9(2):100-105.
- Amin MN, Mosa AA, El‑Shishtawy MM. Clinical study of advanced glycation end products in Egyptian diabetic obese and non‑obese patients. Int J Biomed Sci. 2011;7(3):191.
CrossRef - Mirmiran P, Hadavi H, Mottaghi A, Azizi F. Advanced glycation end products and risk of general and abdominal obesity in Iranian adults: Tehran lipid and glucose study. Med J Islam Repub Iran. 2019;33:21.
CrossRef - Qi Q, Chu AY, Kang JH, et al. Fried food consumption, genetic risk, and body mass index: gene‑diet interaction analysis in three US cohort studies. BMJ. 2014;348:g?.
CrossRef - Nematollahi A, Kamankesh M, Hosseini H, et al. Acrylamide content of collected food products from Tehran’s market: a risk assessment study. Environ Sci Pollut Res. 2020; 27:30558-
CrossRef - Mousavi Khaneghah A, Fakhri Y, Nematollahi A, et al. The concentration of acrylamide in different food products: a global systematic review, meta‑analysis, and meta‑regression. Food Rev Int. 2022;38(6):1286-1304.
CrossRef - Cantrell MS, McDougal OM. Biomedical rationale for acrylamide regulation and methods of detection. Compr Rev Food Sci Food Saf. 2021;20(2):2176-2205.
CrossRef - Rauber F, Chang K, Vamos EP, da Costa Louzada ML, Monteiro CA, Millett C, Levy RB. Ultra‑processed food consumption and risk of obesity: a prospective cohort study of UK Biobank. Eur J Nutr. 2021;60:2169-2180.
CrossRef
Abbreviations List
AGE- Advanced Glycation End Product,
BMI- Body Mass Index,
Dage – Dietary Advanced Glycation End Product
FFQ- Food frequency questionnaire.
Accepted on: 30 May 2025
Second Review by: Mohamed Nader
Final Approval by: Dr. Suhad Bahijri


Web of Science Coverage
Emerging Sources Citation Index (ESCI)
2024 Journal Impact Factor: 1.1
Scopus Journal Metrics
CiteScore 2025: 2.6
CiteScore Details
Sustainable Nutrition: Food Systems, Nutrient Retention, and Public Health Impact
![]()
This journal is a member of, and subscribes to the principles of, the Committee on Publication Ethics (COPE)


