Optimising a Nutritious, Affordable, and Culturally Acceptable Diet for Ghanaian Adolescents Using Linear Program
 , Emmanuel Essien2, Hanne Vlaeminck3, Juan-Pablo Vasco3, Esa-Pekka Nykänen4, Henry Ofosuhene Sintim5, Nicole Sharon Affrifah1*and Firibu Kwesi Saalia1
 1Department of Food Process Engineering, University of Ghana, Legon, Ghana
2Department of Agricultural Engineering, University of Ghana, Legon, Ghana
3Nestlé Research Centre, Lausanne, Switzerland
4Functional Foods Forum, University of Turku, Turku, Finland
5Institute of Applied Science and Technology, University of Ghana, Legon, Ghana
Corresponding Author Email: nsaffrifah@ug.edu.gh,
DOI : http://dx.doi.org/10.12944/CRNFSJ.13.2.28
Download this article as:
![]()
Nutrition is key for adolescents because it directly impacts their health and long-term well-being. As this demographic undergoes rapid growth and development, the significance of proper nutrition is paramount. However, ensuring adequate adolescent nutrition is complex due to economic constraints in the developing world. Considering the socioeconomic difficulties that can prevent access to nutritious food, this study aimed to create low-cost, culturally acceptable food baskets that meet nutritional and socio-cultural requirements, using locally available ingredients in Ghana. A linear programming approach was used to identify the set of ingredients where the total cost of the food basket was considered as the objective function to be minimised. Locally available food items with their prices and nutrient composition were used to obtain the optimised food baskets for the defined target groups at minimum cost. The optimised food baskets met Food and Agriculture Organisation (FAO) & World Health Organisation (WHO) and the Institute of Medicine’s nutrient requirements for adolescent males and females within specified limits. The estimated costs of the proposed ingredients were at a minimum 15.70 and 15.57 per food basket, respectively for adolescent males and females. Each of the food baskets designed for adolescent males and females contained 15 food items, and their nutrient requirements stayed within the lower and upper levels defined.
KEYWORDS:Adolescent Nutrition; Cultural Acceptability; Diet Optimisation; Healthy Diets; Nutrients
Introduction
Dietary choices made during teenage years are crucial for determining overall long-term health. Healthy diets ensure that individuals are well nourished and maintain good well-being by providing the nutrients needed for physical and cognitive development.1,2 These diets also serve as a critical measure of health-promoting aspects of food systems.3 Rapid growth and maturation are experienced during adolescence, from childhood to adulthood,4 and good nutrition is required to achieve this. Wiafe et al.5 highlighted the need for improved nourishment to support adolescents’ biological and physiological growth. Currently, there is an increasing trend of diet-related non-communicable diseases,6 with a prevalence of overweight of approximately 3.2% and 10.4% among adolescent males and females in Ghana, respectively.7
Azupogo et al.4 further indicated the prevalence of stunting, underweight, and overweight among adolescents aged 15 – 17 due to poor nutrition. Furthermore, a study8 on the correlation of dietary diversification among pregnant adolescent girls in Ghana showed that inadequate dietary diversification is associated with rural living, food insecurity, and poverty. A study conducted by Abubakar et al.9 in the Tamale metropolis of Ghana showed that some adolescents were underweight, and the leading causes were unhealthy dietary habits and socioeconomic status. However, maintaining a healthy and nutritious diet can be difficult because of the rising cost of nutritious foods,10 especially when considering the financial limitations of numerous households.11,12 Liese et al.13 indicated a positive correlation between a quality diet and reduced risk of death from non-communicable diseases. Thus, nutritious diets can prevent or reduce the prevalence of non-communicable diseases.
Some studies6,14 have examined the cost and affordability of meeting the recommended nutrient intakes from locally available foods. Their studies indicated the possibility of designing nutritious diets at minimum costs. Temple and Steyn15 highlighted the need for healthy diets for low-income households in South Africa.
Cost can be a significant barrier to accessing healthy diets because consumers often must consider other needs, such as clothing and accommodation, and they conflict. Darmon and Drewnowski12 emphasised the significant role of economic factors, particularly food prices, in influencing consumers’ food choices and dietary quality. The study highlighted that the cost of healthy foods can be a barrier for financially challenged people, forcing inexpensive and less nutritious options. The findings of this review are consistent with the current trend of increasing prices for nutritious foods.10 This trend could exacerbate disparities in health outcomes among different socioeconomic groups, as people with limited financial resources may have limited access to healthy dietary options.
Economic deprivation comes with the burden of malnutrition (undernutrition), with many low-income sub-Saharan countries, including Ghana, showing increasing rates of undernourished children.16 Low-income consumers are more affected by poor-quality diets than wealthier consumers due to high food prices.17 Thus, it is critical to consider the affordability of a nutrient-adequate diet when attempting to solve dietary problems to promote health equity and reduce health disparities.18
Linear programming (LP) is an excellent approach for formulating diets to solve nutritional problems19, 20 and can also be used to propose foods that meet dietary guidelines. The technique is used to find the best possible solution such as the minimum cost of a food basket, under given constraints. Even though LP has been a practical approach to obtaining nutrient-dense foods at a minimum cost, according to,14 cultural and consumer acceptability are critical for successful adoption because even the most theoretically optimal diet can fail if it disregards consumer preferences. This is an identified gap in several previously reported research using LP.
A low-cost, nutritionally adequate diet with low climate impact was achieved using linear programming. However, cultural acceptability was not considered as a constraint in the study.21 Brimblecombe et al.22 used linear programming to design a least-cost diet that was nutrient-dense and adequate but did not also consider consumer acceptability.
Food choices reflect more than just nutritional requirements; they are also shaped by preferences for taste, smell, and texture, along with cultural values and ethical beliefs.23 Consumers play an important role in the selection of sustainable food options because they make the ultimate food choice.24 A clear definition of consumer acceptability in diet planning can be challenging;25 however, it can be explained in terms of either food consumption range, that is, the lower and upper limits of specific food items consumed by a group of people26,27 or by minimising the deviations between proposed dietary patterns and observed patterns of a population.28,29 Incorporating consumer insights into the development of sustainable diets can increase the likelihood of acceptance by the target population.
This study aimed to design minimum-cost food baskets that are nutritionally adequate and culturally acceptable for adolescent males and females aged 14 to 18 using locally available food items in Ghana.
Materials and Methods
Operational Definitions
In this study, the following classifications were provided for key terms that will be used (Table 1) to ensure consistency and aid in results discussion.
Table 1: Locally available food items in Ghana (n=98) included in the linear programming analysis
|
Food groups |
Subgroups | Number of food items |
| Staples | Cereals, grains, starchy foods |
27 |
|
Legumes, seeds, and nuts |
Beans, seeds, nuts (for example, peanut), pulses | 10 |
| Fruits and vegetables | Fruits, leafy, and wild vegetables |
32 |
|
Animal-sourced foods |
Beef, mutton, pork, poultry, seafood | 14 |
| Fats and oils | Animal and plant-based fats and oils |
6 |
|
Miscellaneous |
Spices, salt, *milk powder, *yoghurt, and mushroom | 7 |
| Total |
98 |
|
*Yoghurt and milk powder were included in the miscellaneous because of their low consumption rate in Ghana.
Dietary data and Food groups
The prices of food items were obtained from a study that collected data from 11 urban marketplaces and supermarkets in the Ashanti, Central, and Greater Accra regions, as well as eight rural marketplaces in the Ashanti and Volta regions of Ghana between February and April 2016.6 Additional data on the cost of locally available foods from the major markets across the country from 2021 to 2022 was obtained from the Ministry of Food and Agriculture (MoFA), Ghana. In cases where the nutrient composition of the food items was incomplete, data was complemented with information from the FAO food composition table for West Africa.30,31 To ensure that the most current prices were reflected, the prices were adjusted for inflation using the Consumer Price Index (CPI) from February 2017 to December 2023.32 To prevent the inclusion of empty calories, sugar was excluded from the food list
Nutrient requirements
This study examined essential vitamins, minerals, and macronutrients, including fat, protein, and carbohydrates, focusing on the micronutrients of Ghana’s public health concerns. The minimum level for the nutrients was defined as the Recommended Dietary Allowance (RDA), which is needed to satisfy nearly all (97 to 98) healthy individuals in a population’s group (Table 3),33-37 with slight modification for mathematical suitability (Eqs 2 and 3). For example, the requirement for thiamine was defined as 1.2 mg with no adverse effect for higher amounts in the recommendation for adolescent males, and it was defined as ≥ 1.2 mathematically. Recommendations that did not have these modifications were indicated with an asterisk in Table 3. Maximum intake levels of each were based on the upper-level intake for the nutrients defined.
Defining Parameters and Variables
The total cost of the food basket was defined as the objective function in the LP formulation. The goal was to obtain a list of ingredients that met specific requirements at minimum cost. The decision variables were the quantity of ingredients needed. Constraints were set for the minimum and maximum limits of each nutrient.
Mathematical modelling
A linear programming model was adopted using the equations below to select ingredients that meet all the requirements at minimum cost.
Where:
Z – total cost to be minimised (objective function)
n-total number of food items in the LP analysis
xj – portions of food item j in g
cj – the cost of food item j per 100 g
aij – amount of nutrient i in food item j
li – the lower bound for nutrient i (g or mg or kcal)
ui – the upper bound for nutrient i (g or mg or kcal)
m – represents the number of inequalities
FGi = the respective food groups (FOs,FVs,LSNs,ASFs,S,and M,respectively)
FOs – fats and oils
FVs – fruits and vegetables
LSNs – Legumes,seeds and nuts
ASFs – Animal sourced foods
S – Staples
M – miscellaneous
Pi – the recommended percentage of the selcted food items for FGi
(the respective percentages specific for the Ghanaian setting in the study scope are 0.4%,35%,13.07%,9.5%,44% and 2.77%,respectively for FOs,FVs,LSNs,ASFs,S,and M.).
T – the summation of food items Xj
The weight contribution of various foods is based on recommendations from the food-based dietary guidelines (FBDG) for Ghana38 and modified as required for feasibility using Equations (Eqs) 5 to 10. Further constraints (Eqs 11 to 13) were included to select three ingredients (onions, pepper, and tomatoes) common in the local Ghanaian diet based on the daily minimum requirements recommended by the FBDG for Ghana (Eqs 11 – 13). These constraints were defined to account for cultural acceptability. The constraint on pepper was set not to exceed the maximum quantity because it is usually consumed in small quantities.
The constraints were included in a stepwise manner. The first step was to solve the problem with only nutrient constraints by implementing Eqs 1 – 4. This was followed by constraining the food groups, including tomatoes, onions, and pepper (should they not be selected).
Software
To efficiently solve the cost optimisation problem defined above, the Gurobi solver (version 10.0.2) was used. The solver was integrated with the Pyomo package in the Python programming language. The hardware configuration provided sufficient computational resources for the optimisation process.
Results
General Results
The optimization process involved a stepwise approach, starting with nutrient constraints (Eqs 1 – 4) and gradually adding requirements defined for the food groups and specific ingredients (5 – 13). The stepwise optimization process was necessary because the first optimization process, with only nutrient constraints, comprised only seven food items with large and unrealistic amounts to be included in a diet because of their unsuitable combinations. Restrictions on fruits and vegetables had to be relaxed by adjusting them upward by 5% to make room for including specific ingredients. Still, they aimed to stay close to the recommended percentages from the FBDG.38 During the linear programming exercise, constraints on the food baskets were imposed to achieve dietary diversification and ensure familiar patterns based on the FBDG.
Furthermore, the nutrient values obtained after the linear optimization stayed within the established lower and upper limits. Whiles the nutrient values obtained remained within the lower and upper limits of the defined constraints, the lower requirements for n-6 PUFAs, calcium, vitamin A-RAE, and vitamin E were binding in the model for adolescent males. Similarly, n-6 PUFAs and vitamin E were the binding constraints in the model for adolescent females. The upper requirements for cholesterol, sodium, and niacin were also binding constraints in the results for male and female adolescents.
Even though the recommended dietary allowance of nutrients is considered an essential factor in a least-cost diet optimisation problem, considering the consumer acceptability of food items is also crucial to ensure long-term compliance with the proposed food baskets. The results focused on the cost of the optimized food baskets, their total weights, ingredients, and their contribution to the nutrient values obtained within the defined lower and upper bounds.
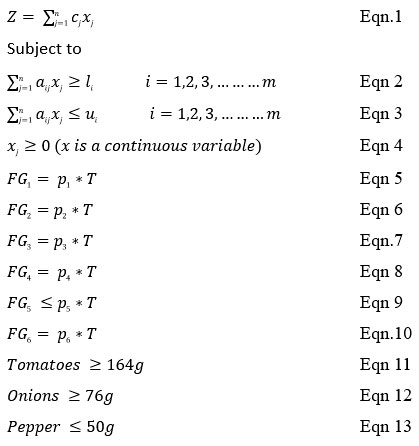
The results show that least-cost diet optimization for the defined target group is possible (Figure 1), and dietary recommendations can be transformed into practical dietary advice for Ghanaian consumers.
Figures, Tables and Schemes
The step-by-step inclusion of the nutrient constraint increased the cost of the food basket until all the nutrient constraints were satisfied. The minimum cost of the food baskets for adolescent males and females was GHS 15.70 and GHS 15.57 per food basket (1 GHS = 0.1 USD, 31st December 2023), respectively (Figure 1).
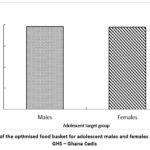 |
Figure 1: Cost of the optimised food basket for adolescent males and females aged 14 to 18. GHS – Ghana Cedis |
The contribution of the ingredients in terms of food groups to the total cost is represented in Figure 2. For both food baskets, fruits and vegetables contributed the most to the cost, followed by animal-sourced foods, staples, legumes, seeds, and nuts, miscellaneous, and fats and oils.
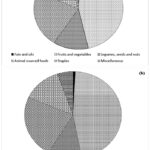 |
Figure 2: Contribution of the different food groups to the overall cost achieved for adolescent males (a) and females (b) aged 14 to 18 years. |
Table 2 displays food items for adolescent males and females with corresponding amounts and costs to meet their nutritional needs. The male and female food baskets were similar in weight.
Table 2: Optimised food baskets (ingredients and cost) for the daily nutritional requirements for adolescent males and females aged 14 to 18 years
|
|
Males | Female | ||||
| Food Groups | Food items | Amount (g) | Cost (GHS) | Food item | Amount (g) |
Cost (GHS) |
|
Fats and oils |
Vegetable oil | 6.23 | 0.12 | Vegetable oil | 6.33 | 0.12 |
| Total | 6.23 | 0.12 | 6.33 |
0.12 |
||
|
Fruits and vegetables |
Avocado | 233.62 | 1.33 | Oranges | 77.38 | 0.30 |
| Dried pepper | 3.37 | 0.12 | Avocado | 159.94 |
0.91 |
|
|
Tomato |
164.00 | 1.87 | Dried Pepper | 12.13 | 0.43 | |
| Dried okro | 68.12 | 2.75 | Tomato | 164.00 |
1.87 |
|
|
Onion |
76.00 | 1.10 | Dried okro | 64.29 | 2.60 | |
| Onion | 76.00 |
1.10 |
||||
|
Total |
545.11 | 7.18 | 553.74 | 7.21 | ||
| Legumes, seeds, and nuts
|
Unshelled Groundnut | 8.46 | 0.17 | Soya Bean | 99.62 |
0.94 |
|
Soya Bean |
195.10 | 1.83 | Oil palm nut | 107.16 | 0.81 | |
| Total | 203.56 | 2.00 | 206.78 |
1.75 |
||
|
Animal sourced foods |
Egg | 55.88 | 1.39 | Egg | 55.62 | 1.38 |
| Fresh kpanla (Barracuda) | 55.86 | 1.46 | Fresh kpanla (Barracuda) | 58.29 |
1.52 |
|
|
Smoked tuna |
36.22 | 0.71 | Smoked tuna | 36.39 |
0.72 |
|
|
Total |
147.96 | 3.56 | 150.30 | 3.62 | ||
| Staples
|
White maise | 14.89 | 0.09 | Cassava | 621.14 |
2.05 |
|
Cassava |
596.57 | 1.97 | ||||
| Total | 611.46 | 2.06 | 621.14 |
2.05 |
||
|
Miscellaneous |
Cow milk (Pasteurized) | 40.36 | 0.77 | Cow milk (Pasteurized) | 42.12 | 0.80 |
| Iodised salt | 2.78 | 0.02 | Iodised salt | 1.71 |
0.01 |
|
|
Total |
43.14 | 0.79 | 43.82 | 0.81 | ||
| Σ TOTAL | 1557.46 | 15.70 | 1582.13 |
15.57 |
||
There were no constraints imposed on individual portion sizes. GHS – Ghana Cedi
Staples, fruits, and vegetables were the most significant contributors to the weight of food baskets, followed by legumes, seeds and nuts, animal-sourced foods, miscellaneous, and fats and oils (Figure 3). Furthermore, the results show a good representation of food items from the different groups, providing variety in the optimised food basket.
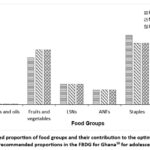 |
Figure 3: Optimised proportion of food groups and their contribution to the optimised food baskets against the recommended proportions in the FBDG for Ghana38 for adolescents 14 to 18. |
Table 3 summarises the estimated nutritional values of 27 nutrients in the optimised food baskets for adolescent males and females. The optimised food baskets met all the micronutrient requirements (lower and upper limits).
Table 3: Recommended daily nutrient intake for adolescents and the estimated nutrient content of the proposed least-cost diet
|
Nutrients |
Males | Females | |||
| Recommended values | Proposed least-cost diet | Recommended values |
Proposed least-cost diet |
||
|
Energy |
Kcal | 2200-3200 | 2050.18 | 1800-2400 | 2400.00 |
| Protein | g | ≥52 | 90.12 | ≥46 |
80.74 |
|
Fat |
g | ND | 72.12 | ND | 100.82 |
| n-3 PUFAs | g | ≥1.6 | 2.53 | ≥1.1 |
1.92 |
|
n-6 PUFAs |
g | ≥16 | 16.00 | ≥11 | 11.00 |
| Cholesterol | mg | ≤300 | 300.00 | ≤300 |
300.00 |
|
Carbohydrate |
g | ≥130 | 273.12 | ≥130 | 302.70 |
| Fibre | g | ≥38 | 79.00 | ≥26 |
72.56 |
|
Sodium |
mg | ≤1500 | 1500.00 | ≤1500 | 1500.00 |
| Potassium | mg | ≥3000 | 6880.18 | ≥2300 |
6603.74 |
|
*Calcium |
mg | 1300-3000 | 1300.00 | 1300-3000 | 1300.00 |
| Magnesium | mg | ≥410 | 843.13 | ≥360 |
992.30 |
|
*Iron |
mg | 11-45 | 19.23 | 15-45 | 25.46 |
| *Zinc | mg | 11-34 | 12.88 | 9-34 |
14.38 |
|
*Copper |
mg | 0.89-8 | 2.47 | 0.89-8 | 3.65 |
| *Selenium | µg | 55-400 | 113.31 | 55-400 |
113.39 |
|
*Phosphorus |
µg | 1250-4000 | 1676.13 | 1250-4000 | 1636.85 |
| *Iodine | µg | 150-900 | 185.93 | 150-900 |
158.06 |
|
*Vit A-RAE |
µg | 900-2800 | 900.00 | 700-2800 | 1139.17 |
| Thiamine | mg | ≥1.2 | 2.29 | ≥1.0 |
2.50 |
|
Riboflavin |
mg | ≥1.3 | 1.45 | ≥1.0 | 1.46 |
| *Vitamin B6 | mg | 1.3-80 | 3.10 | 1.2-80 |
3.12 |
|
Vitamin B12 |
µg | ≥2.4 | 4.02 | ≥2.4 | 4.10 |
| *Vitamin C | mg | 75-1800 | 297.97 | 65-1800 |
335.77 |
|
*Vitamin E |
mg | 15-800 | 15.00 | 15-800 | 15.00 |
| *Folate | µg | 400-800 | 772.98 | 400-800 |
712.91 |
|
*Niacin |
mg | 16-30 | 30.00 | 14-30 |
30.00 |
The range in the third column reflects the nutrients’ lower and upper intake limits. To indicate nutrients that have only lower or upper limits, ≤ or ≥ was respectively used. RAE – retinol activity equivalent, n-3PUFAs – alpha-linolenic acid, n-6 PUFAs – linoleic acid, ND – not defined. (Source:33-37).
Figure 4 further shows the contribution of the different food groups to energy and macronutrient values obtained from the optimised food baskets for adolescent males and females. In general, similar trends were observed for the contribution of the different food groups to the nutrient values obtained after optimizing the food baskets. Staples contributed the most to energy and carbohydrates, accounting for 43.85% of energy and 83.87% of carbohydrates for the food basket for males. For the female food basket, staples contributed 36.75% to energy and 75.51% to carbohydrates. Animal-sourced foods contributed the most to the proteins. It contributed 38.01% for the food basket for males and 43.26% for the food basket for females. Fruits and vegetables contributed 53.14% to the optimised fat value for the food basket of males, whereas legumes, seeds, and nuts contributed 55.89% to that of females.
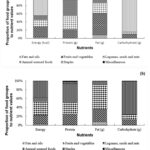 |
Figure 4: Proportion of food groups and their contribution to the energy and the primary macronutrient values obtained for adolescent males(a) and females aged 14 to 18 years. |
Discussion
The results showed that obtaining food baskets for adolescent males and females at a minimum cost using locally available food items was feasible. Increasing the number of constraints increases the cost of the food baskets. The positive correlation between the number of constraints and cost was supported by the studies conducted by19,39,40 who indicated that including more constraints in addition to nutrient recommendations increased the lowest cost of the diets they optimised. An increase in the number of constraints could have limited the solution space, making it difficult to find a solution at a low cost. This could have forced the algorithm to include more expensive food items, increasing cost. In addition, increased dietary diversity, ensuring specific percentages from the food groups, could have also contributed.
The number of items in the food baskets for adolescent males and females was the same after the final inclusion of nutritional constraints and acceptability requirements. Fifteen food ingredients were obtained for adolescent males and the same for females from the 98 items used for the optimisation exercise. This implies that only a few ingredients (15.3 %) were needed to meet the nutrient recommendations for adolescent males and females. Parlesak et al.19 reported similar trends, stating that very few foods were required to meet nutrient and dietary recommendations at the least possible cost. Wilson et al.41 also reported ten items in a food basket for a least-cost diet with a low environmental impact. A minimum food basket cost developed for rural and urban families in Ethiopia resulted in 16 and 19 food items, even though the authors indicated less dietary diversity with the results.14 Furthermore, in a study by Lauk et al.42 to optimise food baskets for families in Estonia, the optimised food basket without considerations for cultural acceptability resulted in 9 food items. The results further indicate the need to consider common foods consumed by a population when developing LP diet recommendations. Also, the smaller number of food items for adolescent males and females could have been due to the tendency of the algorithm to select fewer food items that met the defined constraints because of the direction of the objective which was to minimise cost.
Food items under fruits and vegetables amounted to GHS 7.18, contributing 45.73% of the cost of the food basket for adolescent males. That of the food basket for adolescent females cost GHS 7.21, contributing 46.31% of the total cost. Animal-sourced foods amounted to GHS 3.56, contributing 22.68% of the cost of the food basket for adolescent males, and for food basket for females, it was GHS 3.62 making up 23.25%. for females. The high contribution of the food items from this food group category is expected because the production of animal-based food products requires significant resources, making them expensive food sources.43 This was followed by staples contributing 13.12% of the total cost for adolescent males and females. Even though the optimisation provided dietary diversification, the high-cost contribution of fruits and vegetables could be expensive for some low-income earners.
These trends highlight diets consisting of staples, legumes, fruits and vegetables, and animal-sourced foods, with minimum fats and oils for adolescent males and females. The optimised proportions of fruits and vegetables were slightly higher than the 30% recommended in the FBDG for Ghana. However, it aligns with many health organisations, like the Centre for Disease Control and Prevention, which recommends that people consume about four servings to maintain a healthy diet.44 The slight increase in the recommended intake compared to the amount suggested by the Ghanaian FBDGs can be considered good because it skews towards the recommendations by the EAT-Lancet.45 The EAT-Lancet stated that an increase in plant-based foods in consideration for a sustainable diet is gaining increasing recognition. The slight decrease in staples can be considered a good outcome because it aligns with a recommendation from the World Health Organisation (WHO) that hints at a decrease in staple consumption to prevent excess calorie intake, which can cause overweight and obesity.46 The low inclusion of fats and oils at 0.4% of the total weight of the food basket was in line with the recommendation of 6g of oils by the FBDG for Ghana. Also, the low contribution from that food group means lower consumption, which can benefit overall health.47
There was adequate representation of legumes and animal-sourced foods in the food baskets for males and females, in alignment with the recommendations of the Ghanaian FBDG.38 These scenarios form a reasonable basis for interventions that promote healthier eating habits and reduce the risk of diet-related chronic diseases.46 The diversity of the food items included in the food baskets for adolescent males and females indicates healthy eating. Omari et al.48 hinted that dietary diversification and FBDG are some of the critical approaches that can be used to control and eliminate micronutrient malnutrition in Ghana. These results offer the possibility of addressing these unhealthy dietary habits among adolescents at a minimum cost.
Constraints are said to be binding when a change to them results in changing the optimal solution obtained.49 For example, decreasing the minimum n-6 PUFA (an essential fat that is important for maintaining health) requirement for adolescent males and females will decrease the optimal cost value. Interestingly, even though iron deficiency (anemia) is a problem among different populations in Ghana,5,50 iron was not a binding constraint and therefore did not affect the cost of food baskets. The optimised food baskets met iron constraints, which can be an excellent way to develop interventions for adolescent males and females in real-life applications.
The consumption of staples like starchy roots, cereals, and legumes is typical in Ghanaian diets as they provide enough energy and nutrients, mainly carbohydrates. According to Ogedengbe et al.,51 legumes contain many nutrients and are vital for providing energy, carbohydrates, protein, and fibre. Hence, they are essential to the optimised food basket.
The optimised food baskets can be said to have ensured cultural acceptability since the combination of locally available foods is essential in ensuring acceptability, which can encourage long-term dietary improvements. This is mainly because locally available foods are familiar and accessible, making them more likely to align with traditional culinary practices and preferences.
Additionally, fruits and vegetables met most micronutrient needs, including iron, potassium, riboflavin, Vitamin C, folate, and niacin for both genders. Results obtained from the study show that LP could be a great approach to developing interventions to encourage healthy diets among adolescents. From the study, it is possible to use an optimisation algorithm to propose food baskets that have feasible combinations and can help identify foods that can be promoted by policymakers and dietary patterns that can even be adopted for school feeding programs and other educational institutions.
This typical example of a food-based solution can be leveraged in the campaign against micronutrient deficiencies and other non-communicable diseases among adolescents in Ghana. Also, the current provision of the Ghanaian FBDG can be adapted and incorporated as a guide in linear optimization, as done in this study.
It is worth noting that this study had certain limitations. Firstly, the seasonality of some or most foods was not considered. Secondly, the portion sizes of individual food items were not restricted, which could lead to the algorithm recommending either too little or too much quantity of certain food items. Additionally, in as much as the inclusion of constraints on food groups offered variety, the continued consumption of the proposed items could become monotonous as only fifteen items were selected. Whereas constraints were imposed on the different food groups, it did not consider the various ethnic groups.
Conclusion
The study aimed to propose food baskets from locally available ingredients that met nutrient requirements and acceptability constraints for adolescent males and females. It was possible to obtain these food baskets at a minimum cost of GHS 15.70 for males and GHS 15.57 for females, with 15 food items each. Selected food items represented all the food groups defined, indicating dietary diversification. The estimated nutrient contents stayed within the lower and upper requirements, even though nutrients like calcium, vitamins A and E were limiting. Also, fruits and vegetables provided the required micronutrient, and staples and legumes contributed to energy and macronutrients.
The linear programming algorithm was used to solve the dietary problem defined in the objective. Including dietary diversification and consideration for essential ingredients can influence food selection patterns, which has implications for the nutritional quality and cost of food baskets. The results from the study imply that it is possible to improve the accessibility of affordable diets for adolescents.
The study can be incorporated into the governments initiative for school feeding programs to test the LP-designed food baskets for the target group. Additionally, the methodology can be applied productively to other population groups and extended beyond the Ghanaian context.
A notable limitation of this study is that the optimisation process yields only a single optimal solution which could result in a monotonous diet.
Acknowledgement
The authors would like to thank the University of Ghana for granting this research.
Funding Source
The study was funded under a grant from Nestlé SA to the University of Ghana under the UG-Nestlé PhD Scholarship for Research Excellence.
Conflict of Interest
The authors do not have any conflict of interest.
Data Availability Statement
All data set used for this optimisation study have been incorporated in this manuscript.
Ethics Statement
This research did not involve human participants, and therefore, informed consent was not required.
Informed Consent Statement
This study did not involve human participants, and therefore, informed consent was not required.
Clinical Trail Registration
This research does not involve any clinical trials
Permission to Reproduce Material from Other Sources
Not applicable
Author Contributions
- Leticia Donkor: Conceptualisation, Formal analysis, Methodology, Writing – original draft, writing – review & editing
- Emmanuel Essien: Software, Supervision, Visualisation, Writing – review & editing
- Hanne Vlaeminck: Validation, Software, Writing – review & editing
- Juan Pablo Vasco: Validation, Software, Writing – review & editing
- Esa-Pekka Nykänen: Data collection and analysis, Writing – review & editing
- Henry Ofosuhene Sintim: Project administration, Resources, Funding Acquisition, Writing – review & editing
- Nicole Sharon Affrifah: Conceptualisation, Methodology, Funding Acquisition, Resources, Writing – review & editing
- Firibu Kwesi Saalia: Methodology, Supervision, Resources, Writing – review & editing
References
- Singh M. Role of micronutrients for physical growth and mental development. Journal of Paediatrics, 2004; Volume 71.
CrossRef - Healthy diet. Retrieved from Healthy diet (who. int) on 28th September 2023 at 22:51; 2020.
- Schneider K. Give to AgEcon Search. http://ageconsearch.umn.edu; 2021.
- Azupogo F., Abizari A., Aurino E., et al. Malnutrition, Hypertension Risk, and Correlates: An Analysis of the 2014 Ghana Demographic and Health Survey Data for 15–19 Years Adolescent Boys and Girls. Nutrients, 2020; 12(9), 2737.https://doi.org/10.3390/nu12092737.
CrossRef - Wiafe M. A., Ayenu J., & Eli-Cophie, D. A review of the risk factors for iron deficiency anemia among adolescents in developing countries. Anemia, 2023; 1 – 11.
CrossRef - Nykänen E. P. A., Dunning H. E., Aryeetey R. N.O., et al. Nutritionally optimized, culturally acceptable, cost-minimized diets for low-income Ghanaian families using linear programming. Nutrients, 2018; Volume 10, Issue 4, DOI: 10.3390/nu10040461.
CrossRef - Alicke M., Boakye-Appiah J. K., Abdul-Jalil I., et al. Adolescent health in rural Ghana: A cross-sectional study on the co-occurrence of infectious diseases, malnutrition, and cardio-metabolic risk factors. PLOS ONE, 2017; 12(7), e0180436. https://doi.org/10.1371/journal.pone.0180436.
CrossRef - Gyimah L. A., Annan R. A., Apprey C., et al. Dietary diversity and its correlates among pregnant adolescent girls in Ghana. PLoS ONE, 2021; 16(3 March). https://doi.org/10.1371/journal.pone.0247979.
CrossRef - Abubakar A., Issah A.-N., Yussif B., et al. Dietary habits, nutritional status and related factors among adolescents in Tamale Metropolis, Ghana. African Journal of Food Science, 2023; Vol. 17 (1), DOI:10.5897/AJFS2021.2147, 10-13.
CrossRef - Dizon F., & Herforth A. The Cost of Nutritious Food in South Asia. 2018; http://www.worldbank.org/research.
CrossRef - Nabinl M. H., Bhattacharya S., & Kumar K. Optimal diet selection and the compliance problem: A technical note. Journal of Interdisciplinary Mathematics, 2013; 16:1, pp. 83 – 95, DOI:10.1080/09720502.2013.778497.
CrossRef - Darmon N. & Drewnowski A. Contribution of food prices and diet cost to socioeconomic disparities in diet quality and health: A systematic review and analysis. Nutritious Reviews, 2015; Vol. 73(10): 643 – 660.
CrossRef - Liese A. D., Krebs-Smith S. M., Subar A. F., et al. The dietary patterns methods project: synthesis of findings across cohorts and relevance to dietary guidance. American Society for Nutrition, 2015; 393-402.
CrossRef - Gurmu A. B., Nykänen E.-P. A., Alemayehu F. R., et al. A. Cost-Minimized Nutritionally Adequate Food Baskets as Basis for Culturally Adapted Dietary Guidelines for Ethiopians. Nutrients, 2019; 11, 2159; doi:10.3390/nu11092159.
CrossRef - Temple N. J. & Steyn N. P. The cost of a healthy diet: A South African perspective. Nutrition, 2011; 27, pp. 505-508.
CrossRef - UNICEF (2021). 2021 Nutrition budget brief https://www.unicef.org/ghana/reports/2021-budgets-briefs Accessed on 24th April 2023 at 22:56.
- Schneider K. R. Nationally representative estimates of the cost of adequate diets, nutrient level drivers, and policy options for households in rural Malawi. Food Policy, 2022; 113. https://doi.org/10.1016/j.foodpol.2022.102275.
CrossRef - Herforth A., Bai Y., Venkat A., et al. Cost and affordability of healthy diets across and within countries: Background paper for the state of food security and nutrition in the world 2020. FAO Agricultural Development Economics Technical Study No. 9. Rome: Food and Agriculture Organisation of the United Nations, 2020.
- Parlesak A., Tetens I., Jensen J. D., et al. Use of linear programming to develop cost-minimized nutritionally adequate health-promoting food baskets. Plos One, 2016; pp. 1–19.
CrossRef - Chungchunlam S. M., Garrick D. P., & Moughan P. J. Using linear programming to determine the role of plant- and animal-sourced foods in least-cost, nutritionally adequate diets for adults. Current Developments in Nutrition, 2021; 1; 5:nzab132.
CrossRef - van Dooren C., Tyszler M., Kramer G. F. H. et al. Combining Low Price, Low Climate Impact and High Nutritional Value in One Shopping Basket through Diet Optimization by Linear Programming. Sustainability, 2015; 7, 12837-12855; doi:10.3390/su70912837.
CrossRef - Brimblecombe J., Ferguson M., Liberato S. C., et al. Optimisation Modelling to Assess Cost of Dietary Improvement in Remote Aboriginal Australia. Plos One, 2013; Volume 8, Issue 12, pp. 1–11.
CrossRef - Carlsson-Kanyama A. Climate change and dietary choices — how can emissions of greenhouse gases from food consumption be reduced? Food Policy, 1998; Vol. 23, No. 3/4, pp. 277-293.
CrossRef - Verly-Jr E., de Carvalho A. M., Marchioni D. M., et al. The cost of eating more sustainable diets: A nutritional and environmental diet optimisation study. Global Public Health, 2021; 1-14.
CrossRef - Kanellopoulos A., Gerdessen J. C., Ivancic A., et al. Designing healthier and acceptable diets using data envelopment analysis. Public Health Nutrition: 2020; 23(13). doi:10.1017/S1368980019004774, 2290-2302.
CrossRef - Maillot M., Darmon N., & Drewnowski A. Are lowest-cost healthful food plans culturally and socially acceptable? Public Health Nutrition: 2010; 13(8), 1178 – 1185.
CrossRef - Colombo P. E., Patterson E., Elinder L. S., et al. Optimizing School Food Supply: Integrating Environmental, Health, Economic, and Cultural Dimensions of Diet Sustainability with Linear Programming. International Journal of Environmental Research and Public Health, 2019; 16, 3019; doi:10.3390/ijerph16173019., 1-18.
CrossRef - Faksová K., Brázdová Z. D., Robertson A. et al. Nutritionally adequate food baskets optimised for cultural acceptability as basis for dietary guidelines for low-income Czech families. Nutrition Journal, 2019; 18:84, https://doi.org/10.1186/s12937-019-0510-y.
CrossRef - Sugimoto M., Temme E. H., Biesbroek S., et al. Exploring culturally acceptable, nutritious, affordable, and low climate impact diet for Japanese diets: Proof of concept of applying a new modelling approach using Data Enveloping Analysis. The British Journal of Nutrition, 2022.
CrossRef - FAO. The FAO food composition table for West Africa, 2019.
- Stadlmayr, Barbara., Food and Agriculture Organization of the United Nations., et al. West African food composition table = Table de composition des aliments d’Afrique de l’Ouest. Food and Agriculture Organization of the United Nations, 2012.
- Ghana Statistical Service. Consumer Price Index (CPI), 2023
- Institute of Medicine. Dietary reference intakes for Vitamin C, Vitamin E, Selenium, and carotenoids. Washington DC. The National Academies Press, 2000; https://doi.org/10.17226/9810.
CrossRef - Institute of Medicine. Dietary reference intakes for energy. Washington DC. The National Academies Press, 2001; https://doi.org/10.17226/26818.
CrossRef - Institute of Medicine. Dietary reference intakes for calcium and Vitamin D. Washington DC. The National Academies Press, 2011; https://doi.org/10.17226/13050.
CrossRef - National Academies of Sciences, Engineering and Medicine. Dietary reference intakes for sodium and potassium. Washington DC. The National Academies Press, 2019; https://doi.org/10.17226/25353.
CrossRef - National Academies of Sciences, Engineering, and Medicine. Dietary reference intakes for energy. Washington DC. Academies Press, 2023; https://doi.org/10.17226/26818.
CrossRef - MoFA & UGSPH. Food-Based Dietary Guidelines. 2023; Accra, Ghana.
- Suri D. J., Tano-Debrah K. & Ghosh S. A. Optimisation of the nutrient content and protein quality of cereal-legume blends for use as complementary foods in Ghana. Food and Nutrition Bulletin, 2014; Vol. 35, no. 3.
CrossRef - De Carvalho I. S. T., Granfeldt Y., Dejmek P. et al. From diets to foods: Using linear programming to formulate a nutritious, minimum-cost porridge mix for children aged 1 to 2 years. Food and Nutrition Bulletin, 2015; Vol. 36, no. 1, pp. 75–85.
CrossRef - Wilson N., Nghiem N., Mhurchu N., et al. Foods and dietary patterns that are healthy, low-cost, and environmentally sustainable: A case study of optimisation modeling for New Zealand. Plos One, 2013; Vol. 8, Issue 3, 1 – 10.
CrossRef - Lauk J., Nurk E., Robertson A. et al. Culturally optimised nutritionally. Adequate food baskets for dietary guidelines for minimum wage Estonian families. Nutrients, 2020; 12, 2613; pp. 1–15, doi:10.3390/nu12092613.
CrossRef - Pimentel D., Berger B., Filiberto D., et al. Water resources: Agricultural and environmental issues. Bioscience, 2008; 54(10), 909-918.
CrossRef - Centers for Disease Control and Prevention (CDC) Eat more, weigh less? How to manage your weight without being hungry. 2021; Retrieved from https://www.cdc.giv/healthyweight/healthy eating/fruits vegetables.html on 18th April 2023 at 11:21.
- Willet W., Rockstrom J., Loken B., et al. Food in the Anthropocene: the EAT-Lancet Commission on healthy diets from sustainable food systems. The Lancet Commissions, 2019; Vol. 393, doi:10.1016/S-0140-67S6(18)31788-4, 447-492.
- Healthy diet. 2018; Retrieved from https://www.who.int/dietphysicalactivity/publications/trs916/en/ on 3rd April 2023 at 10:45.
- Harvard School of Public Health. Fats and cholesterol. 2023; Retrieved from https://www.hsph.harvard.edu/nutritionsource/what-should-you-eat/fats-and-cholesterol/ on 25th June 2023 at 23:33.
- Omari R., Quorantsen K. E., & Omari P. K. Nutrition knowledge and food consumption practices and barriers in rural Ghana: The case of foods for preventing Vitamin A and iron deficiencies. African Journal of Food, Agriculture, Nutrition and Development, 2017; Vol. 17, No. 1, 11639-11656.
CrossRef - Boyd S. & Vandenberghe L. Convex optimisation. Cambridge University Press, 2004.
CrossRef - Coomson J. B., & Aryeetey R. Scoping review of diet-related health outcomes and associated risk factors in Ghana. African Journal of Food, Agriculture, Nutrition and Development, 2022; Volume 22, No. 2.
CrossRef - Ogedengbe O. O., Aihie O. O., Okhaeifo M., et al. In vitro buffering capacity of some Nigerian cereals, legumes, and starchy staples. NISEB Journal, 2017; Vol. 17, No. 3, 119-124.
Abbreviations List
FAO – Food and Agriculture Organisation,
FBDG – Food Based Dietary Guideline,
MoFA – Ministry of Food and Agriculture,
UGSPH – University of Ghana School of Public Health,
GHS – Ghana Cedis,
PUFAs – Poly unsaturated fatty acids,
CPI – Consumer price index
Accepted on: 17 Jul 2025
Second Review by: Anuja Mohile
Final Approval by: Dr. Nurul Huda


Web of Science Coverage
Emerging Sources Citation Index (ESCI)
2024 Journal Impact Factor: 1.1
Scopus Journal Metrics
CiteScore 2024: 1.9
CiteScore Details
Sustainable Nutrition: Food Systems, Nutrient Retention, and Public Health Impact
![]()
This journal is a member of, and subscribes to the principles of, the Committee on Publication Ethics (COPE)


