Assessment of Clinical Outcome in Children with Severe Thinness on Medical Nutrition Therapy at 8 Weeks and 6 Months
Dr Vishal D. Sawant1
, , , 1Department of Pediatrics, TNMC and BYL Nair Hospital, Mumbai, India.
2Department of Pediatrics, Lokmanya Tilak Municipal Medical College and General Hospital, Mumbai, India.
Corresponding Author Email: varun2201@gmail.com
DOI : http://dx.doi.org/10.12944/CRNFSJ.9.2.19
Download this article as:
![]()
The term malnutrition involves both over nutrition, accompanying with overweight, obesity, and under-nutrition including acute and chronic malnutrition as well as micronutrient deficiencies. The present study was undertaken to assess clinical outcome at 8 weeks and 6 months in children with Severe Thinness on Medical Nutrition Therapy (MNT). A total of 52 severe thinness (ST) children were enrolled and given MNT. The anthropometry was recorded at every visit and analyzed at two time points viz.8 weeks and 6 months. The body mass index has been measured using formula: weight (kg)/height(metre)2. Mean weight on enrolment was 15.85±4.08 kg. At 8 weeks, mean weight was 17.35±4.55 kg and at 6 months it was 19.33±5.12 kg. Mean height on enrolment was 114.33±14.06 cm while at 8 weeks was 115.27±14.06 cm and at 6 months was 120.21±15.29 cm. Mean BMI on enrolment was 11.92±0.44kg/m2 while at 8 weeks it improved to 12.89±0.67kg/m2; at 6 months, it continued improved to 13.26±0.96kg/m2. Rate of weight gain from enrolment to 8 weeks was 1.67 grams/kg/day and from 8 weeks to 6 months was 0.36 gm/kg/day (P<0.001). At end of 8 weeks, in 73.33% subjects BMI improved to thin and 17.8% became normal while 8.9 % continued to remain ST. At 6 months, 22.22% remained ST, 33.33% subjects remained thin and 44.44% became normal. Improvement in mean weight and mean BMI as well as rate of weight gain was significant indicating the role of indigenously prepared MNT in improving acute malnutrition.
KEYWORDS:Anthropometry; Body Mass Index; Medical Nutrition Therapy; Ready to use Therapeutic Food; Severe Thinness
Introduction
The term malnutrition is multidimensional. It involves both overweight and obesity-related overnutrition and under nutrition-related various conditions including acute as well as chronic malnutrition and deficiencies in micronutrients. Acute malnutrition arises from abrupt declines in food consumption or changes in nutritional quality and may have an underlying pathological cause. Acute malnutrition or wasting is defined using anthropometric cut offs and clinical signs.1Reducing child mortality is highly dependent on reducing malnutrition, which is directly or indirectly responsible for 35 percent of deaths amongst children younger than 5 years.2
The following -3SD cut-off for weight-for – height categorises 2 to 4 times more children compared to the NCHS (National Center for Health Statistics) reference by using the WHO child growth criteria to classify the Seriously Acutely Malnourished (SAM) among children aged 6-59 months. Children above the age of 59 months, acute malnutrition are classified by WHO as Thinness and Severe Thinness (ST). Thinness is described as percentage of defined population with a body mass index (BMI) between < – 2SD and ≥-3 SD below the median according to the WHO child growth standards.3,4 BMI less than -3 SD were designated as Severe Thinness. The present study was conducted with the aim to assess clinical outcome and change in nutritional status in children with severe thinness on medical nutrition therapy at 8 weeks and 6 months.
Material and Methods
This prospective, observational study was performed at Paediatric ward in a tertiary care centre and urban health centre attached to it in Mumbai, Maharashtra, India for a period of 18 months. The study was started after institutional ethics committee clearance was obtained (ref no D0201743 dated 01st March 2017). The subject’s parent/guardian was issued a patient information sheet that had explained the study details. Written informed consent from parent/guardian and assent of subject was taken. Demographic details and chief complaints like fever, weight loss, cough, diarrhoea, any other were noted in predesigned proforma. Past history of tuberculosis/contact was enquired.
Clinical examination was done with special attention to anthropometry i.e. weight and height. The weight was recorded using a standard electronic weighing scale with accuracy of 10 gm. The height measurement was performed using a 1 mm precision portable stadiometer.
The body mass index has been measured using formula: weight (kg)/height(metre)2and nutritional status was categorized as per WHO 2007 standard growth charts. Malnutrition was classified according to the WHO guidelines taking only BMI parameter between five to twelve years age group. BMI<-3 SD were designated as Severe Thinness and formed the potential study population. All children were subjected to the appetite test5. They were given the amount of Medical Nutrition Therapy to be eaten in one seating as per appetite test chart5. If they eat the minimum necessary amount of MNT, they were considered as pass. All Severely Thin (ST) children were enrolled in the study on passing the appetite test and started on medical nutrition therapy (MNT) for 8 weeks. MNT was given daily for 8 weeks according to MNT delivery chart5. Those with chronic illness, on nutritional supplements, known immune-compromised state, TB and those who failed appetite test were excluded from the study.
These children were followed up weekly for a period of 8 weeks and monthly there- after for a period of 4 months. The anthropometric data was recorded at every visit and analysed at two time points viz.8 weeks and 6 months. All other caregivers, along with good feeding practices, were advised on dietary criteria and switched to a home-based diet following 8 weeks. MNT or Ready-to-Use Therapeutic Food (RUTF) is also an energy-dense, fortified micronutrient paste commonly used for therapeutic feeding in children with SAM. MNT is indigenously prepared in our unit which met the WHO standards for RUTF composition6. Their effects in ST children are not studied widely. Steps involved are fine mixing of powdered sugar (28%), skimmed milk powder (24%), soybean oil (20.8%), Aflatoxin tested peanut paste (25%), emulsifier and micronutrients (2%) as per WHO specifications. Then grinding to achieve a particle size upto 300 micron and packaging with nitrogen flush. One sachet of 100 grams provides 560 kcal and 14.6gm of proteins. It provides all the nutrients (macro as well as micro) required for recovery. It has a decent shelf life, and isn’t easy to spoil. MNT / RUTF is not dependent on water, the risk of growth of bacteria is quite small, and can be used at household level without refrigeration. It is liked by kids. Amount of MNT to be consumed is decided as per MNT delivery chart5. Composition of MNT is given in table 1A and 1B.
Table 1A: Composition of Medical Nutrition Therapy MNT (RUTF)
| Ingredients | % Weight |
| Peanut paste | 25 |
| Skimmed Milk Powder | 24 |
| Powdered Sugar | 28 |
| Soyabean Oil | 20.8 |
| Micronutrient Mix | 1.6 |
| Emulsifiers | 0.6 |
Table 1B: Nutrient Composition of Medical Nutrition Therapy (MNT) as per WHO Recommendation.12
| Nutrient per 100 gm of MNT | |
| Energy | 560 kcal |
| Protein | 14.6 g |
| Carbohydrate | 49 g |
| Fat | 34.5 g |
| Sodium | 135 mg |
| Potassium | 1220 mg |
| Calcium | 578 mg |
| Phosphorous | 288 mg |
| Magnesium | 85 mg |
| Iron | 12 mg |
| Zinc | 12 mg |
| Copper | 1.5 mg |
| Selenium | 20 mcg |
| Iodine | 80 mcg |
| Vitamin A | 1.1 mg |
| Vitamin D | 17.1 mcg |
| Vitamin E | 20.6 mg |
| Vitamin K | 21 mcg |
| Vitamin B1 | 0.6 mg |
| Vitamin B2 | 1.9 mg |
| Vitamin C | 53 mg |
| Vitamin B6 | 0.6 mg |
| Vitamin B12 | 1.76 mcg |
| Vitamin B9 | 210 mcg |
| Vitamin B3 | 5.31 mg |
| Vitamin B5 | 3.1 mg |
| Vitamin B7 | 66 mcg |
Sample size of the study was determined using SAS 9.2 package. Minimum sample size of 43 will have 80% power to detect change of mean 5 and SD 3.5 at alpha=0.05. All the data was analyzed using version 15.0 of the SPSS programme. For statistical analysis, the Student t test was used and a probability value of less than 0.05 was considered as significant.
Results
In the present study, 52 subjects were enrolled, with equal distribution of 26 boys and 26 girls. Predominant age group in boys was 7 years (26.9%) & in girls 6 years (23.1%), (Table 2).
Table 2: Age and Sex Distribution on Enrolment.
| Age (in Years) | Boys (%) | Girls (%) | Total |
| 5-6 | 4 (15.4%) | 4 (15.4%) | 8 (15.4%) |
| 6-7 | 3 (11.5%) | 6 (23.1%) | 9 (17.3%) |
| 7-8 | 7 (26.9%) | 4 (15.4%) | 11 (21.2%) |
| 8-9 | 6(23.1%) | 2 (7.7%) | 8 (15.4%) |
| 9-10 | 5 (19.2%) | 3 (11.5%) | 8 (15.4%) |
| 10-11 | 0 (0%) | 3 (11.5%) | 3 (5.8%) |
| 11-12 | 1 (3.8%) | 4 (15.4%) | 5 (9.6%) |
| Total | 26 (100%) | 26 (100%) | 52 (100%) |
The baseline and follow-up features are shown in table 3 and described below.
Mean weight, Mean height, Mean BMI on enrolment for all subjects was 15.85 ±4.08 kg, 114.33±14.06cm & 11.92±0.44kg/m2 respectively. After 8 weeks of completing MNT, Mean weight for all subjects was 17.35±4.55 kg with t value of 11.1 and p value of <0.001 which was statistically significant and at 6 months was 19.33±5.12 kg with t value of 3.6 and p value = 0.001 which was also statistically significant.
Table 3: Baseline and Follow-Up Characteristics.
| Parameter (A) | On Enrolment( N = 52) | 8 weeks follow-up(N = 45) | 6 months follow-up( N =27) |
| Weight (kg) | 15.85kg | 17.35 kg | 19.33 kg |
| Height (cm) | 114.33 cm | 115.27 cm | 120.21cm |
| BMI (kg/m2) | 11.92 kg/m2 | 12.89 kg/m2 | 13.26 kg/m2 |
| Parameter (B) | Enrolment to 8 weeks | 8 weeks to 6 months | Enrolment to 6 months |
| Mean weight gain (Kg) | 1.5 kg | 1.98 kg | 3.48 kg |
| Rate of weight gain (gms/kg/day) | 1.67 gms/kg/day | 0.36 gms/kg/day | 0.84 gms/kg/day |
| Change in BMI | 0.97 kg/m2 | 0.37 kg/m2 | 1.34 kg/m2 |
The rate of weight gain was calculated as grams of weight gain per kilogram body weight/day. From enrolment to 8 weeks, it was 1.67 grams/kg/day and from 8 weeks to 6 months, it was 0.36 gm/kg/day (p value of <0.001) while Overall rate of weight gain from enrolment to 6 months was 0.84 gm/kg/day.
Mean height on enrolment was 114.33±14.06 cm while at 8 weeks mean height was 115.27±14.06 cm with t value of 3.2 and p value of <0.001 which is Statistically significant, while on follow up at 6 months mean height was 120.21±15.29 cm with t value of 8.2 and p value of <0.001 which was also statistically significant.
Mean BMI on enrolment was 11.92±0.44kg/m2 while at 8 weeks it improved to 12.89±0.67kg/m2 with t of 10.5 and p value of < 0.001 which was statistically significant. While at 6 months, it continued to improve to 13.26±0.96kg/m2 with t value of 1.5 and p value=0.14 which was statistically not significant, (Table 3). So, a change in BMI from 8 weeks to 6 months was not significant. On assessing the change in nutritional status on WHO BMI charts, at end of 8 weeks: 17.8% subjects became normal, 73.33% subjects improved to thin and 8.9% subjects continued to remain ST. At 6 months, 44.44% subjects became normal, 33.33% subjects remained thin and 22.22% subjects became ST, (Table 4). Here the conclusion cannot be derived because of small sample size. (Graph 1: Depicting the outcome at 8 weeks and 6 Months)
Table 4: Nutritional Outcome at 8 Weeks and 6 Months.
| Outcome as per BMI | At 8 Weeks (N = 45) | At 6 Months (N = 27) |
| Remained Severely Thin | 8.9% | 22.22% |
| Improved to Thin | 73.33% | 33.33% |
| Normal | 17.8% | 44.44% |
| TOTAL | 100% | 100% |
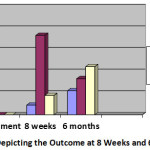 |
Graph 1: Depicting the Outcome at 8 Weeks and 6 Months. |
Discussion
Malnutrition results from the complex interplay of a range of factors. The Energy-dense, micronutrient enriched pastes being used in therapeutic feeding are ready-to-use therapeutic foods (RUTF). RUTF is recommended for children with BMI for age< -3 SD as per WHO recommendation. Composition of MNT is similar to that of WHO recommended RUTF and therefore, it can only be given to severely malnourished child. RUTF is not indicated in normal children so such control is not ethical.
These soft foods are a heterogeneous mixture of lipid-rich foods with a nutrient profile used for WHO-recommended clinical inpatient feeding programmes.3,4 RUTF ‘s emergence has revolutionised the care of children with extreme acute malnutrition.3,4 Studies carried out by Cilberto et al7 on Comparative analysis of home-based therapy with ready-to-use nutritional food in the care of malnourished Malawian children with standard therapy: a controlled, clinical efficacy study revealed weight gain rates in SAM children were 1.8 (95 % CI: 1.5, 2.1) times higher amongst the children who received home-based therapy with RUTF compared to those receiving standard therapy. Similar studies carried out by Thapa et al8 on Effectiveness of ready-to-use therapeutic foods in the age group of 6 months to 60 months for serious acute malnutrition reported a significant increase in mean weight from 6.44±1.60 kg to 7.97 ± 1.8 kg (p<0.001) This can be attributed to the energy dense formula of MNT rich with micronutrients which can stimulate appetite and lead to increased appetite and increased weight gain. Rate of weight gain (gm/kg/day) is an important criteria used by various studies & national programmes to determine the efficacy of nutritional supplementation (RUTF/home based supplementation).
The rate of weight gain from enrolment to 8 weeks was 1.67 grams/kg/day and between 8 weeks and 6 months was 0.36 gm/kg/day showing significant weight gain indicating the role of MNT in improving acute malnutrition. The study of contrasting home-based therapy with ready-to-use standard therapy food in the treatment of malnourished Malawian children by Patel et al9 shows a weight gain of 3.5 gm/kg/day in RUTF group as compared to 2 gm/kg/day in standard therapy group over a period of 8 weeks. Similar study carried out by Jadhav et al6 showed rate of weight gain to be 4.5 gm/kg/day on MNT6. The rate of weight gain was 1.08 gm/kg/day greater in the RUTF group compared to the CSB (corn soy blend based) pre-mix group in a study carried out by Nackers et al10 in Efficacy of ready-to-use therapeutic food for the treatment of childhood mild acute malnutrition in Niger compared to a pre-mix based on maize / soy blend. Studies carried out by Brown et al11 in comparing the suitability of Two Ready-to-Use Therapeutic Foods by HIV +ve Patients in Vietnam revealed significantly higher gains in BMIZ (0.35 vs. 0.16, p=0.036) in children who consumed the two RUTFs over a 4-week period than the children who did not receive any RUTF. Children enrolled were between 3 and 7 years of age. Further studies may be required to study the long-term effects of MNT to substantiate this finding. Literature on use of MNT/RUTF is lacking in the age group of 5-12 yrs.
Conclusions
Improvement in nutritional status was observed in 91.1 % of subjects at the end of 8 weeks. Thus MNT/RUTF helps in improving acute malnutrition in Severe Thin children in the age group of 5 -12 yrs. It may play a role in chronic malnutrition by improving height but further studies are required on a long-term scale to come to a final conclusion.
Limitations of Study
- Sample size: sample size is too less to conclude the impact of MNT at 6 months.
- Follow up: Though 86% of subjects followed up upto 8 weeks due to active intervention being carried out in the form of MNT, 48% subjects were lost to follow up at 6 months probably due to lack of active intervention and only passive intervention in the form of counseling of good feeding practices and a home-based diet.
- Pilot study: this is a pilot study carried out to study the impact of RUTF in severely thin children.
- Lack of references: Studies on use of RUTF have been carried out in SAM children and no reference study has been carried out in severely thin children.
Recommendation
RUTF should be considered as a standard of care for Acute Malnutrition in age group of 5-12 years.
Funding Source
TATA motors Pvt Ltd (India).
Acknowledgement
Dean LTMMC &GH (Lokmanya Tilak Municipal Medical College & General Hospital) & Dr. Radha G. Ghildiyal Head of the Department of Pediatrics (Lokmanya Tilak Municipal Medical College & General Hospital).
Conflicts of Interest
The authors do not have any conflict of interest.
References
- Lenters L., Wazny K., Bhutta Z. A. Management of Severe and Moderate Acute Malnutrition in Children. In: Black RE, Laxminarayan R, Temmerman M, Walker N, eds. Reproductive, Maternal, Newborn, and Child Health: Disease Control Priorities, Third Edition (Volume 2). Washington (DC): The International Bank for Reconstruction and Development / the World Bank; 2016.
CrossRef - Ahmed T., Hossain M., Mahfuz M., Choudhury N., Hossain M. M., Bhandari N., Lin M. M,, Joshi P. C,, Angdembe M. R., Wickramasinghe V. P., Hossain S. M. Severe acute malnutrition in Asia. Food nutri bull. 2014;35(2):S14-26.
CrossRef - WHO child growth standards and the identification of severe acute malnutrition in infants and children A Joint statement by World Health Organisation and United Nations Childrens Fund.
- Malnutrition O. S. Updates on the Management of Severe Acute Malnutrition in Infants and Children.
- https://motherchildnutrition.org/resources/pdf/mcn- ethiopia-sam-guidelines.pdf.
- Jadhav AR, Karnik P, Fernandes L, Fernandes S, Shah N, Manglani M. Indigenously Prepared Ready-to-use Therapeutic Food (RUTF) in Children with Severe Acute Malnutrition. Indian Pediatr. 2019 Apr 15;56(4):287-293. PMID: 31064896.
CrossRef - Ciliberto M. A., Sandige H., Ndekha M. J., Ashorn P., Briend A., Ciliberto H. M., Manary M. J. Comparison of home-based therapy with ready-to-use therapeutic food with standard therapy in the treatment of malnourished Malawian children: a controlled, clinical effectiveness trial. The Am J Clin nutri. 2005;81(4):864-70.
CrossRef - Thapa B. R., Goyal P., Menon J, Sharma A. Acceptability and efficacy of locally produced ready-to-use therapeutic food nutreal in the management of severe acute malnutrition in comparison with defined food: a randomized control trial. Food nutri bull. 2017;38(1):18-26.
CrossRef - Patel D., Gupta P., Shah D., Sethi K. Home-base rehabilitation of severely malnourished children in resource poor setting. Indian Pediatr. 2010;47:694-701.
CrossRef - Nackers F., Broillet F., Oumarou D., Djibo A., Gaboulaud V, Guerin PJ, Rusch B, Grais RF, Captier V. Effectiveness of ready-to-use therapeutic food compared to a corn/soy-blend-based pre-mix for the treatment of childhood moderate acute malnutrition in Niger. J trop pedia. 2010;56(6):407-13.
CrossRef - Brown M., Nga T. T., Hoang M. A., et al. Acceptability of Two Ready-to-Use Therapeutic Foods by HIV-Positive Patients in Vietnam. Food Nutr Bull. 2015;36(2):102‐110.
CrossRef - Jadhav A, Dias B, Shah N, Fernandes L, Fernandes S, Surve A, Dhami-Shah H, Murty S, Joshi N, Manglani M. A Randomized Controlled Facility Based Trial to Assess the Impact of Indigenously Prepared Ready to Use Therapeutic Food (RUTF) for Children with Severe Acute Malnutrition in India. Pediatr Oncall J. 2016;13: 93-98. doi: 10.7199/ped.oncall.2016.61.
CrossRef
Accepted on: 07 May 2021
Second Review by: Dr. Sandeep Poddar Malaysia and Venipriyadharshini loganathan India
Final Approval by: Dr. Neha Sanwalka


Web of Science Coverage
Emerging Sources Citation Index (ESCI)
2024 Journal Impact Factor: 1.1
Scopus Journal Metrics
CiteScore 2025: 2.6
CiteScore Details
Sustainable Nutrition: Food Systems, Nutrient Retention, and Public Health Impact
![]()
This journal is a member of, and subscribes to the principles of, the Committee on Publication Ethics (COPE)


