

Introduction
The risk of non-communicable diseases (NCDs) like obesity, type 2 diabetes mellitus, and cardiovascular disease is on the rise. One of the contributing factors is unhealthy dietary food habits especially increased intake of highly refined carbohydrates 1. After digestion of ingested carbohydrates, it is absorbed from the small intestine, and glucose, the main dietary component, is transported to the liver via the portal vein. In healthy persons, plasma glucose levels are maintained within a narrow range in between meals. The rate of glucose entering the circulation and the rate of glucose leaving are tightly regulated, so that change according to the food supply, with the liver playing a major role in this regulation 2. In general practice, individuals were advised to eat more complex carbohydrates (i.e., polysaccharides) rather than a simple one. It was assumed that starchy foods would lead to smaller increases in blood glucose than sugary foods 3. Nevertheless, it was later found that the glycemic response for complex carbohydrates varies considerably. Therefore, the concept of glycemic index (GI) was developed in 1981 by Jenkins and co-workers in order to categorize dietary carbohydrates based on their overall effect on postprandial blood glucose concentration relative to a referent carbohydrate, generally pure glucose, 4. Low GI foods (GI≤55 on the glucose scale) are digested slowly and release glucose gradually into blood, giving rise to low blood glucose peaks, which demand a lower insulin response compared to high GI foods (GI≥70 on the glucose scale) 5. This is expected to decrease the incidence of insulin resistance and the development of risk factors such as obesity, and hypertension, the key factors responsible for the development of type 2 diabetes mellitus, and cardiovascular diseases 6. Indeed, studies have shown that consumption of low GI diets decreases obesity7-9, lower the risk of diabetes type 2, reduces insulin resistance, and risk of coronary heart diseases 3, 6.
Recognizing its importance, several International Tables of Glycemic Index were developed and updated over the years 10-12. Indeed, there has been some discussion as to the necessity of including GI in dietary recommendations 13, and the International Scientific Consensus Summit from the International Carbohydrate Quality Consortium (ICQC)14 recommended that Glycemic index (GI) should be included as a valid methodology complementing other dietary aspects so that low GI diets are recommended for prevention and treatment of diabetes, heart disease and obesity.
However, more recently, there have been few reports on the effect of age, body mass index (BMI), and gender on GI15-18.
Therefore, if GI is to be used, it is important to confirm that the published GI of the food is applied to both genders, as well as across age and BMI spectrum. Hence, in this study, we aimed to investigate the effect of gender difference on GI in healthy, normal BMI, young individuals of both genders.
Methods
Research Design and Selection of Participants
The study design was based on recognized international methodology5, 19, 20. Accordingly, a sample size of 35 individuals was aimed to ensure that at least 10 males and 10 females were included in the final calculation of the GI. All experimental procedures were approved by the “Biomedical Ethics Research Committee” of King Abdulaziz University (KAU) Reference No 211-19. 16, 17.
Healthy, non- smoking, adults (18 – <35 years of age), of normal weight, were recruited, by announcement and personal contact, from the staff and student population of KAU, in addition to their relatives and friends. They were screened for suitability before final inclusion.
All subjects were provided with a written informed consent form, and each subject consented to provide all the needed information to undergo drawing blood by signing the form.
To ensure suitability, volunteers underwent an interview based on a structured questionnaire (initial screening), which included questions on eating habits, and medical and family history of the participants. Volunteers were excluded if they were smokers, reported having a history of dysglycemia, were using any medication other than oral contraceptives, undergoing any specific diet, and/or suffering from any illnesses or diseases or food allergies. Based on the outcome, suitable participants were asked to come the next morning while fasting for at least 10 hours. Blood samples were obtained in citrate tubes for measurements of plasma glucose, and in plain tubes for estimation of serum lipid profile and liver function tests. The Subject was then given a fixed meal, prepared by the research team, and consisting of a cheese sandwich and a juice box equivalent to 75 gm of glucose, and a 2-hour postprandial blood sample was taken for measurements of glucose. In addition, weight, height, and blood pressure measurements were obtained. Body mass index (BMI) was calculated by the equation: weight (kg)/ height (m)2
Participants were excluded if they were under or overweight (BMI <18.5 or > 24.9), showed abnormal fasting and/or 2 hr postprandial blood sugar according to the American diabetes association guidelines21, abnormal liver function tests according to the Saudi reference interval 22, dyslipidemia according to international guidelines 23, 24, and /or abnormal blood pressure according to the Joint National Committee on Prevention, Detection, Evaluation, and Treatment of High Blood Pressure (JNC) VII report25.
Study Procedure for GI Estimation
The procedure was based on recommendations from a review of methodologies 5. Participants were requested to come for 4 visits on 4 separate days (2 to 3 days apart). The night before each visit, participants were instructed to eat their regular meals and then to fast for at least 10 hours overnight. Subjects were also instructed to avoid any unusual levels of food intake or physical activity before each visit.
On arrival, a peripheral IV cannula was inserted by a trained phlebotomist for blood extraction. Two fasting blood samples were first collected (0 min and 5 min). After the second fasting sample was obtained, participants were served with a glucose solution containing 50 gm of pure glucose (Trutol 50, Thermo Fisher Scientific, USA) in the first two visits, and a solution containing 50 gm of sucrose (Al Osra Pure white cane sugar, United Sugar Company, KSA) in the next two visits. Blood samples were collected at 15,30,45,60,90,120 minutes after the sugar consumption. All blood samples were collected in citrate tubes, and obtained plasma was stored at -80 ˚C until time of analysis. Following biochemical estimations, curves representing changes in plasma glucose level following the ingestion of glucose and sucrose were constructed for each participant, and the area under each curve (AUC) was calculated. The average (± standard deviation-SD) areas under the curve for males and females were calculated based on the recommended methodology5.
Biochemical Assays
Serum and plasma samples were analyzed in the Clinical Chemistry laboratory unit at the ‘‘National Guard Hospital’’ in Jeddah. Plasma glucose, total serum cholesterol (TC), high-density lipoprotein cholesterol (HDL-C) and triglycerides (TG) levels, as well as liver enzymes, were measured by spectrophotometric methods using ABBOTT, Architect c8000 auto-analyzer. LDL-C was calculated using the Friedewald equation 26.
Statistical Methods
Statistical analysis was carried out using SPSS; version 21 released June 2018. Descriptive statistics were calculated for all measured and estimated parameters and were presented as mean ± SD. Demographic, biochemical, and clinical characteristics of male and female participants were compared using an independent student’s t-test.
The incremental area under the curve (AUC) for glucose and sucrose was calculated for each participant using GraphPad Prism 8, then averaged for all males and all females separately. Incremental Area Under the curve (iAUC) was calculated according to the recommendation of the Food and Agriculture Organization (1998)27 and the glycemic index methodology 5 using the following 2 equations.
iAUC between 2 time points = (Gx+Gx+1)/2 X (Tx-1 -Tx) and
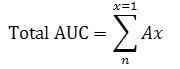
Where Gx is the Glucose concentration at a time point, Gx+1 is the Glucose concentration at the next time point, Tx-1 -Tx is the time interval between two glucose readings, Ax is the AUC for the specific time interval. Areas below baseline were excluded from the calculation. Glycaemic Index was calculated for each subject by dividing their incremental area under the curve for sucrose by the incremental area under the curve of the reference sugar (Glucose) and multiply by 100
![]()
The average (±SD) GI was calculated for the whole study sample and for males and females separately. Unpaired Student’s T-test was used to compare means of measured GI between males and females.
Results
A total of 35 apparently healthy adults were recruited initially. However, following anthropometric and blood pressure measurements, five were excluded, leaving 30 volunteers (16 male and 14 female). Following biochemical analysis, two were found to be prediabetic, one had elevated liver enzymes, and samples from 6 subjects were incomplete and had to be excluded. Therefore, a total of 11 men and 10 women were included in the study. The characteristics of studied males and females are presented in Table 1.
Table 1: Demographic, Anthropometric, Clinical and Biochemical Characteristics of Studied Subjects
| Male(N=11)(mean ±SD) | Female(N=10)(mean ±SD) | Total(N=21)(mean ±SD) | P-ValueMales vs Females | |
| Age (years) | 21.6 ± 2.6 | 22.8±5.8 | 22.2 ± 4.3 | 0.510 |
| BMI (Kg/m2) | 23.2 ± 1.5 | 23.5 ± 1.3 | 23.4 ± 1.4 | 0.585 |
| SBP (mmHg) | 126 ± 13 | 116 ± 9 | 121 ± 12 | 0.040 |
| DBP (mmHg) | 72 ± 10 | 72 ± 5 | 72 ± 8 | 0.934 |
| FPG (mmol/L) | 4.2 ± 0.3 | 4.1 ± 0.2 | 4.1 ± 0.2 | 0.250 |
| PBG (mmol/L) | 3.9 ±1.0 | 4.0±1.0 | 4±1.02 | 0.987 |
| Total Cholesterol (mmol/L) | 4.1 ± 0.5 | 4.2 ± 0.7 | 4.2± 0.6 | 0.628 |
| Triglyceride (mmol/L) | 0.6 ± 0.1 | 0.5 ± 0.2 | 0.6 ± 0.1 | 0.332 |
| HDL-C (mmol/L) | 1.3 ± 0.1 | 1.6 ± 0.2 | 1.4 ± 0.2 | 0.001 |
| LDL-C (mmol/L) | 2.7 ± 0.4 | 2.5 ± 0.5 | 2.6 ± 0.5 | 0.457 |
| Albumin (g/L) | 46.3 ± 2.6 | 44.4 ± 2.7 | 45.3 ± 2.8 | 0.084 |
| AlkP (U/L) | 81.5 ± 17.1 | 62.6 ± 18.3 | 71.2 ± 19.9 | 0.016 |
| ALT (U/L) | 16.4 ± 8.2 | 9.9 ± 2.3 | 13.0 ± 6.6 | 0.012 |
| AST (U/L) | 23.1 ± 4.9 | 22.3 ± 16.0 | 22.7 ± 11.8 | 0.870 |
| GGT (U/L) | 18.8 ± 11.2 | 12.3 ± 6.7 | 15.4 ± 9.5 | 0.092 |
| BiliT (µmol/L) | 12.1 ± 4.4 | 8.9 ± 4.1 | 10.4 ± 4.5 | 0.075 |
| TP (g/L) | 75.3 ± 4.6 | 73.4 ± 5.3 | 74.3 ± 5.0 | 0.361 |
BMI: Body mass index, SBP: Systolic blood pressure, DBP, Diastolic blood pressure, FBG: average fasting Plasma glucose for the 4 visits, PBG: postprandial glucose, HDL-C: High-density lipoprotein -cholesterol, LDL-C: Low-density lipoprotein -cholesterol, AlkP: Alkaline phosphatase, ALT: Alanine aminotransferase, AST: aspartate aminotransferase, GGT: Gamma-glutamyl transferase, BiliT: total bilirubin, TP: Total protein. Significant P values are shown in bold font.
As planned, there was no significant difference between means of males and those of females in age or BMI. All biochemical measurements were within the Saudi reference interval for normal values 22, with the means of alkaline phosphatase, and alanine aminotransferase being significantly higher in males, and mean HDL-C higher in females as expected.
The average 2 hours plasma glucose response to glucose (reference sugar) and sucrose for all the 21 studied sample is presented in Figure 1 as mean ±SD at various points.
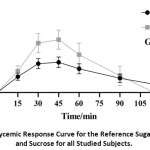 |
Figure 1: Glycemic Response Curve for the Reference Sugar (Glucose) and Sucrose for all Studied Subjects. |
Studying the difference between the male and female responses to glucose and sucrose, it was found that the response to glucose was different in males compared to females (Figure 2 A & B). In males, the response curve for the reference sugar (glucose) peaked at 30 minutes, compared to 45 minutes for females, and showed a sharper decline, with blood sugar level declining below the baseline by the end of two hours. This caused a smaller calculated AUC for the glucose and increased the GI to 77 (Figure 2 A), which is much higher than that calculated for females of 60 (Figure 2 B).
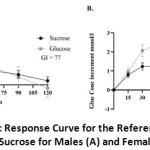 |
Figure 2: Glycemic Response Curve for the Reference Sugar (Glucose) and Sucrose for Males (A) and Females (B) |
To illustrate the difference between genders, the GI figures of males, females, and mixed population are presented in Figure 3 as mean ± (SD). There were great variations between individuals in their glycemic response curve to ingestion of either sugar, so that following calculation of GI for each subject, males, showed a wider range in GI values (SD= 34), compared to females (SD= 24).
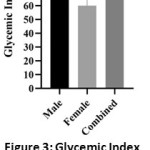 |
Figure 3: Glycemic Index of Males, Females and All Studied Subjects Presented as Mean ± SD |
Discussion
In this study, we aimed to investigate whether gender difference affects GI in healthy young adult men and women of normal BMI. According to recommendations 5, only healthy individuals should participate in measurements of GI. Therefore, great care was taken to ensure health before the final inclusion of subjects in the study, especially that it has been reported that undiagnosed prediabetes and type 2 diabetes are detected with high rates in our population 28. Since insulin sensitivity and glucose tolerance status are reported to influence the glycemic response to a food 5, subjects showing impaired glucose tolerance (prediabetes), or any condition that might affect glucose homeostasis, such as liver dysfunction or dyslipidemia, must be excluded. Therefore, during screening for suitability, fasting and 2 hours postprandial plasma glucose were estimated following the ingestion of 75 grams of glucose. Only subjects with normal glucose tolerance according to the American diabetes association guidelines 21 were included. In addition, all dyslipidemic subjects, according to international guidelines 23, 24, and those with abnormal liver function tests according to the Saudi reference interval 22, were excluded.
Therefore, even though 35 subjects were originally recruited, only 21 remained following detailed biochemical analysis. However, the remaining number of males and females (11 M and 10 F) were sufficient to conduct the study and give a reasonable degree of power and precision (80% power at a level of P <0·05 -two-tailed) according to a review of methodology 5. The same review recommended that each subject should be tested at least twice for glucose and tested food to obtain two values, and their average is used in calculating GI.
Previous studies indicate that GI is affected by age 15, 16, 29, gender 15, 30, and BMI 17, 30. In our study, only young adults (18 – <35 years of age) of normal weight (BMI 18.5- <25) were included to fulfill our aim and avoid interference. Despite rigorous selection criteria, including laboratory testing, gender difference in calculated GI was unmistakable our results even though there was no significant difference between males and females in age or BMI. The calculated GI for sucrose was 77 in males, 60 in females, and 69 for the whole study group. Reported values for GI of sucrose varied in the literature between 58 and 65 4, 31-34, with one Chinese study reported a high value of 84 35, and the value for sucrose appearing in readily available GI lists for a mixed population of males and females is 65 36, 37. All reported values were for study populations of mixed genders, unspecified age, and BMI, and a varying number of studied subjects, as well as methodology, which would explain the difference in the reported values. However, similar to our findings, studies of Japanese subjects 16, 30 reported lower glycemic index in females. In our study, higher 2-hour glucose levels were noted in women following the ingestion of glucose, while blood sugar level in men declined below the baseline by the end of two hours in most of the subjects, as well as the calculated average. This difference in the shape of the curve between men and women could be explained by the reported slower gastric emptying in women compared to men38, and would result in higher GI in men since the area under the baseline was not taken into account while calculating the area under the curve. In addition to the difference in calculated average GI for men and women, a large variation, represented as SD, between subjects was found. Therefore, when conducting a statistical comparison between the two GIs, no significant difference could be found. However, the gender difference should be acknowledged, and it is advisable to keep this in mind when preparing diabetic diets or giving dietary advice to obese and diabetic people.
Our study has many points of strength being conducted as recommended by a review of methodology 5, and including only healthy individuals following rigorous clinical and biochemical testing. Furthermore, only young persons of normal BMI were included, thus avoiding their possible effects. However, the main limitation was our small sample size, which fulfilled recommendations, but was not enough to detect statistical significance between the two genders.
Conclusion
In conclusion, our study showed that there is an apparent difference in GI between men and women, even though the difference did not reach statistical significance, most likely due to the small sample size. A larger study is needed to clarify this further and prove or disprove the need for separate GI lists for men and women.
Acknowledgments
The authors would like to thank Prof. Adel Abuzenada as the director of KFMRC, and his deputy dr. Ahmad Mirza for their support in providing the necessary facilites to conduct this work.
Funding Sources
The authors received no financial support for the research, authorship, and/or publication of this article.
Conflict of Interest
The author declares no conflict of interest.
Reference
- World Health Organization. Globalization, diets and noncommunicable diseases. 2003;
- Wahren J, Ekberg K. Splanchnic regulation of glucose production. Annu Rev Nutr. 2007;27:329-45. doi:10.1146/annurev.nutr.27.061406.093806.
CrossRef - Liu S, Willett WC. Dietary glycemic load and atherothrombotic risk. Curr Atheroscler Rep. Nov 2002;4(6):454-61. doi:10.1007/s11883-002-0050-2.
CrossRef - Jenkins DJ, Wolever TM, Taylor RH, et al. Glycemic index of foods: a physiological basis for carbohydrate exchange. The American Journal of Clinical Nutrition. 1981/03/01 1981;34(3):362-366. doi:10.1093/ajcn/34.3.362.
CrossRef - Brouns F, Bjorck I, Frayn KN, et al. Glycaemic index methodology. Nutrition Research Reviews. 2005/06 2005;18(1):145-171. doi:10.1079/nrr2005100.
CrossRef - Ludwig DS. The glycemic index: physiological mechanisms relating to obesity, diabetes, and cardiovascular disease. JAMA. May 8 2002;287(18):2414-23. doi:10.1001/jama.287.18.2414.
CrossRef - Thomas DE, Elliott EJ, Baur L. Low glycaemic index, or low glycaemic load, diets for overweight and obesity. The Cochrane Database of Systematic Reviews. John Wiley & Sons, Ltd; 2005.
CrossRef - Schwingshackl L, Hoffmann G. Long-term effects of low glycemic index/load vs. high glycemic index/load diets on parameters of obesity and obesity-associated risks: A systematic review and meta-analysis. Nutrition, Metabolism and Cardiovascular Diseases. 2013/08 2013;23(8):699-706. doi:10.1016/j.numecd.2013.04.008.
CrossRef - Schwingshackl L, Hobl LP, Hoffmann G. Effects of low glycaemic index/low glycaemic load vs. high glycaemic index/ high glycaemic load diets on overweight/obesity and associated risk factors in children and adolescents: a systematic review and meta-analysis. Nutrition Journal. 2015/08/25 2015;14(1)doi:10.1186/s12937-015-0077-1.
CrossRef - Atkinson FS, Foster-Powell K, Brand-Miller JC. International Tables of Glycemic Index and Glycemic Load Values: 2008. Diabetes Care. 2008/10/03 2008;31(12):2281-2283. doi:10.2337/dc08-1239.
CrossRef - Foster-Powell K, Holt SHA, Brand-Miller JC. International table of glycemic index and glycemic load values: 2002. The American Journal of Clinical Nutrition. 2002/07/01 2002;76(1):5-56. doi:10.1093/ajcn/76.1.5.
CrossRef - Foster-Powell K, Miller JB. International tables of glycemic index. The American Journal of Clinical Nutrition. 1995/10/01 1995;62(4):871S-890S. doi:10.1093/ajcn/62.4.871s.
CrossRef - Hare-Bruun H, Nielsen BM, Grau K, Oxlund AL, Heitmann BL. Should glycemic index and glycemic load be considered in dietary recommendations? Nutrition Reviews. 2008/09/25 2008;66(10):569-590. doi:10.1111/j.1753-4887.2008.00108.x.
CrossRef - Augustin LSA, Kendall CWC, Jenkins DJA, et al. Glycemic index, glycemic load and glycemic response: An International Scientific Consensus Summit from the International Carbohydrate Quality Consortium (ICQC). Nutrition, Metabolism and Cardiovascular Diseases. 2015/09 2015;25(9):795-815. doi:10.1016/j.numecd.2015.05.005.
CrossRef - Venn BJ, Williams SM, Perry T, Richardson S, Cannon A, Mann JI. Age-related differences in postprandial glycaemia and glycaemic index. Age and Ageing. 2011/07/27 2011;40(6):755-758. doi:10.1093/ageing/afr096.
CrossRef - Takada A, Ishii Y, Shimizu F, Ogawa M, Takao T. Gender and age differences of glycemic index in Japanese old men, young men and women. Integrative Food, Nutrition and Metabolism. 2016;4(1)doi:10.15761/ifnm.1000166.
CrossRef - Mendez MA, Covas MI, Marrugat J, Vila J, Schröder H. Glycemic load, glycemic index, and body mass index in Spanish adults. The American Journal of Clinical Nutrition. 2008/12/03 2008;89(1):316-322. doi:10.3945/ajcn.2008.26444.
CrossRef - Hawthorne G. Diabetes, the glycaemic index and older people. Age and Ageing. 2011/08/31 2011;40(6):655-656. doi:10.1093/ageing/afr116.
CrossRef - Australian Standard. AS 4694—2007-glycemic index of foods. . Standards Australia. 2007;
- International Standards Organisation. Food products–Determination of the glycaemic index (GI) and recommendation for food classification. ISO 26642:2010. https://www.iso.org/standard/43633.html
- Rossi G. Diagnosis and classification of diabetes mellitus. Diabetes Care. 2018;33(Suppl 1):S62-S69. doi:10.2337/dc10-S062.
CrossRef - Borai A, Ichihara K, Al Masaud A, et al. Establishment of reference intervals of clinical chemistry analytes for the adult population in Saudi Arabia: a study conducted as a part of the IFCC global study on reference values. Clinical Chemistry and Laboratory Medicine (CCLM). 2016/01/01 2016;54(5)doi:10.1515/cclm-2015-0490.
CrossRef - Alberti KGMM, Eckel RH, Grundy SM, et al. Harmonizing the Metabolic Syndrome. Circulation. 2009/10/20 2009;120(16):1640-1645. doi:10.1161/circulationaha.109.192644.
CrossRef - Detection NCEPEPo, Adults ToHBCi. Third report of the National Cholesterol Education Program (NCEP) Expert Panel on detection, evaluation, and treatment of high blood cholesterol in adults (Adult Treatment Panel III). National Cholesterol Education Program, National Heart, Lung, and Blood …; 2002.
CrossRef - Chobanian AV, Bakris GL, Black HR, et al. Seventh Report of the Joint National Committee on Prevention, Detection, Evaluation, and Treatment of High Blood Pressure. Hypertension. 2003/12 2003;42(6):1206-1252. doi:10.1161/01.hyp.0000107251.49515.c2.
CrossRef - Friedewald WT, Levy RI, Fredrickson DS. Estimation of the Concentration of Low-Density Lipoprotein Cholesterol in Plasma, Without Use of the Preparative Ultracentrifuge. Clinical Chemistry. 1972/06/01 1972;18(6):499-502. doi:10.1093/clinchem/18.6.499.
CrossRef - World Health Organization, Food and Agriculture Organization of the United Carbohydrates in Human Nutrition: Report of a Joint FAO/WHO Expert Consultation. 1998;(FAO Food and Nutrition Paper – 66)
- Bahijri S, Al‐Raddadi R, Ajabnoor G, et al. Dysglycemia risk score in Saudi Arabia: A tool to identify people at high future risk of developing type 2 diabetes. Journal of Diabetes Investigation. 2020/02/20 2020;doi:10.1111/jdi.13213.
CrossRef - Takao T, Ogawa M, Ishii Y, Shimizu F, Takada AJJNFS. Different glycemic resposes to sucrose and glucose in old and young male adults. 2016;6(460):2.
- Y Ishii, F Shimizu, M Ogawa, T Takao, A Takada. Gender differences in foods uptakes, glycemic index, BMI, and various plasma parameters between young men and women in Japan. Integrative Food, Nutrition and Metabolism. 2016;3(5)doi:10.15761/ifnm.1000163.
CrossRef - Lee BM, Woleve TMS. Effect of glucose, sucrose and fructose on plasma glucose and insulin responses in normal humans: comparison with white bread. European Journal of Clinical Nutrition. 1998/12 1998;52(12):924-928. doi:10.1038/sj.ejcn.1600666.
CrossRef - Matsuo T. Estimation of glycemic response to maltitol and mixture of maltitol and sucrose in healthy young subjects. Technical bulletin of the Faculty of Agriculture, Kagawa University. 2003;55:57.
- Schauberger G, Brinck U, Guldner G, Spaethe R, Niklas L, Otto H. Exchange of carbohydrates according to their effect on blood-glucose. Amer diabetes assoc 1660 duke st, alexandria, va 22314; 1977:415-415.
- Walker A, Walker BJHnCn. Glycaemic index of South African foods determined in rural blacks–a population at low risk of diabetes. 1984;38(3):215.
- Yang YX, Wang HW, Cui HM, et al. Glycemic index of cereals and tubers produced in China. World J Gastroenterol. Jun 7 2006;12(21):3430-3. doi:10.3748/wjg.v12.i21.3430.
CrossRef - Glycemic index foundation. GI and Sugar :Total Carbohydrates more important than sugars alone. Accessed 20/5/2019, https://www.gisymbol.com/gi-sugar/
- Glycemic Index for Sweeteners Sugar and Sweetener Guide. Accessed 20/5/2020, http://www.sugar-and-sweetener-guide.com/glycemic-index-for-sweeteners.html
- Jones KL, Russo A, Stevens JE, Wishart JM, Berry MK, Horowitz M. Predictors of Delayed Gastric Emptying in Diabetes. Diabetes Care. 2001/07/01 2001;24(7):1264-1269. doi:10.2337/diacare.24.7.1264.
CrossRef

This work is licensed under a Creative Commons Attribution 4.0 International License.