Antioxidant, Nutritional, Structural, Thermal and Physico-Chemical Properties of Psyllium (Plantago Ovata) Seeds
Aunjum Reyaz Shah1
, S.L Kothari1, Khalid Bashir Dar3, Showkat Ahmad Ganie3and Yasir Reyaz Shah4 1Amity Institute of Biotechnology, Amity University Rajasthan, Jaipur
2ICMR-National Institute of Nutrition, Hyderabad
3Department of Clinical Biochemistry, Kashmir University Hazratbal, Srinagar
4Islamic University of Science and Technology, Awantipora, Jammu and Kashmir
Corresponding Author Email: parassharma19791@gmail.com
DOI : http://dx.doi.org/10.12944/CRNFSJ.8.3.06
Download this article as:
![]()
The present investigation was carried out to characterize four different types of psyllium seeds including one landrace for their nutritional, structural, antioxidant profile and biological active compounds. DSC analysis showed the highest peak temperature (TP) of 107.57 ºC in RI-89 and end set temperature (TE) of 130.2 ºC for HI-5 cultivar. FT-IR analysis displayed strong absorption bands at frequencies 960, 1380, 1740, 2280 and 3280cm-1. SEM micrographs of each cultivar showed compact and irregular mass of fiber at various magnifications. Protein, fat, ash and total carbohydrate content of psyllium seed flour were recorded up to 13.33, 0.38, 5.0 and 77.88 %, respectively. Ethanol was found to be a suitable solvent than methanol to extract the phytonutrients from psyllium seed flour. DPPH free radical scavenging activity (FRSA) of methanolic and ethanolic extract varied between 31 to 39 % and 38.9 to 43 %, respectively. However, ABTS-FRSA varied between 31.7 to 32.9 % and 33.2 to 34.3 %, for methanolic and ethanolic extract, respectively. Total flavonoids and total phenolic content was recorded up to 2.92 mg RE/g and 4.37 mg GAE/g, in ethanolic extract. The reducing power (RP) and Metal chelating activity (MCA) also varied significantly (p≤0.05) among the cultivars. The MCA ranged from 33.20 to 34.81 % in methanolic extracts and 34.62 to 36.07 % in ethanolic extracts. The lowest absorbance for reducing power was found in methanolic extract of landrace (0.16), whereas, the highest was found in ethanolic extract of RI-89 (0.37). Physico-chemical properties including oil and water absorption capacity of both seed and flour did not vary significantly among the cultivars, whereas significant difference was observed in seed hydration capacity among cultivars evaluated. Among the physical properties, L/W ratio ranged from 1.80 to 199, whereas porosity and angle of repose were of 59.2 to 67.7 % and 23.20 to 27.02º, respectively. Static coefficient of friction was found less using steel (0.484 to 0.667) as a test surface compared to wood (0.679 to 0.744) and plastic (0.536 to 0.560). Bulk density, true density and porosity of various psyllium seed cultivars varied between 0.57 to 0.63 g/cm3 and 1.50 to 1.77 g/cm3 and 58.2 to 67.7%, respectively. Geometric mean diameter (Dg), Arithmetic mean diameter (Da) and surface area of seeds (A) varied from 1.49 to 1.60 mm and 1.68 to 1.79 mm and 5.91 to 6.78 mm2, respectively.
KEYWORDS:Antioxidant Potential; Nutritional Value; Physical Properties; Psyllium Seeds; Structural Properties; Thermal Properties
Introduction
Plantago ovata belongs to family Plantaginaceae commonly known as Psyllium. It is an important commercial crop cultivated in India, Pakistan and Iran. The seed of plantago resembles the ‘horse ear’, from which it got its name isabgol.1,2 Plantago ovata was originated in West Asia and got introduced to India in the time of Mughal era during the middle ages.1,3 India is the world’s largest producer (98% of global production) as well as exporter of psyllium husk and the leading psyllium producing states are Gujarat, Madhya Pradesh, Rajasthan and Haryana. 1,2 The psyllium seeds are enclosed with a thin white papery covering on the concave side giving fusion to outer layers of ovule with the inner epidermis forming seed coat or husk. Husk which is known for its medicinal uses is odourless and tasteless which is removed by mechanical milling from the seed and yields up to 26%.1,4 Psyllium help in maintaining blood pressure, reduce blood lipid concentration, 5 increase satiety, 6 helps in weight loss, 7 maintains good appetite 6, lowers caloric intake, 7 increases fecal mass and improves its regularity, 8 reduce the risk of diabetes, 7 constipation 8 and helps in drug delivery.9 In food psyllium is used as thickening agent, emulsifier,10 substitute for gluten,11 and also used in edible films.12
Physical properties are important for post-harvest handling of seeds including storage and processing. Psyllium seeds are ovoid-oblong in shape having pink grey to brown color with 2 to 3 mm in length, 0.8 to 1.5 mm in width. Psyllium seed have 100 seeds weight of 0.1 to 0.2g.13,14Ahmadi et al.,14 reported few physical properties of psyllium seed collected from the local market Karaj (Iran) including true density ( 1350.6 Kg m-3), bulk density (647.4 Kg m-3), thousand seed mass (1.30 g), sphericity (51.1 %) and angle of repose (33.8º). However, they did not mention the cultivar name and analysed only one sample.
Nutritionally psyllium seed is about 17 % protein, 7 % fat, 3% ash, 49 %, total carbohydrates 74% including 25 % total dietary fiber.15 Arabinoxylans constitute more than 60 % of the psyllium husk with monosaccharide unit of arabinose and xylose (complex heteroxylans) are the most abundant polysaccharide in psyllium.16 Psyllium seeds are rich source of antioxidants, phenolics and flavonoids as well as sulfur-containing amino acids,.17 Phytochemicals, have been linked to disease prevention including cancer and other non-communicable diseases.18 Different assays have been used to evaluate the antioxidant potential of plant foods 19 and various extraction solvents have been tested for optimization and maximize extraction of antioxidants from plant materials.20
The literature reviewed revealed that limited research has been carried out to characterize psyllium seed for its physical, antioxidant and nutritional profile and no report is available on physicochemical, thermal and structural properties. Hence a wide gap exists in psyllium research. Therefore, present investigation was carried out in order to evaluate three released psyllium cultivars along with one landrace for their physical, physicochemical, nutritional, antioxidant, thermal and structural properties.
Materials and Methods
Materials
Psyllium seeds cultivar HI-5 was procured from Hissar Agricultural University, Haryana (India), RI-89 and GI-2 cultivars were procured Agriculture University, Jodhpur (India) and Landrace psyllium seeds were kindly provided by local farmer of Jalore, Rajasthan (India). The psyllium seeds which were widely cultivated and known for their higher yield were selected. The all selected varieties were released by the respective agricultural university and were widely cultivated in the state of Rajasthan, Haryana and Gujarat. All the seeds evaluated were from crop harvested in the year 2016 and shown in Figure 1. The seeds colour was also varied. Seeds were cleaned manually to eliminate dirt, foreign material, damaged and immature seeds, and stored at 4°C until further use. All the chemicals, solvents and reagents used in the study were of analytical grade. Seeds were ground in to flour using stone mill (BP lab, Ambala, Haryana, India) and passed through 60 BSS sieve.
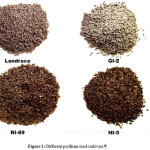 |
Figure 1: Different psyllium seed cultivars.Click here to View figure |
Nutritional Value
Proximate composition including Ash, protein (using Kjeldhal), fat content (using Soxhlet), were evaluated using the Official Methods of Analysis (AOAC). Total carbohydrate was calculated by difference. Dietary fiber profile (total, soluble and insoluble fiber) was carried out using the enzymatic gravimetric procedure
Differential Scanning Calorimetry (DSC)
The thermal properties were evaluated using Differential Scanning Calorimetry (DSC) (Mettler Toledo, DSC1STAR, Switzerland) by following the protocol of Sharma and Gujral.22 The DSC analyzer was calibrated using an empty platinum crucible. The samples were heated at a rate of 10 ºC / min from 30 to 250 ºC. The onset temperatures (To), peak temperature (TP) and end set temperature (TE) were calculated automatically by data analysis system. The peak highest index (PHI) was calculated by the formula
PHI = ΔH/ (TP-T0)
Measurement of Seed Physical Properties
The various physical properties of the psyllium seeds were evaluated and mean of ten determinations were reported. Briefly, 100 seeds were taken randomly to determine the average size of psyllium seed, by measuring length (L) width (W) thickness (T) and L/W ratio. Three principal dimensions which were in the three mutually perpendicular directions were measured using a vernier caliper with an accuracy of 0.01 mm.
The arithmetic mean diameter (Da) and geometric mean diameter (Dg) was calculated according to method reported by Altuntas et al. 23
Da = (L+W+T)/ 3
Dg = (LWT) 1/3
The sphericity (Ø) was calculated as a function of the three principal dimensions as described by Altuntas et al.23
- = [(LWT) 1/3/L] ×100
The surface area, A (mm2) of the seeds was calculated using the following formula-
A= (π BL2/2L-B)
Where, B = (WT) 1/2
The aspect ratio (Ra) of seeds was calculated using the following formula-
Ra= W/L×100
The static coefficient was obtained against wood, plastic and steel surfaces and was determined according to Ixtaina et al.24 Angle of coefficient of static friction was calculated using following formula
μ = tan θ
θ = tan–1 (h/r) where h is the height and r is the radius of the heap
Where μ is the static coefficient of friction and the angle of inclination was read from the graduated scale with θ is the angle of tilt in degrees.
Bulk density (ρb) and true density (ρt) were calculated using the method reported by Wani et al.,25 and values were reported in g/cm3. Toluene was used to measure true density of psyllium seeds. The porosity (Ɛ) was determined in percent by the following equation.
Ɛ = 1-ρb/ρt×100
The angle of repose (θ) of seed was determined by a cylindrical tube having discharge gate at the bottom. The tubes were filled with seeds and then the gate was quickly opened. The height (h) of seed pile above the floor and the radius of the heap (r) were measured to determine the angle of repose.25
One thousand kernels were counted and then weighed on a digital weighing balance with accuracy up to 0.001 mg and reported as thousand kernel weight (TKW). Husk content was measured after mechanically abrading the husk of the seeds using a pearling machine (BP Lab, Ambala, India) and weighed.
Water and Oil Absorption Capacity of Seeds and Their Respective Flours
To determine water absorption capacity (WAC) and oil absorption capacity (OAC), 1 g sample (seeds/flour) were weighed in pre-weighed centrifuge tubes and then stirred into 20 mL of double distilled water or refined oil. The samples were allowed to stand for 30 min and then centrifuged at 2200×g for 10 min. The water or oil released on centrifugation was discarded and tubes were again weighed, the results were expressed as gram of water or oil absorbed per gram of seed/flour. The experiment was carried out in triplicate. 25
Seed Hydration Capacity and Seed Hydration Index
Seed hydration capacity and seed hydration index were evaluated according to Williams et al.26 Briefly, the seeds were soaked in water (seed to water ratio, 1:20) and left to hydrate for 90 min at room temperature (25 ºC). Hydration capacity and hydration index was calculated using the formula after measuring the weight of the swollen seeds.
Hydration capacity = W2 – W1 / N (gram/seed)
W2 = weight after soaking, W1 = weight before soaking and N = number of seeds
Hydration index = hydration capacity of seeds / weight of one seed
Swelling Capacity and The Swelling Index of Seeds
Swelling capacity and the swelling index were determined according to the method of Williams et al.10 The volume of 1 g of seeds was predetermined using a graduated cylinder and they were subsequently soaked up to 20 minute at different time (5, 10, 15 and 20 minutes) intervals in distilled water. The excess water was drained and the volume of the seeds after soaking at different time intervals was measured in percentage. The percent swelling at different time interval was also determined. Several trials were carried out before optimizing the maximum soaking time.
Fourier-Transform Infrared (FT-IR) Spectroscopy and Scanning Electron Microscopy (SEM)
Structural properties of flours obtained from psyllium seeds were evaluated using Fourier Transform Infrared (FT-IR) Spectroscopy (Agilent Technologies, Cary 630 FTIR, USA) and Scanning Electron Microscopy (SEM) as reported by Bhatia and Ahuja.27 The FT-IR spectrum of whole psyllium seed flour samples was obtained at a resolution of 1 cm-1 using.
The shape and surface morphology of flour samples were investigated using Scanning Electron Microscope (Hitachi S- 300HTokyo, Japan). The electron micrographs were taken at different magnifications with accelerating voltage of 20 kV, after gold coating.
Preparation of Methanolic and Ethanolic Extract
Psyllium seed flour samples (10 g) from each cultivar were extracted with 100 ml of ethanol and methanol. Briefly, sample was suspended in the solvent (methanol/ethanol) (flour to solvent ratio, 1:10 w/v) followed by sonication for 20 min and further extracted on mechanical shaker for 1 h followed by centrifugation at 3000g for 10 min. The supernatant was collected and the same procedure was repeated twice and resulted supernatant were pooled and concentrated under lower temperature (30 ºC) and reduced pressure conditions (20 mbar) using a rotovapour (Buchi, R200). The appropriate quantity of concentrate was re-dissolved in corresponding solvents for further analysis (Methanol and ethanol).
Reducing Power
The obtained concentrate as discussed in the extraction section, was diluted appropriately and the reducing power was measured as described by Zhao et al.,28 with slight modification. The absorbance of the mixture was measured at 700 nm. Increased in the absorbance of the mixture indicated increased reducing power.
Antioxidant activity (AOA, DPPH Scavenging Activity)
Antioxidant activity (AOA) of both methanolic and ethanolic extract was measured using a modified version of the method described by Brand -Williams et al.29 Antioxidant activity was calculated as % inhibition using following formula.
% inhibition = Absorbance of control – Absorbance of sample / Absorbance of control ×100
ABTS•+ (2, 2-azinobis (3-ethylbenzothiazoline-6-sulfonate) Scavenging Activity
ABTS•+ scavenging activity of both methanolic and ethanolic extract was evaluated using the method reported by Arnao et al.30 The absorbance was taken at 734 nm and the % inhibition was calculated as:
% inhibition = Absorbance of control – Absorbance of sample / Absorbance of control ×100
Metal Chelating Activity (Ferrous Ion-Chelating Potential)
The metal chelating activity of psyllium seed extract (methanolic and ethanolic) was measured as reported by Dinis et al.31 Absorbance of solution was measured at 562 nm on a spectrophotometer. The chelating activity of the extract for Fe+2 was calculated as follows:
Iron (Fe+2) chelating activity (%) = {1- (Absorbance of sample at 562 nm / Absorbance of control at 562 nm)} × 100
Total Phenolic Content (TPC)
The total phenolic content (TPC) of psyllium seed extracts was determined using the Folin–Ciocalteu reagent using the reported method of Anjum et al.32 The absorbance of the mixture was read at 725 nm (Hitachi U-2900, Japan). The respective extraction solvent was used as blank. The results were expressed as mg of gallic acid equivalents per gram of psyllium flour (mg (GAE)/g).
Total Flavonoid Content (TFC)
Total flavonoids content of ethanolic and methanolic extracts were analyzed according to the method described by Sharma and Gujral.33 The absorbance was measured immediately at 510 nm using a UV-visible spectrophotometer and the results were expressed as milligrams of rutin equivalents per gram of psyllium flour (mg (RE)/g).
Statistical Analysis
Analysis of variance (ANOVA) was carried out using Microsoft Excel software and Fishers least significant difference (LSD) test was used to describe means with 95 % (p < 0.05) confidence. The Pearson correlation coefficients among the antioxidant parameters was calculated using SPSS statistical software (IBM Inc., Chicago, Illinois, USA) at probability level of p < 0.05.
Result and Discussion
Nutritional Composition
Protein, fat and ash content did not show significant difference among the flour from different psyllium seed cultivars and the values ranged from 11.12 to 13.33 %, 0.36 to 0.38 % and 4.29 to 5.0 %, respectively (Table 1). However, the total carbohydrate content was found in the range of 74.75 to 77.88 % showing a significant (p<0.05) difference among cultivars. The results were in agreement with the findings of Farahnaky et al.,18 for psyllium seeds. The significant difference (p≤0.05) was observed in crude fiber, total fiber and insoluble fiber content among cultivars and the values ranged from 26.21 to 29.37 %, 18.80 to 22.71 % and 11.71 to 13.81 %, respectively. Similar results for dietary fiber (24.32 %) were reported by Farahnaky et al.,34 in psyllium husk and in flaxseeds.35
Total dietary fiber (TDF) varied significant (p<0.05) among cultivars and the highest total dietary fiber content of 22.7% was found in flour of HI-5 and the lowest 18.8 % was found in the flour of GI-2. However, soluble dietary fiber (SDF) did not vary significantly among cultivars, the highest SDF (8.9 %) was observed in the psyllium seed flour of HI-5. Insoluble dietary fiber (IDF) content varied insignificantly among cultivar except psyllium seed flour from HI-5 which had the highest amount of 13.8 %.
Thermal Properties (Differential Scanning Calorimetry, DSC)
Thermal characterization provides broad information about thermal transition, and stability properties. DSC is a useful technique for obtaining thermodynamic information on conformational transition process of polysaccharides. Endothermic peaks during the conformational transition from DSC measurement indicate the melting of structural domains.36
Psyllium seed flour from cultivar HI-5 showed the highest onset temperature followed by Landrace, RI-89 and GI-2 with the values of 92.86, 87.03, 86.42 and 78.50 ºC, respectively (Table 1). Psyllium seed flour from cultivar HI-5 and RI-89 showed the highest peak and endset temperature among all cultivars evaluated. The highest peak temperature of 107.5 ºC was found for RI-89 and the lowest value of 103.1 ºC was found for the landrace seed flour. The highest endset temperature of 130 ºC was observed for HI-5 followed by RI-89, GI-2 and flour from landrace. The possible reason for the very high peak temperature (TP) could be the high fiber content of RI-89 and HI-5 compared to the other psyllium seed cultivars. Peak temperature was ranging from 103 to 107 ºC, with the highest and lowest being observed for RI-89 and landrace, respectively. A significant (p<0.05) positive correlations (r = 0.91), (r = 0.81), (r = 0.75) was also observed between TDF and TP, Enthalpy and TDF; Endset and TDF, respectively.
The differences in T0, TP and TE within different psyllium cultivar may be due to differences in polysaccharides including cellulose, arabinose and xylose content. Interestingly, very high value of enthalpy (ΔH) was observed which ranged between 7167 to 9623 J/g, which could be attributed to high content of insoluble and soluble fiber in psyllium seed. Similar high values of enthalpy have been reported for sodium alginate, xanthan gum and guar gum,37 however no report is available on thermal characterization of psyllium seed flour.
Physical Properties
The information of physical parameters like shape, size, volume, density, surface area, and other mechanical characteristics of seeds are important for designing of post-harvest handling and processing equipment. The seeds were analyzed for their physical properties which are considered as significant aspects for quality assessment. Length, width, thickness and Length/width (L/W) ratio are commonly used parameters as these dimensions are important physical attributes used in processing of seeds including screening to separate foreign materials, designing of milling and dehusking machines, calculations of heat and mass transfer as well as in transportation, packaging and storage.
Length, width and thickness of psyllium seeds cultivars varied between 2.75 to 2.88 mm, 1.45 to 1.60 mm and 0.82 to 0.88 mm, respectively. The length of GI-2 was 2.75 mm, while the rest of cultivars were of same length of 2.88 mm. A significant (p≤0.05) difference was also observed in the width among cultivars, the highest width (1.60 mm) was found for RI-89 and the lowest (1.45 mm) observed for landrace and HI-5, respectively. However, thickness did not vary significantly among the cultivars and the lowest value (0.82 mm) was observed in GI-2 whereas the highest value (0.88 mm) was observed in RI-89. L/W ratio of different psyllium seed cultivars varied significantly, the highest L/W ratio (1.99) was shown by HI-5 and landrace seeds, whereas lowest (1.80) was found for seeds from RI-89 cultivar (Table 1).
The seed sphericity, aspect ratio and diameter of seeds are important parameters in determining the shape, heat and mass transfer calculations and screening of foreign materials. The shape of seed is generally expressed in terms of its sphericity and aspect ratio. Sphericity is an expression of a shape of a solid relative to that of a sphere of the same volume. Significant (p≤0.05) differences were observed in the arithmetic mean diameter (AMD), surface area and sphericity of seeds among cultivars, whereas insignificant difference was found in geometric mean diameter (GMD) of psyllum seeds among the cultivars. The AMD and GMD ranged from 1.68 to 1.79 mm and 1.49 to 1.60 mm, respectively. Cultivar RI-89 showed the highest value for sphericity (55.37 %), HI-5 and Landrace showed the lowest value (53.26 %). Surface area for the seed cultivars was in the range of 5.91 to 6.78 mm2, with the lowest for GI-2 and the highest for RI-89.
Bulk density varied significantly (p≤ 0.05) among cultivars and was observed between 0.57 to 0.63 g/cm3 with the lowest value for RI-89 and the highest for HI-5. However, true density and porosity did not vary significantly among cultivars and ranged between 1.50 to 1.77 g/cm3 and 58.2 to 67.7 %, respectively and the results were supported by the findings of Ahmadi et al.14 Bulk density and porosity are important parameters and are useful in packaging, storage of the material and porosity along with the true and bulk density affect the structural loads besides affecting the mass and heat transfer rates during aeration and drying process.
Angle of repose is the angle of the maximum slope, at which a heap of any loose solid material will stand without sliding. It provides the information about heap properties and also plays a key role in designing of transporting and storage structures. An insignificant but wide magnitude (23.20 to 27.02º) was observed in angle of repose among all cultivars evaluated. The highest and the lowest value were recorded for landrace and HI-5, respectively. On the other hand, aspect ratio of psyllium seeds was varied significant among cultivar which was observed between 50.28 to 55.50 with the highest and the lowest being for RI-89 and HI-5, respectively. The average static coefficient of friction of different psyllium seeds cultivars on three different structural surfaces varied significantly (p ≤ 0.05). These test surfaces are being commonly used for the manufacture of storage and drying bins besides handling and processing of grains. It was also found that the static coefficient of friction for psyllium cultivar GI-2 was the highest followed by RI-89, Landrace and HI-5 using wood as test surface and the values were very high than those for plastic and steel as test surfaces. Also, static coefficients did not vary significantly among psyllium seed cultivars using wood and plastic as test surfaces and value was found between 0.698 to 0.744 and 0.536 to 0.560, respectively. Although, significant difference was observed among cultivars using steel as test surface and the values were in the range of 0.484 to 0.667. This difference could be due to the rough surface of plywood since it had the highest static coefficient of friction when compared to steel and plastic, which have smoother and more polished surface. Ahmadi et al.,14 reported almost similar values for the static coefficient of friction using plywood (0.409), galvanized iron sheet (0.404), stainless steel (0.383) and glass (0.263). However, in contrast to present investigation, plastic as a test surface have not been evaluated for psyllium seeds although plastic is light in weight, has long durability and economical.
Husk content of psyllium seeds varied significantly (p<0.05) and ranged from 30.78 to 35.01 %, the highest husk content was found in GI-2 cultivar. On the other hand, thousand kernel weight (TKW) varied insignificantly among psyllium seed cultivars and ranged from 1.68 to 1.86 g presented in Table 1.
Table 1:Nutritional, Thermal and Physical Properties Psyllium Seeds Grown in Northwest India
| Parameter | Cultivars | |||
| Nutritional composition | GI-2 | HI-5 | RI-89 | Landrace |
| Moisture (%) | 6.23a | 6.97b | 6.83b | 5.87a |
| Fat (%) | 0.37a | 0.38a | 0.37a | 0.36a |
| Ash (%) | 4.29a | 4.55a | 4.47a | 5.00a |
| Protein (%) | 11.21a | 13.33a | 12.03a | 11.12a |
| Total Carbohydrate (% )X | 77.88b | 74.75a | 76.29b | 77.65b |
| Crude Fiber Content (%) | 27.29a | 28.47b | 29.37b | 26.21c |
| Total fiber content (%) | 18.80a | 20.81b | 22.71c | 18.92a |
| Insoluble fiber content (%) | 11.77a | 12.76a | 13.81b | 12.36a |
| Soluble fiber content (%) | 7.03 a | 8.04 a | 8.90 a | 6.56 a |
| Thermal properties | ||||
| Onset temperature (T0) ºC | 78.5 | 92.8 | 86.4 | 87.0 |
| Peak temperature(TP) ºC | 104.8 | 105.32 | 107.57 | 103.1 |
| End set temperature(TE) ºC | 125.6 | 130.2 | 129.5 | 119.8 |
| Enthalpy (∆H) J/g | 7167.0 | 9593.18 | 9623.25 | 8549.34 |
| Peak highest index (PHI) | 272.5 | 769.91 | 455.0 | 530.02 |
| Physical properties | ||||
| Length (mm) | 2.75a | 2.88b | 2.88b | 2.88b |
| Width (mm) | 1.47b | 1.45a | 1.60c | 1.45a |
| Thickness (mm) | 0.82a | 0.87a | 0.88a | 0.87a |
| L/W Ratio | 1.88a | 1.99b | 1.80a | 1.99b |
| Geometric Mean Diameter (Dg) (mm) | 1.49a | 1.54a | 1.60a | 1.54a |
| Arithmetic Mean Diameter (Da) (mm) | 1.68a | 1.73b | 1.79c | 1.73c |
| Sphericity (Ø), (%) | 53.58a | 53.26a | 55.37b | 53.26a |
| Surface Area of Seed (A) (mm2) | 5.91a | 6.30b | 6.78c | 6.30b |
| Bulk density (g/cm3) | 0.58a | 0.63b | 0.57a | 0.58a |
| True density (g/cm3) | 1.55a | 1.51a | 1.77a | 1.50a |
| Porosity % (Ɛ) | 61.3a | 58.2a | 67.7a | 61.1a |
| Angle of repose (θ), (º) | 26.74a | 23.20a | 23.74a | 27.02a |
| Aspect ratio (Ra) | 53.34b | 50.28a | 55.50b | 50.28a |
| Static coefficient plastic tray (μ) | 0.536ap | 0.546ap | 0.536ap | 0.560ap |
| Static coefficient steel tray (μ) | 0.484ap | 0.506ap | 0.667bq | 0.496ap |
| Static coefficient wood tray (μ) | 0.744aq | 0.679aq | 0.698aq | 0.682aq |
| Thousand Kernel Weight (g) | 1.68a | 1.82a | 1.79a | 1.86a |
| Husk content of seeds (%) | 35.01d | 30.78a | 31.85b | 32.83c |
Different letters (a, b, c, d) in the same row indicate significant (p<0.05) differences for the same parameter among different cultivars and letters (p,q) in the same column indicate significant differences for the same parameter among different test surfaces. ‘X’ was calculated by difference.
Physico-Chemical Properties
Swelling capacity and swelling index of psyllium seeds displayed significant difference (p ≤ 0.05) at different time intervals (data not reported). The swelling capacity of psyllium seeds varied between 0.019 to 0.023 ml/seed at 20 minutes, the highest and the lowest swelling capacity was exhibited by RI-89 and GI-2, respectively. The increase in total seed volume along with soaking time progression was also recorded. Interestingly, maximum swelling was occurred during initial 5 minutes which exhibited increase in seed volume from 63.7 to 83.5 % with the highest and lowest being for RI-89 and HI-5, respectively. However, as the soaking time progressed from 5 to 10 minute the seed volume increase only by 8.28 to 13.08 % and cultivar GI-2 and RI-89 exhibited the highest and the lowest seed volume, respectively. Further progression in soaking time from 10 to 15 minutes and 15 to 20 minute showed the increase in seed volume up to 11.5 to 17.7 % and 5.20 to 9.1 %, respectively.
The high swelling capacity in the initial five minutes of soaking could possibly due to the high water uptake by the mucilage in the outer covering of psyllium seed and as the water approaches the testa, the swelling capacity decreased as it take time to soften the seed coat and once the seed coat softens the swelling capacity again showed significant (p<0.05) increase.
Water absorption capacity (WAC) of psyllium seed flour did not vary significantly among cultivars and the values ranged between 8.2 to 9.1 g/g. Similarly, WAC of psyllium seed also did not vary significantly among cultivars and was found to be between 6.6 to7.0 g/g. Psyllium with the high content of soluble and insoluble fiber is the key constituents for their huge water absorption capacity due to gel forming nature of soluble fiber and hydrophilic behavior of insoluble fiber with a potential to bind water almost 20 times of its weight. The total fiber of 25 g/100g have been reported in psyllium seed by Romero-Baranzini et al.,15 and the water holding capacity is 46 g/g of psyllium husk powder. 38
Hydration capacity provides the information about the amount of water engrossed into capillary action by physical mechanism. Hydration capacity plays a role in digestive tract and account for faecal bulking effect. Hydration capacity of seeds also varied significantly (p<0.05) among the psyllium cultivars and values were observed between 0.019 to 0.021 g/seed. On the other hand hydration index did not show significant variation among psyllium cultivars and the values were found between 5.6 to 6.1 (Table 2).
Oil absorption capacity (OAC) is an important parameter as it improves mouth feel and retains flavor but due to various health constrains foods low in oil content are preferred. Psyllium seed flour or psyllium husk can be incorporated in cereal based products to reduce their oil uptake during processing, therefore improve their sensory and nutritional properties in addition to providing numerous health benefits. Interestingly, OAC of psyllium seeds and psyllium seed flour did not vary significantly (p > 0.05) among cultivars and observed between 0.85 to 1.0 g/g and 1.23 to 1.6 g/g, respectively (Table 2). The higher value of OAC for psyllium seed flour than psyllium seeds could be explained by high absorption of oil through capillaries formed in psyllium seed flour and due to large surface area of flour as compared to seeds where oil absorbing components remained intact.
Table 2: Physico-Chemical Properties of Psyllium Seeds and Their Respective Flour
| Cultivars | Parameter | |||||
| Oil Absorption (Seed) g/g | Oil Absorption (Flour) g/g | Water Absorption (Seed) g/g | Water Absorption (Flour) g/g | Seed Hydration Capacity (g/Seed) | Seed Hydration Index | |
| GI-2 | 1.00a | 1.23a | 7.04a | 8.92a | 0.021c | 6.17a |
| HI-5 | 0.97a | 1.60a | 6.63a | 9.10a | 0.019a | 5.63a |
| RI-89 | 0.85a | 1.50a | 6.93a | 8.90a | 0.021c | 5.93a |
| Landrace | 0.98a | 1.40a | 6.74a | 8.22a | 0.020b | 5.74a |
Different letters (a, b, c) in the same column indicate significant (P < 0.05) differences for the same parameter among different cultivars.
Structural Properties
Fourier Transform Infrared (FT-IR) Spectroscopy
FTIR spectra have been extensively utilized in the measurement of the functional and structural groups of polymers at molecular level. FT-IR spectra of psyllium seed flour from four different cultivars were recorded to compare the changes in their structure. FT-IR spectrum did not show any major difference among the cultivars and were dominated by a broad band between 3270 and 3289 cm-1, which was assigned to the stretching of hydrogen bonded vibrations of hydroxyl groups. The band 1250 to 1100 cm-1 depicted the C-O and C-C stretching due to the presence of polysaccharides (Table 3, Figure 2). The peaks in the region of 1365 to 1413 cm-1 corresponds to the C–H bending vibrations. The peak at 1650 cm-1 is usually assigned to the amides. The band between 958 to 960 cm-1 corresponds to the C-H bending vibrations. While the bands between 1720 to 1742 ascribes to C=O carbonyl stretch. There was no significant difference in the vibration bands of various cultivars of psyllium (seed flour) which might be due to the fact that the basic chemical structures of psyllium seeds are similar which is reflected in their similar absorption peaks
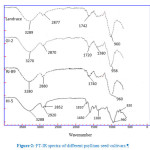 |
Figure 2: FT-IR Spectra of Different Psyllium Seed Cultivars.Click here to View figure |
Table 3: Absorption Peaks of FT-IR Spectrums
| Wave number (cm-1) | Fragment |
| 3289-3270 cm-1 | O-H stretching carbohydrates |
| 2920-2870cm-1 | CH2 and CH3 stretching |
| 1810 cm-1 | C-O stretching (carbonyl group) |
| 1742-1720 cm-1 | C-O stretching vibration (aldehydes) |
| 1650 cm-1 | C=O stretching (Amides) |
| 1500-1750 cm-1 | C=O stretching vibration |
| 1049 cm-1 | Stretching vibrations of either C-C or C-O (characteristics of polysaccharides) |
| 1413-1365 cm-1 | C–H bending vibrations |
| 1250-1100cm-1 | C-O and C-C stretching (polysaccharides) |
| 1402 cm-1 | Symmetric COO- stretching vibrations of hydrogen bonded carboxylic group |
| 958-960 cm-1 | C-H bending (out of phase) |
| 830cm-1 | Aromatic compounds (para) |
| 750cm-1 | C-H bending |
Scanning Electron Microscopy (SEM)
The samples were scanned by focusing electron beam and back scattered electrons are processed to form enlarged micrographs to study the structure at different magnifications (2 to 37 kx). The microstructure of flour from different psyllium cultivars showed irregular shape matrix of uneven size which might be the structural components of fiber (Figure 3). The micrographs did not detect any major differences in physical structure of different cultivars and showed dense irregular matrix of fiber and protein with slightly lopsided surfaces at each magnification. There could also be due to the presence of proteinaceous fragments in psyllium seed flour which gave scattered appearance at lower magnifications. Semi-spherical starch granules were also appeared within the size range of 8 to 12 μm while some large size fiber fragments were also appeared (37 kx) which had length of up to 20 to 24 μm and width of 6 to 8 μm. At higher magnifications, the complex ultra-structure of psyllium fiber became more prominent and reveals a crusty surface with a lack of granular structures indicating presence of proteinaceous and fibre material. The small cavities or pores in the micrographs are evident and could affect the physicochemical properties such as oil absorption and water holding capacity of psyllium. 39
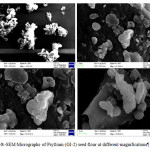 |
Figure 3: SEM Micrographs of Psyllium (GI-2) Seed Flour at Different Magnifications.Click here to View figure |
Total Phenolics Content (TPC)
TPC of ethanolic extracts of psyllium seed flour was found significantly (p < 0.05) higher than methanolic extracts. High content of phenolics in ethanolic extracts might be due to release of more phenols in ethanol as compared to methanol. Ethanolic extract of psyllium seed flour exhibited up to 35% higher TPC than methanolic extract. The results were in well agreement with the study on Limnophila aromatic, 40 they reported lower TPC of 31.5 mg GAE/g in methanolic extract than ethanolic extract (40.5 mg GAE/g). TPC varied significantly (p < 0.05) in methanolic extract which ranged from 2.16 mg GAE/g in landrace to as high as 3.25 mg GAE/g in HI-5 psyllium seed flour. On the other hand ethanolic extract of psyllium seed flour exhibited TPC ranging from 2.23 to 4.37 mg GAE/g (Figure 4). Similar results for TPC were reported in Plantago major L. seed by Mohamedi et al.41
Total Flavonoid Content (TFC)
Flavonoids have generated huge interest from last two decade because of their broad human health promoting effects, most of which are related to their antioxidant properties. Flavonoid also exhibits synergistic effects with other antioxidants. 20, 42
A significant (p<0.05) variation in TFC was recorded among the flour from different psyllium cultivars in both ethanolic and methanolic extracts. TFC was found the highest and the lowest in psyllium seed flour from RE-89 (2.92 mg RE/g) and landrace (1.1 mg RE/g), respectively (Figure 4). However, similar to TPC, TFC was also found high in ethanolic extract than the methanolic extract which ranged from 1.09 to 2.92 mg RE/g, with the highest and the lowest TFC recorded in psyllium seed flour from RE-89 and landrace, respectively. The ethanolic extract exhibited up to 33.2 % (RE-89) higher TFC than methanolic extract. It is well documented that solvent significantly affects the extractability of polyphenols and flavonoids compounds depending upon their polarity and affinity towards polyphenols.20,43 A significant (p<0.05) positive correlation (r =0.84) was also found between TFC and TPC
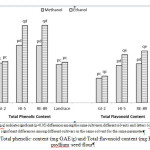 |
Figure 4:Total Phenolic Content (mg GAE/g) and Total Flavonoid Content (mg RE/g) of Psyllium Seed Flour.Click here to View figure |
Antioxidant Activity (AOA, DPPH Free Radical Scavenging Activity)
The antioxidant activity of flour obtained from four different psyllium seed cultivars were investigated after extraction in two different solvents (methanol and ethanol) using DPPH free radical. Estimation of the AOA by scavenging of stable radicals such as the chromogen radical DPPH in inorganic media has been extensively used for comparison of homogeneous series of antioxidants. This procedure measures the hydrogen donating capacity of the target substances in a methanolic/ethanolic media. The colour changes from purple to yellow by accepting hydrogen radical from antioxidants and it becomes a stable diamagnetic molecule.
DPPH-free radical scavenging activity of flour from different psyllium seed cultivars varied significantly (p < 0.05) among cultivars when methanol was used as extraction solvent. The AOA varied between 31 to 39.1 % with the highest and the lowest being for RE-89 and GI-2, respectively (Table 4). On the other hand, ethanolic extract exhibited the significantly (p < 0.05) high AOA than the methanolic extract which ranged from 38.9 to 43.02%. The ethanolic extract showed the increase in AOA by 25 % in cultivar GI-2.
The possible reason of high percent inhibition capacity of ethanolic extracts compared to methanol could be due to the higher (amount/ numbers of phenolic compounds) extractability of phenolics and flavonoids in ethanolic extract than methanol. Interestingly, the highest AOA of flour from RE-89 and HI-5 could be attributed to high content of phenolics and flavonoids in these psyllium varieties. Interestingly, a significant (p<0.05) positive correlation (r = 0.88) was found between DPPH and ABTS radical scavenging activity of methanolic extract of psyllium seed flours. Similar strong positive correlation between AOA and TFC (r = 0.88) and TPC (r = 0.93) was also observed. However, AOA showed a moderate positive correlation (r = 0.72) with metal chelating activity.
ABTS- Free Radical Scavenging Activity
ABTS interacts with potassium persulfate produces a blue/green ABTS˙+ chromophore and addition of antioxidants to the pre formed radical cation reduces it and decreases the darkness of test solution. The turn down in absorbance indicates enhance in % inhibition of the extracts. A significant (p<0.05) difference in percent inhibition was found among all the cultivars and also among the solvents which ranged from 31.75 % for landrace flour to as high as 32.98 % for RE-89 flour and 33.24 % to 34.38 % for methanolic and ethanolic extracts, respectively (Table 4). The possible reason for high ABTS-FRSA of RE-89 and HI-5 could be explained by higher flavonoids and phenols in these psyllium cultivars. It was also reported that psyllium seed flour have high radical scavenging activity than psyllium husk and reported that psyllium seed flour extract (150 µg) exhibited up to 94 % inhibition. 17
ABTS-free radical scavenging activity exhibited significant (p<0.05) positive correlation with metal chelating activity (r = 0.93, methanolic extract; r = 0.98, ethanolic extract), TPC (r = 0.97 metahnolic extract, r = 0.89 ethanolic extract), TFC (r = 0.98 methanolic extract, r = 0.96 ethanolic extract). However, surprisingly, ABTS free radical scavenging activity showed insignificant (p>0.05) positive correlation with reducing power (r =0.65) of methanolic extract but significant (p<0.05) positive correlation (r = 0.97) with etahnolic extract which may again be explained by the variability in extractability of antioxidant compounds in different solvent due to their polarity and affinity towards antioxidant species.
Reducing Power
The antioxidant property of test material is also evaluated using the reducing power. Reducing agents are electron donating compounds and may reduce the oxidized intermediates of the lipid peroxidation reactions therefore, they may be primary or secondary antioxidants.43 The reduction of ferric (Fe3+) to ferrous (Fe2+) ion on interaction of extract indicates its reducing power, causing the test solution to form prussian blue color from yellow. The reducing capacity of extract is an indication of having potential antioxidant properties and the rise in absorbance indicates higher reducing power. The Fe2+ concentration is measured by the change in absorbance and the reduction of Fe3+ to Fe2+ was used to scrutinize the reductive capacity of psyllium seed flour extracts.
Methanolic extract of psyllium seeds flour exhibited the reducing power ranging from 0.16 to 0.25 (absorbance, A700) with the highest and the lowest being recorded for HI-5 and landrace seeds flour (Table 4). Intestinally, in contrast to metahnolic extract, ethanolic extract of psyllium seeds flour (RE-89 and landrace) showed the highest and lowest reducing power, respectively. However, high magnitude of reducing power was observed in the ethanolic extract which varied between 0.29 (Landrace) to 0.37 (RE-89). The reason behind the high reducing power of RI-89 could be due to high levels of polyphenols which may be the principal constituents responsible for the reducing power of the extracts since psyllium seed flour from RI-89 had more phenols followed by HI-5, GI-2 and Landrace.
Reducing power of psyllium seed flour extracts exhibited a strong positive correlation with metal chelating activity (r = 0.84, methanolic extract; r = 0.97, ethanolic extract), TPC (r = 0.85, ethanolic extract), TFC (r = 0.94 ethanolic extract). However, a weak positive correlation was exhibited between reducing power of methanolic extract and TPC (r = 0.55) and TFC (r = 0.65).
Metal Chelating Activity
Various antioxidant methods and modifications have been used to evaluate antioxidant activity of foods and to explain the functions of antioxidants. Among them metal chelating activity is also most commonly used to evaluate antioxidant potential of plant material.44 An insignificant variation was recorded in metal chelating activity among flours from different psyllium cultivars in the both extracts (Table 4). Although, extraction solvent exhibited significant (p < 0.05) effect on the metal chelating activity. Ethanolic extract showed higher value of metal chelating activity than the methanolic extract. The order of metal chelating activity in methanolic and ethanolic extracts was found similar for all psyllium cultivars evaluated (Landrace<GI-2<HI-5<RE-89). Overall, up to 5 % increase in metal chelating activity was observed when ethanol was used as extraction medium. These results are in well agreement with the study reported on Plantago ovata Forsk by Patil et al. 17
Metal chelating activity of psyllium seeds flour showed a strong positive correlation with TPC (r =0.91, methanolic extract and r = 0.86 ethanolic extract) as well as with TFC (r= 0.94, both methanolic and ethanolic extract)
Table 4: Antioxidant Potential of Whole Psyllium Seed Flour
| DPPH % Inhibition | ABTS % Inhibition | Reducing power absorbance | % Metal chelating activity | |||||
| Cultivars | Methanol | Ethanol | Methanol | Ethanol | Methanol | Ethanol | Methanol | Ethanol |
| GI-2 | 31.06pc | 38.91qc | 32.09pc | 33.77qc | 0.24pc | 0.33qc | 33.89pc | 35.40qc |
| HI-5 | 37.58pd | 39.23qc | 32.84pc | 34.16qd | 0.25pd | 0.35qc | 34.81pd | 35.85qd |
| RE-89 | 39.15pe | 43.02qd | 32.98pd | 34.38qd | 0.22pe | 0.37qc | 34.44pe | 36.07qd |
| Landrace | 33.39pf | 40.36qe | 31.75pe | 33.24qe | 0.16pf | 0.29qd | 33.20pf | 34.62qe |
Different letters (p,q) in the same row indicate significant (p<0.05) differences for the same cultivar among different solvents and letters (c,d,e,f) in the same column indicate significant differences in different cultivars in the same solvent for same parameter.
Conclusions
Various physical, physiochemical, structural, thermal and antioxidant properties of different psyllium cultivars were investigated in the present study. Psyllium cultivar RI-89 had the highest surface area and the lowest bulk density. GMD, true density and porosity of psyllium seed did not show significant difference among the cultivars. Cultivar GI-2 had the highest content of husk (35 %) and water absorption capacity. Psyllium seed flour had good amount of protein (up to 13.33 %), very low levels of fat (up to 0.38 %) high content of soluble (up to 8.9%) and insoluble (up to 13.8 %) dietary fiber. Psyllium seed flour displayed very high value of enthalpy while TP ranged between 103 to 107 ºC. SEM microgram of psyllium seed flour exhibited protein and fiber matrix along with few starch granules. Psyllium seeds flour also contained high level of TPC (up to 4.37 mg GAE/g) and flavonoids (up to 2.92 mg RE/g). Ethanol was found to be a good extraction solvent than methanol to extract antioxidant compounds. Overall, due to the presence of high content of biological active compounds, psyllium seeds flour may be incorporated to develop functional foods
Conflict of Interest
Authors declared no conflict of interests
References
- Verma A., Mogra R. Psyllium (Plantago ovata) husk: a wonder food for good health. Inter J Sci Res. 2013; 4(9): 1581-1585.
- Haddadian K., Haddadian K., Zahmatkash, M. A review of Plantago plant. Ind J Trad Med. 2014 ; (13): 681-685.
- Qaisrani T. B., Butt M. S., Hussain S., Ibrahim M. Characterization and utilization of psyllium husk for the preparation of dietetic cookies. Int J Mod Agric. 2014; 3(3): 81-91.
- Tewari D., Anjum N., Tripathi Y. C. Phytochemistry and pharmacology of Plantago ovata: a natural source of laxative medicine. World J Pharm Res. 2014; 3(9): 361-372.
- De Bock M., Derraik J. G., Brennan C. M., Biggs J. B., Smith G. C., Cameron-Smith D., Wall C. R., Cutfield W. S. Psyllium supplementation in adolescents improves fat distribution and lipid profile: a randomized, participant-blinded, placebo-controlled, crossover trial. PLoS One. 2012; 7(7).
CrossRef. - Brum J. M., Gibb R. D., Peters J. C., Mattes R. D. Satiety effects of psyllium in healthy volunteers. Appetite. 2016; 105:27-36.
CrossRef. - Abutair A. S., Naser I. A., Hamed A. T. Soluble fibers from psyllium improve glycemic response and body weight among diabetes type 2 patients (randomized control trial). Nutri J. 2016; 15(1): 86.
CrossRef. - Mehmood M. H., Aziz N., Ghayur M. N., Gilani, A. H. Pharmacological basis for the medicinal use of psyllium husk (Ispaghula) in constipation and diarrhea. Dige Dise Sci. 2011; 56(5):1460-1471.
CrossRef. - Singh B., Chauhan N., Kumar S. Radiation crosslinked psyllium and polyacrylic acid based hydrogels for use in colon specific drug delivery. Carbo Poly. 2008; 73(3): 446-455.
CrossRef. - Saha A., Tyagi S., Gupta R. K., Tyagi Y. K. Natural gums of plant origin as edible coatings for food industry applications. Criti Revi Biotech. 2017; 37(8): 959-973.
CrossRef. - Zandonadi R. P., Botelho R. B. A., Araujo W. M. C. Psyllium as a substitute for gluten in bread. J Amer Diet Assoc. 2009; 109(10): 1781-1784.
CrossRef. - Tóth A., Halász, K. Characterization of edible biocomposite films directly prepared from psyllium seed husk and husk flour. Food Pack Shelf Life. 2019; 20: 100299.
CrossRef. - Madgulkar R., Rao M. R., Warrier D. Characterization of psyllium (Plantago ovata) polysaccharide and its uses. Polysac. 2015; 871-890.
CrossRef. - Ahmadi R., Kalbasi-Ashtari A., Gharibzahedi S. M. T. Physical properties of psyllium seed. Inter Agrophy. 2012; 26(1).
CrossRef. - Romero Baranzini L., Rodriguez O. G., Yanez-Farias G. A., Barron-Hoyos J. M., Rayas-Duarte, P. Chemical, physicochemical, and nutritional evaluation of plantago (Plantago ovata Forsk). Cereal Chem. 2006; 83(4):358-362.
CrossRef. - Shivran A. C., Choudhary I., Puniya M. M. Influence of integrated nutrient management and biofertilizer on growth, yield and soil fertility of Blond psyllium (Plantago ovata) cultivation under semi-arid conditions. Annals Agri Res. 2014; 35(4).
- Patel M. K., Mishra A., Jha B. Non-targeted metabolite profiling and scavenging activity unveil the nutraceutical potential of psyllium (Plantago ovata Forsk). Fron Plant Sci. 2016; 7:431.
CrossRef. - Dranca F., Oroian M. Optimization of ultrasound-assisted extraction of total monomeric anthocyanin (TMA) and total phenolic content (TPC) from eggplant (Solanum melongena L.) peel. Ultra Sonochem. 2016; 31: 637-646.
CrossRef. - Altemimi A., Choudhary R., Watson D. G., Lightfoot, D. A. Effects of ultrasonic treatments on the polyphenol and antioxidant content of spinach extracts. Ultra Sonochem. 2015; 24: 247-255.
CrossRef. - Altemimi A., Lakhssassi N., Baharlouei A., Watson D. G., Lightfoot D. A. Phytochemicals: Extraction, isolation, and identification of bioactive compounds from plant extracts. Plants. 2017; 6(4): 42.
CrossRef. - Paul M. N. AACC. Approved methods of the American Association of cereal Chemists. 2008; 11thed.
- Sharma P., Gujral H. S., Rosell C. M. Effects of roasting on barley β-glucan, thermal, textural and pasting properties. J Cereal Sci. 2011; 53(1): 25-30.
CrossRef. - Altuntaş E., Özgöz E., Taşer Ö. F. Some physical properties of fenugreek (Trigonella foenum-graceum L.) seeds. J Food Engg. 2005; 71(1): 37-43.
CrossRef. - Ixtaina V. Y., Nolasco S. M., Tomas M. C. Physical properties of chia (Salvia hispanica L.) seeds. Indus Crops Prod. 2008; 28(3): 286-293.
CrossRef. - Wani I. A., Sogi D. S., Gill B. S. Physicochemical and functional properties of flours from three Black gram (Phaseolus mungo L.)Int J Food Sci Technol. 2013; 48(4): 771-777.
CrossRef. - Williams P. C., Nakoul H., Singh K. B. Relationship between cooking time and some physical characteristics in chickpeas (Cicer arietinum L.). J Sci Food Agric. 1983; 34(5): 492-496.
CrossRef. - Bhatia M., Ahuja M. Thiol modification of psyllium husk mucilage and evaluation of its mucoadhesive applications. Sci World J. 2013
CrossRef. - Zhao H., Fan W., Dong J., Lu J. Chen J., Shan L., Lin Y., Kong W. Evaluation of antioxidant activities and total phenolic contents of typical malting barley varieties. Food Chem. 2008; 107(1): 296-304.
CrossRef. - Brand-Williams W., Cuvelier M. E., Berset C. L. W. T. Use of a free radical method to evaluate antioxidant activity. LWT-Food Sci Tech. 1995; 28(1): 25-30.
CrossRef. - Arnao M. B., Cano A., Acosta M. The hydrophilic and lipophilic contribution to total antioxidant activity. Food Chem. 2001; 73(2): 239-244.
CrossRef. - Dinis T. C., Madeira V. M., Almeida L. M. Action of phenolic derivatives (acetaminophen, salicylate, and 5-aminosalicylate) as inhibitors of membrane lipid peroxidation and as peroxyl radical scavengers. Archives Biochem Biophy. 1994; 315(1): 161-169.
CrossRef. - Anjum S., Gani A., Ahmad M., Shah A., Masoodi F. A., Shah Y., Gani A. Antioxidant and antiproliferative activity of walnut extract (Juglans regia L.) processed by different methods and identification of compounds using GC/MS and LC/MS technique. J Food Process Preserv. 2017; 41(1): e12756.
CrossRef. - Sharma P., Gujral H. S. Effect of sand roasting and microwave cooking on antioxidant activity of barley. Food Res Inter. 2011; 44(1): 235-240.
CrossRef. - Farahnaky A., Askari H., Majzoobi M., Mesbahi G. H. The impact of concentration, temperature and pH on dynamic rheology of psyllium gels. J Food Engg. 2010; 100(2): 294-301.
CrossRef. - Bekhit A. E. D. A., Shavandi A., Jodjaja T., Birch J., Teh S., Ahmed I. A. M., Al-Juhaimi F.Y., Saeedi P., Bekhit A. A. Flaxseed: Composition, detoxification, utilization, and opportunities. Biocat Agri Biotech. 2018; 13: 129-152.
CrossRef. - Lazaridou A., Biliaderis C. G., Micha-Screttas M., Steele B. R. A comparative study on structure–function relations of mixed-linkage (1→ 3),(1→ 4) linear β-d-glucans. Food Hydrocoll. 2004; 18(5): 837-855.
CrossRef. - Singh A. V. A DSC study of some biomaterials relevant to pharmaceutical industry. J Ther Analy Calori. 2013; 112(2): 791-793.
CrossRef. - Kale M. S., Yadav M. P., Hanah K. A. Suppression of Psyllium Husk Suspension Viscosity by Addition of Water Soluble Polysaccharides. J Food Sci. 2016; 81(10): E2476-E2483.
CrossRef. - Biswas A. K., Kumar V., Bhosle S., Sahoo J., Chatli M. K. Dietary fibers as functional ingredients in meat products and their role in human health. Inter J Livestock Prod. 2011; 2(4): 45-54.
- Do Q. D., Angkawijaya A. E., Tran-Nguyen P. L., Huynh L. H., Soetaredjo F. E., Ismadji S., Ju Y. H. Effect of extraction solvent on total phenol content, total flavonoid content, and antioxidant activity of Limnophila aromatica. J Food Drug Analy. 2014; 22(3): 296-302.
CrossRef. - Mohamed I. K., Osama M. A., Samiha M., Zahrat E. M. M. Biochemical studies on Plantago major L. and Cyamopsis tetragonoloba L. Int J Biodiv Conser. 2011; 3(3): 83-91.
- Filipe P., Lança V., Silva J. N., Morlière P., Santus R., Fernandes A. Flavonoids and urate antioxidant interplay in plasma oxidative stress. Mol Cell Biochem. 2011; 221(1-2): 79-87.
CrossRef. - Zhao H., Dong J., Lu J., Chen J., Li Y., Shan L., Lin Y., Fan, Gu G. Effects of extraction solvent mixtures on antioxidant activity evaluation and their extraction capacity and selectivity for free phenolic compounds in barley (Hordeum vulgare L.). J Agric Food Chem. 2006; 54(19): 7277-7286.
CrossRef. - Chang C. C., Yang M. H., Wen H. M., Chern J. C. Estimation of total flavonoid content in propolis by two complementary colorimetric methods. J Food Drug Ana. 2002; 10(3).
CrossRef.
Accepted on: 8/8/2020
Second Review by: Al-Temimi, Ammar B Iraq
Final Approval by: Dr. Mattia Di Nunzio


Web of Science Coverage
Emerging Sources Citation Index (ESCI)
2024 Journal Impact Factor: 1.1
Scopus Journal Metrics
CiteScore 2025: 2.6
CiteScore Details
Sustainable Nutrition: Food Systems, Nutrient Retention, and Public Health Impact
![]()
This journal is a member of, and subscribes to the principles of, the Committee on Publication Ethics (COPE)


