Dietary Diversity and Associated Health Status of Newly Diagnosed Type 2 Diabetic Patients in Jashore Region of Bangladesh
 , Biplab Kumar Dash2, , , 3*
 1Department of Food and Nutrition Technology, Jashore University of Science and Technology, Jashore, Bangladesh.
2Department of Genetic Engineering and Biotechnology, Jashore University of Science and Technology, Jashore, Bangladesh.
3Department of Applied Nutrition and Food Technology, Islamic University, Kushtia, Bangladesh.
Corresponding Author Email: rk.roy_nft@just.edu.bd
DOI : http://dx.doi.org/10.12944/CRNFSJ.8.2.09
Download this article as:
![]()
Lack of adequate dietary diversity may contribute to the deterioration of health and nutritional status of newly diagnosed type 2 diabetes mellitus (T2DM) patients. This cross-sectional study was designed to assess the dietary diversity and related health status of 110 newly diagnosed T2DM patients. The diabetes history of the subjects was collected from the hospital’s e-database. IDDS (individual dietary diversity score) was measured based on the FFQ (food frequency questionnaire) according to the FAO guidelines for measuring household and individual dietary diversity. BMI (body mass index), FBG (fasting blood glucose) level, 2h-PG (two-hour plasma glucose) level, serum creatinine level, and any signs of macro and microvascular diseases were recorded. The mean±SD of IDDS was moderate, 5.74±0.85. About half of the newly diagnosed diabetic patients consumed foods with high diversity. All respondents consumed starchy foods and about half of them did not consume any green leafy vegetables. Younger patients had a lower tendency to take high IDDS diets than the older. About half of individuals were overweight or obese. Higher IDDS and lower BMI, hypertension, serum creatinine, FBG, and 2-HPG were found among males than that of the females. Approximately 35% and 20% patients had microvascular and macrovascular complications respectively.The BMI and serum creatinine level of newly diagnosed diabetic patients were negatively affected by the IDDS. Dietary diversity and varied socio-demographic determinants were found to be related to the health status of diabetics.
KEYWORDS:Cross-Sectional Study; Dietary Diversity; Health Status; Type-2 Diabetes Mellitus
Introduction
Diabetes is a major public health problem affecting millions of people worldwide thereby posing significant socioeconomic challenges.1 According to the global report on diabetes by World Health Organization (WHO) in 2014, worldwide around 422 million people suffered from diabetes equaling a prevalence of 8.5% among the adult population. Alarmingly, the past three decades evidenced a steady increase in the prevalence of diabetes and it is growing most rapidly in low- and middle-income countries.2 It is estimated that about 80% of all new incidence of diabetes will occur in developing countries by 2025.3 About 85-95% of diabetics in developing countries suffer from type 2 form.4 Currently, about five million adults (6.31%) are diabetic in Bangladesh — the second-largest nation with diabetic adults in the South Asian region.5 Factors like the prevalence of population overgrowth, urbanization, aging, physical inactivity, and obesity were found to be associated with this increasing trend of diabetes.6 As diabetes frequently coexists with a bundle of risk factors related to cardiovascular diseases (CVD) and other metabolic syndromes, diabetic patients are highly likely to be affected with complications like diabetic retinopathy (eye problems), nephropathy (kidney problems), neuropathy (nerve damage), and macrovascular problems.7
Body mass index (BMI) is a potential risk indicator of T2DM in Bangladesh. A national survey carried on 5495 Bangladeshi common adults reported that 18.9% and 4.6% were overweight and obese respectively.8 Much higher BMI (29.7) was observed in newly diagnosed diabetics than usual non-diabetic subjects (26.1). in Norway.9 Dietary intake is a familiar determinant of BMI and controlling BMI is one of the key measures for glycemic control among patients with T2DM.
People consuming significantly diverse foodstuffs and servings in all groups found to maintain normal weight.10 Fasting blood glucose (FBG) is an indicative criterion of T2DM where the plasma glucose level is counted after 8 hours of fasting. According to WHO, normal glucose metabolism refers to 6.1 mmol/L > FBG ≥ 3.9 mmol/L; impaired fasting glucose (7.0 mmol/L > FBG ≥ 6.1 mmol/L) indicates prediabetes and diabetes mellitus is defined as FBG ≥ 7.0 mmol/L.11 A two-hour plasma glucose (2h-PG) value of ≥11.1 mmol/L in a 75 g oral glucose tolerance test (OGTT) is most closely related to the FBG level of 7.0 mmol/L and each portends the development of retinopathy.12 Hypertensive individuals, usually having higher serum creatinine, are at increased risk of developing diabetes compared with normotensives.13,14
Dietary management has been proved to be crucial for preventing diabetes, managing existing conditions, and thwarting the development of associated complications.15 Assessing the diet quality of individuals with diabetes is beneficial for the development of an effective diabetes management intervention, which entails a proper evaluation of their dietary status, particularly for secondary and tertiary prevention to decelerate the worsening of various diabetic complications. Better dietary status showed a remarkable range in protective effects towards health outcomes. It caused a reduction of all-cause mortality by 17-42, CVD mortality by 18-53, and CVD risks by 14-28%.16 As one of the crucial diet quality indicators, the IDDS was found to be inversely associated with CVD risk and metabolic syndrome.17,18 Therefore, this study aimed to measure IDDS, assess related health status and figure out their associated socio-demographic factors among newly diagnosed individuals with T2DM.
Materials and Methods
Study Design and Study Population
This cross-sectional study was conducted between September to November 2018 with 110 newly diagnosed diabetic patients aged 18-75 years. These patients were attending and receiving treatment at different diabetic clinics in Jashore district from where the related data were collected. Patients whose T2DM was diagnosed within the past 12 months from their interview time were defined as newly diagnosed patients. A structured pretested questionnaire was used to capture several socio-demographic characteristics like age, sex, marital status, level of education, and occupation of the study subjects. Physical activity was assessed using the WHO reference measure of physical activity for adults. Several clinical measurements including weight, height, BP, FBG, 2h-PG, and serum creatinine were recorded. The presence of diabetic complications and macro and microvascular diseases were also noted.
A pre-calibrated Seca® scale was used to measure the weight of the patients in light clothing and removed shoes, and recorded to the nearest 0.1 kg. A standard height meter was used to measure height in inches and recorded to the nearest 0.1 inch. The participants were in an upright standing position without shoes for measuring height. A sphygmomanometer was used to measure blood pressure with patients seated in a calm environment. BMI was calculated and experimented as weight (in kg)/height² (in meters) as per WHO guidelines.19 Serum creatinine level and blood glucose level (FBG and 2h-PG) were recorded from recent diagnostic reports of individuals.
Clinical history of respondents, that means FBG, 2h-PG, and serum creatinine were recorded in mmol/L, mmol/L and mg/dl respectively and the prevalence of macro (dyslipidemia, coronary heart disease, and hemorrhage in brain) and micro (nephropathy, retinopathy, gastroparesis, and neuropathy) vascular diseases among the subjects were too collected from the hospital’s recent e-database.
Ethical Clearance
The study was ethically approved by the Institutional Animal Ethical Committee of Jashore Science and Technology University, Bangladesh. The nature of the study was explained before an informed individual consent was provided by all patients to participate in the study.
Measurement of Individual Dietary Diversity Score (IDDS)
Patients were asked questions face to face on food intake by a pretested semi-structured 24-hour dietary recall questionnaire. Food model utensils and food images scale were used respectively to estimate the serving sizes and to assist respondents to recall food quantities they had eaten. Thereafter, respondents were asked if their reported 24-hour intake represented their usual daily dietary intake. The number of unique food groups consumed during the previous 24 hours as described by respondents was summed up to calculate IDDS.20 For dietary diversity, from the list of 16 food groups which include cereals, white roots and tubers, vitamin A-rich vegetables and tubers, dark green leafy vegetables, other vegetables, vitamin A-rich fruits, other fruits, organ meat, flesh-meat, eggs, fish and seafood, legumes nuts and seeds, milk and milk products, oils and fats, sweets, sugar, condiments and beverages were used as recommended by FAO. However, only nine major food groups out of the 16 were finally analyzed.13 Dietary diversity could be low: consumption of foods from ≤3 groups, medium/moderate: consumption of foods from 4-5 groups, and high: consumption of food from ≥ 6 groups.13
Statistical Analysis
Data were analyzed using statistical package for social science (SPSS) version 22.0. Descriptive statistics including means, median, standard deviation (SD), frequency and percentages to summarize and represent obtained IDDS, socio-demographic, health and clinical, and anthropometric characteristics of respondents as appropriate were used. At bivariate level, statistical analysis like chi-square test, independent sample ‘t’ test, one-way ANOVA, LSD posthoc, and Mann-Whitney tests were employed at 10, 5 and 1% level of significance.
Results
Table 1: Socio-demographic characteristics of newly diagnosed diabetic patients.
| Characteristics | Number of attendant (%) | Mean±SD | ||
| Gender | Male | 49(44.5) | ||
| Female | 61(55.5) | |||
| Age (years) | ≤30 | 13(11.8) | 45.48±12.01 | |
| 31-50 | 62(56.4) | |||
| ≥51 | 35(31.8) | |||
| Marital status | Unmarried | 10(9.1) | ||
| Married | 95(85.4) | |||
| Other | 5(4.5) | |||
| Religion | Islam | 99(90.0) | ||
| Hindu | 11(10.0) | |||
| Occupation | Housewife | 46(41.8) | ||
| Employee | 29(26.4) | |||
| Farmers | 16(14.3) | |||
| Businessmen | 9(8.1) | |||
| Day labor | 4(3.63) | |||
| Others | 6(5.45) | |||
| Education | Illiterate | 12(10.9) | ||
| Primary school | 25(22.7) | |||
| Secondary school | 24(21.8) | |||
| Above secondary | 49(44.5) | |||
| Physical activity level | Sedentary | 33(30.0) | ||
| Moderate | 71(64.0) | |||
| Heavy | 6(5.0) | |||
| Monthly family income (USD) | ≤119.05 | 13(11.8) | 307.02±70.32 | |
| (119.06-238.10) | 40(36.4) | |||
| ≥238.11 | 57(51.8) | |||
| Family history | Yes | 51(46.4) | ||
| No | 59(53.6) | |||
| Duration of diabetes (month) | 1 to 6 | 80 (72.7) | 4.49±3.45 | |
| 6 to12 | 30(27.3) | |||
| Blood pressure | Normal | 42(38.2) | ||
| High | 47(42.7) | |||
| Low | 21(19.1) | |||
| FBG (mmol/L) | ≤7.1 | 40(36.4) | 8.34±2.39 | |
| 7.2-9.9 | 45(40.9) | |||
| ≥10 | 25(22.7) | |||
| 2h-PG (mmol/L) | 14.05±4.09 | |||
| Serum creatinine | Abnormal | 19(17.3) | 0.97±.22 | |
| Normal | 91(82.7) | |||
| Type of medication | None | 28(25.5) | ||
| Pills only | 51(46.4) | |||
| Insulin only | 3(2.7) | |||
| Pills & Insulin | 28(25.5) | |||
| Diabetic Complications | Macrovascular complications | None | 70(63.6) | |
| Nephropathy | 16(14.5) | |||
| Retinopathy | 14(12.7) | |||
| Neuropathy | 4(3.6) | |||
| Gastroparesis | 6(5.4) | |||
| Microvascular complications | None | 89(80.9) | ||
| Dyslipidemia | 6(5.5) | |||
| CHD | 13(11.8) | |||
| Brain Hemorrhage | 2(1.8) | |||
| Underweight | 1(0.9) | |||
| Normal weight | 57(51.8) | |||
| BMI (Kg/m2) | Overweight | 45(40.9) | 25.09±3.54 | |
| Obesity class I | 5(4.5) | |||
| Obesity class II | 2(1.8) | |||
Table 1 shows, among 110 newly diabetic patients, most of them (55.5%) were female. The average age of those patients was 45.48 years where 56.4% were aged between 31-50 years. Almost all patients were married (85.4%). Overall education status of the patients was poor as nearly 11% were illiterate, and around 44% merely completed primary or secondary school education. About one-third of patients led a sedentary lifestyle while the rest were moderately or heavily active. About 12% patients earned around 10,000 BDT (119.05$) monthly that is far less than 15,988 BDT, the national household income per month reported by Bangladesh Bureau of Statistics in Dec 2016.21 While interviewed, about 72% patients were suffering from diabetes for the last 6 months since they had been first diagnosed whereas around 27% had diabetes for six months to one year. During the survey, one-fourth of patients did not start taking any medication for the disease. About 46% of them were dependent on pills only, whereas one-fourth reported taking both pills and insulin. About 35% and 20% had different kinds of microvascular and macrovascular diabetic complications, respectively. In case of microvascular complications, 14.5% patients were found to have kidney problems followed by 12.7% patients with eye complications. Coronary heart disease (11.8%) was the most common macro-vascular problem. And dyslipidemia was found among 5.5% patients, was usually hypercholesterolemia, hypertriglyceridemia and elevated LDL. About 62% patients had abnormal blood pressure during the time they were being surveyed; 43% were hypertensive, and 19% were hypotensive. According to the health assessment, the mean BMI of the patients was overweight (25.09 kg/m2), and about 41% and 6% were overweight and obese, respectively. When patients of both genders were classified according to their respective abnormal serum creatinine cutoff points, it was found that 17.3% patients were suffering kidney problems.
Table 2: Relationship between gender and selected health and dietary characteristics of newly diagnosed diabetic patients.
| Characteristics | Male (total 49) | Female (total 61) | p-value | |
| Age (years) | 45.95±12.07 | 45.09±12.05 | 0.711† | |
| BMI | 22.23±2.40 | 26.15±2.90 | 0.001†*** | |
| BMI | Underweight | 1(2) | 0(0) | 0.001‡*** |
| Normal weight | 35(71.4) | 22(36.1) | ||
| Overweight | 11(22.4) | 34(55.7) | ||
| Obesity class I | 0(0) | 5(8.2) | ||
| Obesity class II | 2(4.1) | 0(0) | ||
| Blood pressure | Normal | 28(57.1) | 14(23.0) | 0.001‡*** |
| High | 14(28.6) | 33(54.1) | ||
| Low | 7(14.3%) | 14(23.0%) | ||
| Family history | Yes | 26(53.1%) | 25(41.0%) | 0.207‡ |
| No | 23(46.9%) | 36(59.0%) | ||
| Duration of diabetes | 4.40±3.61 | 4.56±3.34 | 0.644Ψ | |
| FBG (mmol/L) | 8.11±2.34 | 8.53±2.43 | 0.367† | |
| FBG (mmol/L) | ≤7.1 | 19(38.8%) | 21(34.4%) | 0.618‡ |
| 7.2-9.9 | 21(42.9%) | 24(39.3%) | ||
| ≥10 | 9(18.4%) | 16(26.2%) | ||
| 2h-PG (mmol/L) | 13.41±3.94 | 14.56±4.17 | 0.144† | |
| Serum creatinine level | 0.91±0.162 | 1.02±0.256 | 0.025 Ψ ** | |
| Serum creatinine | Abnormal | 1(2.0%) | 18 (29.5%) | 0.001‡*** |
| Normal | 48(98.0%) | 43(70.5%) | ||
| IDDS | 5.87±.780 | 5.62±.897 | 0.12† | |
**Significant at ≤ 0.05; ***significant at ≤ 0.01; †Independent sample t-test and ‡chi-square test were used to test for sample differences in continuous and categorical variables, respectively. ΨMann-Whitney U test was used to compare non normally distributed continuous variables.
Table 2 demonstrates, females had significantly greater BMI than males. Females were more both hypertensive (54.1%) and hypotensive (23.0%) than males. The male patients had a more positive diabetic family history (53.1%) than the females (41.0%). The mean FBG was 8.34±2.39 mmol/L on the day of interview. The prevalence of damaging FBG level (≥10 mmol/L) was greater among females. Female diabetics also had a higher 2h-PG value (14.56±4.17 mmol/L) than the males (13.41±3.94 mmol/L). Similarly, the female had significantly higher serum creatinine with 1.02 mg/dl than their male counterparts with 0.91mg/dl. More females (29.5%) had significantly abnormal creatinine level than males (2%). The male had consumed diverse food items (IDDS=5.87±.780) than females (IDDS=5.62±.897).
Table 3: Distribution of the respondents by consumption of food from different groups.
| Food groups | Frequency (n=110) | Percent (%) |
| Cereals | 110 | 100.0 |
| White roots and tubers | 75 | 68.2 |
| Vitamin A-rich vegetables and tubers | 84 | 76.4 |
| Dark green leafy vegetables | 63 | 57.3 |
| Other vegetables | 53 | 48.2 |
| Vitamin A-rich fruits | 55 | 50.0 |
| Other fruits | 50 | 54.5 |
| Organ meat | 7 | 6.4 |
| Flesh meats | 51 | 46.4 |
| Eggs | 52 | 47.3 |
| Fish and seafood | 69 | 62.7 |
| Legumes, nuts, and seeds | 84 | 76.4 |
| Milk and milk products | 36 | 32.7 |
| Oils and fats | 109 | 99.1 |
| Sweets | 36 | 32.7 |
| Spices, condiments, and beverages | 109 | 99.1 |
According to Table 3, like the starchy food group, oil, fats, spices, and condiments were most consumed by the respondents. About half of the respondents did not consume any dark green leafy vegetables and meals enriched with vitamin-A stuffs and other fruits. Only 6.4 and 32.7% consumed foods from organ meat and milk and milk product groups, respectively. About 54, 53, and 38 % had not taken any flesh-meat, egg and fish, respectively.
Table 4: Distribution of respondents by consumption of nine different major food groups.
| Name of the food groups | Male (total 49) | Female (total 61) |
| Starchy staples | 49(100%) | 61(100%) |
| Dark green leafy vegetables | 28(57.1%) | 35(57.4%) |
| Other vitamin A-rich fruits and vegetables | 45(91.8%) | 54(88.5%) |
| Other fruits and vegetables | 40(81.6%) | 43(70.5%) |
| Organ meat | 4(8.2%) | 3(4.9%) |
| Meat and fish | 44(89.8%) | 56(91.8%) |
| Eggs | 22(44.9%) | 30(49.2%) |
| Legumes, nuts, and seeds | 39(79.6%) | 46(75.4%) |
|
Milk and milk products |
18(36.7%) |
18(29.5%) |
Table 4 illustrates that starchy staples (100%) and meat and fish (90.9%) were the highest consumed food groups, while the milk products (32.7%) and organ meat (6.4%) were the least consumed. Both the male and female individuals had a similar pattern of egg and dark-green -leafy vegetable consumption. The males had a greater tendency to consume various fruits, legumes, nuts and seeds, and organ meat than the females. More than 90% attendants informed that they regularly consume meats and fishes. The rate of consuming milk and milk products was indeed lower for both genders.
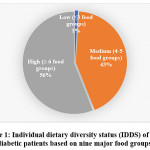 |
Figure 1: Individual dietary diversity status (IDDS) of newly diabetic patients based on nine major food groups. Click here to View figure |
Figure 1 shows that more than half of the newly diagnosed diabetics consumed food from six and more than six different groups, which is treated as a highly diversed group of food items, whereas only one percent consumed from three or less than three groups. Around 40% took diets from four to six major food groups, that is regarded as moderate dietary diversity.
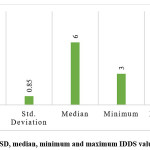 |
Figure 2: Mean, SD, median, minimum and maximum IDDS value of respondents. Click here to View figure |
Figure 2 illustrates, the mean IDDS value obtanined by respondents was 5.74±.85 that is evaluated as moderate diet quality in terms of diversity. Median or 50th percentile of IDDS was 6 which indicates about 50% patients had consumed food items from 6 or lesser food groups. Among total 9 food groups, minimum and maximum number food groups consumed by any individual were 3 and 8 respectively.
Table 5: Distribution of respondents’ individual dietary diversity score (IDDS) according to age, gender, religion, blood pressure, education, physical activity, and monthly family income.
| Variables | IDDS in group | p-value | IDDS (Mean±SD) |
||
| Lowest dietary diversity | Medium dietary diversity | High dietary diversity | |||
| Age (years) | |||||
| ≤30 | 0(0.0) | 9(69.2) | 4(30.8) | 0.27 | 5.46±.77 |
| 31-50 | 1(1.6) | 23(37.1) | 38(61.3) | 5.80±.86 | |
| ≥51 | 0(0.0) | 15(42.9) | 20(57.1) | 5.71±.86 | |
| Gender | |||||
| Male | 0 | 18(36.73) | 31(63.27) | 0.32 | 5.87±.780 |
| Female | 1(1.63) | 29(47.54) | 31(50.81) | 5.62±.897 | |
| Religion | |||||
| Islam | 1(1) | 43(43.4) | 55(55.6) | 0.84 | 5.71±.857 |
| Hindu | 0 | 4(36.4) | 7(63.6) | 5.90±.831 | |
| Blood Pressure | |||||
| Normal | 0 | 16(38.1) | 26(61.9) | 0.47 | 5.95±.88 a ** |
| High | 1(2.1) | 19(40.4) | 27(57.4) | 5.68±.86 | |
| Low | 0 | 12(57.1) | 9(42.9) | 5.42±.67 a ** | |
| Education | |||||
| Illiterate | 0(0.0) | 6(50.0) | 6(50.0) | 0.69 | 5.75±.86 |
| Primary school | 1(4.0) | 11(44.0) | 13 (52.0) | 5.64±1.03 | |
| Secondary school | 0(0.0) | 10(41.7) | 14(58.3) | 5.79±.83 | |
| Above secondary | 0(0.0) | 20(40.8) | 29(59.2) | 5.75±.77 | |
| Physical Activity | |||||
| Sedentary | 0(0.0) | 17(51.5) | 16(48.5) | 0.62 | 5.66±.88 |
| Moderate | 1(1.4) | 27(38.0) | 43(60.6) | 5.74±.82 | |
| Heavy | 0(0.0) | 3(50.0) | 3(50.0) | 6.00±1.09 | |
| Monthly Family Income (USD) | |||||
| ≤119.05 $ | 0(0.0) | 8(61.5) | 5(38.5) | 0.46 | 5.61±.96 |
| 119.06 -238.10 $ | 0(0.0) | 15(37.5) | 25 (62.5) | 5.75±.82 | |
| ≥238.11$ | 1(1.8) | 24(42.1) | 32(56.1) | 5.75±.87 | |
| Body Mass Index (BMI) | |||||
| Under weight | 0(0.0) | 0(0.0) | 1(1.6) | 0.42 | 6.00±.00 |
| Normal weight | 1(100.0) | 21(44.7) | 35(56.5) | 5.82±.88 | |
| Overweight | 0(0.0) | 23(48.9) | 22(35.5) | 5.64±.80 | |
| Obesity class-I | 0 (0.0) | 3(6.4) | 2(3.2) | 5.40±1.14 | |
| Obesity class II | 0(0.0) | 0(0.0) | 2(3.2) | 6.00±.00 | |
| Duration of Diabetes (Months) | |||||
| 1 to 6 months | 1(1.3) | 37(46.3) | 42(52.5) | 0.37 | 5.65±.86 |
| 6 to 12 months | 0(0.0) | 10(33.3) | 20(66.7) | 5.97±.81 | |
| Microvascular Complications | |||||
| None | 0(0.0) | 29(61.7) | 42(67.7) | 0.32 | 5.80±.82 |
| Yes | 1(100.0) | 18(38.3) | 20(32.3) | 5.61±.90 | |
| Macrovascular Complications | |||||
| None | 0(0.0) | 38(80.9) | 51(82.3) | 0.12 | 5.76±.78 |
| Yes | 1(100.0) | 9(19.1) | 11(17.7) | 5.61±1.11 | |
| Serum Creatinine level | |||||
| Abnormal | 1(100.0) | 10(21.3) | 8(12.9) | 0.05 | 5.57±1.21 |
| Normal | 0(0.0) | 37(78.7) | 54(87.1) | 5.76±.76 | |
| FBG levels | |||||
| ≤7.1 mmol/L | 0(0.0) | 22(46.8) | 18(29.0) | 0.26 | 5.65±.89 |
| 7.2-9.9 mmol/L | 1(100.0) | 15(31.9) | 29(46.8) | 5.80±.89 | |
| ≥10 mmol/L | 0(0.0) | 10(21.3) | 15(24.2) | 5.76±.72 | |
| Types of medication | |||||
| None | 0(0.0) | 13(46.4) | 15(53.6) | 0.48 | 5.67±.81a* |
| Pills only | 0(0.0) | 23(45.1) | 28(54.9) | 5.72±.75b* | |
| Insulin only | 0(0.0) | 0(0.0) | 3(100.0) | 6.66±.57abc* | |
| Pills & Insulin | 1(3.6) | 11(39.3) | 16(57.1) | 5.71±1.04c* | |
Low dietary diversity (≤3 food groups), Medium dietary diversity (4-5 food groups), High dietary diversity (≥6 food groups), Chi-square test was used to determine p-values. LSD (least significant difference) test was used to measure the significant difference of mean±SD among groups within variables. abc Similar superscripts between rows within each variable indicate significant mean±SD IDDS difference. *Significant at ≤0.1, ** significant at ≤0.05
Table 5 reveals that the youngest patients (≤30 years) had a lower tendency to consume foods of greater diversity than the olders, only 30% of them took at high IDDS diets. Patients aged 31 to 50 years cosumed maximum diets at high IDDS groups (61.3%). Accordingly, when IDDS was distributed within the age groups as mean±SD, patients aged 31 to 50 years also had greater IDDS than who aged 30 or lower and 51 to 59 years. Food consumption at high IDDS was more common among males (63.27%) than females (50.81%). Similarly, the mean IDDS score (5.87±.78) was higher for male patients than that of the females (5.62±.90). Hindu patients had higher mean IDDS than the Muslims. The respondents having normal blood pressure consumed highly diverse foods than those with high and low pressure. Accordingly, the normal blood pressure group had a greater mean IDDS. The persons having a better education level consumed more diverse group of food items. Only half of the patients who were illiterate consumed high IDDS food items. The mean IDDS was greater with the increase of physical activity level. When IDDS were distributed against the different socio-economic status of patients, it was found that the medium and high family income groups consumed more diversified foodstuffs. Respondents with higher dietary diversity had relatively normal BMI and a lower tendency to be overweight and obese. The group of respondents suffering from diabetes since > 6 months had a higher dietary diversity score than those of ≤6 months. The dietary scores were lesser among the patients with microvascular and macrovascular complications than those who had no such complications. Patients with high dietary diversity score had lower abnormal creatinine status (12.9%) and lower high FBG level (24%). While mean IDDS (5.67±.81) was lowest among patients who were yet to begin any medication, the highest mean IDDS (6.66±.57) was found among insulin inatker.
Table 6: Relationship between clinical characteristics and dietary diversity status of newly diagnosed diabetic patients.
| Biochemical status | Dietary diversity score | Number of respondents | Mean± SD | p-value |
| Serum Creatinine level (mg/dl) | Medium | 48 | 0.946±.123 | 0.087* |
| High | 62 | 0.903±.138 | ||
| FBG (mmol/L) | Medium | 48 | 8.04±2.50 | 0.190 |
| High | 62 | 8.55±2.32 | ||
| 2h-PG (mmol/L) | Medium | 48 | 13.81±4.29 | 0.507 |
| High | 62 | 14.22±3.99 | ||
| BMI | Medium | 48 | 25.49±3.22 | 0.058* |
| High | 62 | 24.37±2.87 |
*Significant at ≤ 0.1. An independent sample t-test was used to measure p-values
The mean values of serum creatinine, FBG, 2h-PG, and BMI of the respondents distributed into medium and high IDDS are listed in Table 6. The high IDDS patients had lower serum creatinine than the medium group. The FBG level was higher in high IDDS patients compared to medium consumers. Consequently, the high IDDS group had greater 2h-PG than the medium. The BMI of the high IDDS group was lower than that of the medium.
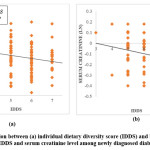 |
Figure 3: Correlation between (a) individual dietary diversity score (IDDS) and body mass index (BMI) and (b) IDDS and serum creatinine level among newly diagnosed diabetic patients. Click here to View figure |
Figure 3 reveals that BMI after around 27 Kg/m2 was significantly and negatively correlated with the IDDS among newly diagnosed patients. The serum creatinine level also showed a significantly negative correlation with IDDS.
Discussion
This study reveals most of respondents with newly diagnosed T2DM failed to follow the dietary guidelines.22 The average IDDS was moderate. About 44% respondents had not consumed foods from 6 or more than 6 food groups, which is regarded as better individual dietary diversity status. A healthy diet should meet the recommended dietary guidelines for consuming a variety of food that include carbohydrates, protein, and fat in moderation from different sources. It was observed that consuming a varied diet consisting of various fruits, vegetables, whole grains, lean meats, low-fat dairy, and alternatives was strongly associated with a lower risk of all-cause mortality and considerable betterment of health outcomes.22,23 Just over half of the diabetics consumed food at high individual dietary diversity group whereas 43% and 1% had medium and low individual dietary diversity status respectively. These findings are similar to a study carried out in Malaysia,24 but in contrast to those conducted in European countries.10,25,26 Older patients showed higher tendency to consume food groups of greater diversity. This could be due to with the increase of age people showed a decrease in appetite for large staple meals that caused them to take diverse foods.27,28 Although different numbers of food groups and dietary diversity scoring systems employed in different countries have made the IDDS difficult to compare between countries,13,29,30 it was tried to figure out the close standard level among diabetes patients in the current study.
Above half of the patients in our study had not consumed any flesh meat and egg and more than one-third any fish. Similarly, low protein intake among patients was attributed to the high cost of these foods within the poor socio-economic status.31 Only 32.7% of respondents consumed milk and milk-based products and that is in concordance with the study carried out in Malaysia.10 The explanation for the low intake of dairy products is that people often perceived milk as a fattening agent that can raise blood glucose level. In fact, some studies found that milk and milk products have anti-obesity effects by discouraging the development of abnormal glucose homeostasis. It was reported that dairy product intake had 15%–28% lower risk of type-2 diabetes.32–34 Most of the related studies replicated this finding that starchy staples, fats and oils, few available vegetables, and spices are the most consumed foodstuffs by the adult diabetics. A study in Ivory Coast reported that diabetic individuals had an average IDDS of 5.6 ± 1.58 and almost all of them consumed onion, tomato, and pepper vegetables.30 We found about 40% of patients did not consume any dark green leafy vegetables. About half of the respondents respectively had a meal that lacked in vitamin-A rich and other fruits. People reporting a higher intake of green leafy vegetables had a 14%–21% lower risk of T2DM.35 A similar study carried out in a more developed country, Saudi Arabia, revealed that 75% of diabetic patients had consumed fruits regularly.36 This frequent consumption also can be validated by the fact of their greater availability and lower cost of food groups like fruits and dairy products. The diets which cost lower were commonly consumed than those cost higher.29 This also continues to explain why the intake of meat, egg, and fishes by the patients in the current study was quite unsatisfactory. These all groups are very important for preventing or delaying diabetic complications among T2DM individuals.15
This study found that men had higher IDDS than those of women which was inconsistent with the studies performed in Nebraska, USA and in other 23 counties.37, 38 This may be due to the ongoing patriarchy of our society where men generally found to work and enjoy more independence than women. We also found that Hindu patients had higher mean IDDS than the Muslims, this is consistent with the previous study in Indo-Asians patients.39 It can be explained by the fact that Hindus are usually more prone to consume vegetarian diets and vegetarians have a higher tendency to encompass diverse food to recover their daily required protein consumption, which eventually comparatively increased their (Hindus) IDDS. As Hindus don’t take higher energy foods, overweight and obesity among Muslims were higher and this is supported by another study.40
About 43% patients were hypertensive and female were more hypertensive than males. This finding was consistent with the studies carried out in Korea41 and Bangladesh42 and inconsistent with that of Canada.43 We found the prevalence of female diabetic patients was two times greater than the male. This finding is comparable to another study carried out earlier in Bangladesh that reported that hypertensive individuals are at more risk of developing diabetes compared with normotensives.42 Serum creatinine level among the females was significantly higher than the males which are consistent with a related study in Ottawa Hospital, Canada.44 The kidney patients had microalbuminuria which was also reported by other studies.45,46 Patients with high IDDS were significantly found with greater normal serum creatinine status than patients who had lower IDDS.
We found education, physical activity level, and socio-economic status of patients had an impact on their dietary diversity scores. With the increase of that status, IDDS also increased. Several studies showed a direct association between level of education and IDDS; it was found that lower education was associated with less diversified and poor diet quality.10,47,48 These results may be explained by the fact that certain literacy level is required to comprehend the available health information. Less-educated subjects may struggle to make use of written sources to gain nutritional and health-related knowledge.49 Expectedly, only 6% respondents led physically heavy active life, also had maximum mean IDDS compared to moderate and sedentary respondents. Some previous studies reported that regular increased physical activity can adequately improve blood glucose control and decrease the difficulties of T2DM.50,51 In this study, about half of the respondents had a monthly income below 20,000 BDT (238.10 USD) and medium and high family income groups had higher dietary diversity diets. This was because low-income people believed to have consumed food from different or diverse sources is costly.52
In our study, according to BMI assessment of health status, about 41% and 6.3% of newly diagnosed diabetic individuals were overweight and obese respectively that are much higher the data reported by a national survey on Bangladeshi common adults which showed18.9% and 4.6% adults are overweight and obese respectively.8 A similar follow-up study on newly diabetic patients in Norway revealed the BMI (29.7±4.9) of newly diabetic patients was greater than its usual non-diabetic subjects (26.1±3.5).9 Our findings on BMI supports a study carried out in Nigeria where the females (43.4%) were more overweight and obese (13.5%) than the males asserting a greater prevalence of obesity among the female diabetic individuals.53 Respondents who had normal blood pressure used to take higher diverse foods than those who had abnormal (high and low) blood pressure, because, more diversified diet can contribute more vitamins and minerals, more reduced energy and high fiber consumptions to its consumers. Similar findings were observed in other studies; subjects with normal weight consumed a significantly higher number of food groups and a higher number of servings in all food groups, which indicated a better diet quality.10 This increased overweight, obesity and mean BMI among studied subjects risked them to T2DM.54 Again, individuals with high IDDS had increased intake of protein which might play roles in maintaining their BMI at a normal level. A Korean study on T2DM patients demonstrated similar findings where high protein intake was associated with the reduced chance of obesity in those patients.33 This may be validated by the fact that high protein consumption may lead to increased secretion of satiety hormones.55–57
In our study, microvascular complications like diabetic nephropathy, retinopathy, gastroparesis, and neuropathy were all found at various extents among the newly diagnosed diabetic respondents that were consistent with a parallel study in the United Kingdom58 and the USA.59 Among microvascular complications, we found 15% patients resulted in kidney complications was maximum which was followed by 13% eye complications, 3% and 5% neuropathy and gastrointestinal problems respectively. Similar findings were reported by a study conducted in South London.58 The considerable presence of these chronic complications indicates their hidden long-suffering from diabetes. In our study, high dietary diversity patients were lowest to report highest FBG level (≥10 mmol/L). The mean FBG was 8.34, where a study in Norway found the average FBG level 6.9mmol/L.9 This may be due to the reason that people in a more developed country are more health and diet conscious and have easy access to different healthcare facilities than the individuals who belong to comparatively less developed countries like Bangladesh.
Type of medication is also found to predict the dietary quality significantly in the present study. Subjects with T2DM, who were on insulin regimen, tended to eat more food groups compared to their counterparts not on insulin regimen. The possible explanations for the differences are that those on insulin regimen might be more likely to feel better and to have less symptoms of dizziness, depression, fatigue, thirst and dry mouth, polyuria, and nocturia than their non-insulin counterparts.45,46
While the mean IDDS was lowest among patients who had taken no medication, the highest mean was found in those had insulin regimen. The explanation for this may be the individuals on the insulin regimen had more appetite and had less thirst and dry mouth, dizziness, fatigue, and polyuria than their non-insulin counterparts.60 To the best of our knowledge, there are inadequate studies on diet quality and type of medication used among individuals with T2DM. Dietary management is one of the most important interventions for diabetes for those newly- diagnosed with T2DM.61
Conclusion
We demonstrate that a big proportion of individuals who have recently diagnosed with T2DM failed to adhere to the required dietary guidelines. Their overall health status was also not satisfactory. The nutritional status of the diabetics was closely related to the level of education, diet quality, and other socio-demographic factors. Proper household food security, reasonable food price, and sustainable health and nutrition education on proper dietary and health practices are recommended for better diabetic prevention and management among population.
Funding
The author(s) received no financial support for the research, authorship, and/or publication of this article.
Conflict of Interest
The authors have no conflict of interest.
References
- Mbanya JCN, Motala AA, Sobngwi E, Assah FK, Enoru ST. Diabetes in sub-Saharan Africa. Lancet. 2010;375(9733):2254-2266. doi:10.1016/S0140-6736(10)60550-8
- Dagogo-Jack S. Ethnic disparities in type 2 Diabetes: Pathophysiology and implications for prevention and management. J Natl Med Assoc. 2003;95(9):774, 779-789.
- Nigel Unwin, David Whiting, Delice Gan, Olivier Jacqmain GG. Atllas de La Diabetes.; 2009. doi:2-930229-80-2
- Gerstein HC, Mann JF, Yi Q, et al., Albuminuria and risk of cardiovascular events, death, and heart failure in diabetic and nondiabetic individuals. JAMA. 2001;286(4):421-426.
- Rahman MS, Akter S, Abe SK, et al., Awareness, treatment, and control of Diabetes in Bangladesh: A nationwide population-based study. Goldhaber-Fiebert JD, ed. PLoS One. 2015;10(2):e0118365. doi:10.1371/journal.pone.0118365
- Madaan H, Agrawal P, Garg R, Sachdeva A, Partra SK, Nair R. Himanshu Madaan et al., Prevalence of diabetes mellitus in rural population of district Sonepat, India. Int J Med Sci Public Heal |. 2014. doi:10.5455/ijmsph.2013.101220131
- Air EL, Kissela BM. Diabetes, the metabolic syndrome, and ischemic stroke: Epidemiology and possible mechanisms. Diabetes Care. 2007;30(12):3131-3140. doi:10.2337/dc06-1537
- Biswas T, Garnett SP, Pervin S, Rawal LB. The prevalence of underweight, overweight and obesity in Bangladeshi adults: Data from a national survey. Nugent RA, ed. PLoS One. 2017;12(5):e0177395. doi:10.1371/journal.pone.0177395
- Dale AC, Midthjell K, Nilsen TI, Wiseth R, Vatten LJ. Glycaemic control in newly diagnosed diabetes patients and mortality from ischaemic heart disease: 20-year follow-up of the HUNT Study in Norway. Eur Heart J. 2009;30(11):1372-1377. doi:10.1093/eurheartj/ehp039
- Tiew KF, Chan YM, Lye MS, Loke SC. Factors associated with dietary diversity score among individuals with type 2 Diabetes mellitus. J Health Popul Nutr. 2014;32(4):665-676.
- Puavilai G, Chanprasertyotin S, Sriphrapradaeng A. Diagnostic criteria for Diabetes mellitus and other categories of glucose intolerance: 1997 criteria by the Expert Committee on the Diagnosis and Classification of Diabetes Mellitus (ADA), 1998 WHO consultation criteria, and 1985 WHO criteria. World Healt. Diabetes Res Clin Pract. 1999;44(1):21-26.
- Nakagami T, Takahashi K, Suto C, et al., Diabetes diagnostic thresholds of the glycated hemoglobin A1c and fasting plasma glucose levels considering the 5-year incidence of retinopathy. Diabetes Res Clin Pract. 2017;124:20-29. doi:10.1016/j.diabres.2016.12.013
- guidelines for measuring household and individual dietary diversity Prepared by FAO Nutrition and Consumer Protection Division with Support from the EC/FAO Food Security Information for Action Programme and the Food and Nutrition Technical Assistance (FAN); 2008.
- Mittal P and Y 2014. Serum creatinine level in hypertensive patients: a study from Uttarakhand, India. International J Pharma Sci and Research. 2014;5(7):2955-2959
- American Diabetes Association, Bantle JP, Wylie-Rosett J, et al., Nutrition recommendations and interventions for Diabetes: A position statement of the American Diabetes Association. Diabetes Care. 2008;31(Supplement 1):S61-S78. doi:10.2337/dc08-S061
- Wirt A, Collins CE. Diet quality – what is it and does it matter? Public Health Nutr. 2009;12(12):2473. doi:10.1017/S136898000900531X
- Torheim LE, Ouattara F, Diarra MM, et al., Nutrient adequacy and dietary diversity in rural Mali: association and determinants. Eur J Clin Nutr. 2004;58(4):594-604. doi:10.1038/sj.ejcn.1601853
- Azadbakht L, Mirmiran P, Esmaillzadeh A, Azizi F. Dietary diversity score and cardiovascular risk factors in Tehranian adults. Public Health Nutr. 2006;9(6):728-736.
- WHO Expert Consultation. Appropriate body-mass index for Asian populations and its implications for policy and intervention strategies. Lancet. 2004;363(9403):157-163. doi:10.1016/S0140-6736(03)15268-3
- Ruel MT. Is dietary diversity an indicator of food security or dietary quality? A review of measurement issues and research needs. Food Nutr Bull. 2003;24(2):231-232. doi:10.1177/156482650302400210
- Bangladesh | HIES: Household Income per Month | Economic Indicators.
- International Diabetes Federation. Global Gudelines for type 2 diabetes. Glob Guidel Type 2 Diabetes. 2012.
- Kant AK, Graubard BI, Schatzkin A. Dietary patterns predict mortality in a national cohort: The National Health Interview Surveys, 1987 and 1992. J Nutr. 2004;134(7):1793-1799. doi:10.1093/jn/134.7.1793
- Norimah AK, Safiah M, Jamal K, et al., Food consumption patterns: Findings from the Malaysian Adult Nutrition Survey (MANS). Malays J Nutr. 2008.
- Toeller M, Klischan A, Heitkamp G, et al., Nutritional intake of 2868 IDDM patients from 30 centres in Europe. Diabetologia. 1996. doi:10.1007/BF00403912
- Thanopoulou A, Karamanos B, Angelico F, et al., Nutritional habits of subjects with Type 2 diabetes mellitus in the Mediterranean Basin: Comparison with the non-diabetic population and the dietary recommendations. Multi-Centre Study of the Mediterranean Group for the Study of Diabetes (MGSD). Diabetologia. 2004. doi:10.1007/s00125-003-1316-0
- Whitelock E, Ensaff H. On your own: Older adults’ food choice and dietary habits. Nutrients. 2018. doi:10.3390/nu10040413
- Drewnowski A, Renderson SA, Driscoll A, Rolls BJ. The dietary variety score. J Am Diet Assoc. 1997. doi:10.1016/s0002-8223(97)00070-9
- Conklin AI, Monsivais P, Khaw K-T, Wareham NJ, Forouhi NG. Dietary diversity, diet cost, and incidence of Type 2 Diabetes in the United Kingdom: A prospective cohort study. Basu S, ed. PLOS Med. 2016;13(7):e1002085. doi:10.1371/journal.pmed.1002085
- Déré KAL, Djohan YF, Koffi KG, Manhan K, Niamké AG, Tiahou GG. Individual dietary diversity score about mellitus Diabetics and hypertensive patients in Cote D’Ivoire. Li J, ed. Int J Nutr. 2016;2(1):38-47. doi:10.14302/issn.2379-7835.ijn-16-943
- Mayega RW, Guwatudde D, Makumbi F, et al., Diabetes and pre-Diabetes among persons aged 35 to 60 years in Eastern Uganda: Prevalence and associated factors. Herder C, ed. PLoS One. 2013;8(8):e72554. doi:10.1371/journal.pone.0072554
- Bush NC, Alvarez JA, Choquette SS, et al., Dietary calcium intake is associated with less gain in intra-abdominal adipose tissue over 1 year. Obesity. 2010. doi:10.1038/oby.2010.39
- Pereira MA, Jacobs DR, Van Horn L, Slattery ML, Kartashov AI, Ludwig DS. Dairy consumption, obesity, and the insulin resistance syndrome in young adults: the CARDIA Study. JAMA. 2002;287(16):2081-2089.
- Zemel MB. The Role of Dairy Foods in Weight Management. J Am Coll Nutr. 2005. doi:10.1080/07315724.2005.10719502
- Cooper AJ, Sharp SJ, Lentjes MAH, et al., A Prospective study of the association between quantity and variety of fruit and vegetable intake and incident type 2 Diabetes. Diabetes Care. 2012;35(6):1293-1300. doi:10.2337/dc11-2388
- Bakr E-SH. Nutritional assessment of type II diabetic patients. Pakistan J Nutr. 2015;14(6):308-315. doi:10.3923/pjn.2015.308.315
- Wardle J, Haase AM, Steptoe A, Nillapun M, Jonwutiwes K, Bellisle F. Gender differences in food choice: The contribution of health beliefs and dieting. Ann Behav Med. 2004. doi:10.1207/s15324796abm2702_5
- Su D, Zhou J, Jackson HL, Soliman GA, Huang TTK, Yaroch AL. A sex-specific analysis of nutrition label use and health, Douglas County, Nebraska, 2013. Prev Chronic Dis. 2015. doi:10.5888/pcd12.150167
- Bakewell A, Higgins R, Edmunds M. Nutrition, adequacy of dialysis, and clinical outcome in Indo-Asian and White European patients on peritoneal dialysis. QJM – Mon J Assoc Physicians. 2002. doi:10.1093/qjmed/95.12.811
- Kahan D. Prevalence and correlates of adult overweight in the Muslim world: analysis of 46 countries. Clin Obes. 2015;5(2):87-98. doi:10.1111/cob.12089
- Choi HM, Kim HC, Kang DR. Sex differences in hypertension prevalence and control: Analysis of the 2010-2014 Korea national health and nutrition examination survey. PLoS One. 2017. doi:10.1371/journal.pone.0178334
- Chowdhury MAB, Uddin MJ, Haque MR, Ibrahimou B. Hypertension among adults in Bangladesh: Evidence from a national cross-sectional survey. BMC Cardiovasc Disord. 2016;16:22. doi:10.1186/s12872-016-0197-3
- Syme C, Abrahamowicz M, Leonard GT, et al., Sex differences in blood pressure and its relationship to body composition and metabolism in adolescence. Arch Pediatr Adolesc Med. 2009. doi:10.1001/archpediatrics.2009.92
- Swedko PJ, Clark HD, Paramsothy K, Akbari A. Serum creatinine is an inadequate screening test for renal failure in elderly patients. Arch Intern Med. 2003. doi:10.1001/archinte.163.3.356
- Viazzi F, Leoncini G, Conti N, et al., Microalbuminuria is a predictor of chronic renal insufficiency in patients without diabetes and with hypertension: The MAGIC study. Clin J Am Soc Nephrol. 2010. doi:10.2215/CJN.07271009
- Ruggenenti P, Fassi A, Ilieva AP, et al., Preventing microalbuminuria in type 2 diabetes. N Engl J Med. 2004. doi:10.1056/NEJMoa042167
- Kuczmarski MF. Health Literacy and Education Predict Nutrient Quality of Diet of Socioeconomically Diverse, Urban Adults. J Epidemiol Prev Med. 2016. doi:10.19104/jepm.2016.115
- Mayén AL, Marques-Vidal P, Paccaud F, Bovet P, Stringhini S. Socioeconomic determinants of dietary patterns in low- and middle-income countries: A systematic review. Am J Clin Nutr. 2014. doi:10.3945/ajcn.114.089029
- Elwood PC, Pickering JE, Givens DI, Gallacher JE. The consumption of milk and dairy foods and the incidence of vascular disease and Diabetes: An overview of the evidence. Lipids. 2010;45(10):925-939. doi:10.1007/s11745-010-3412-5
- Umpierre D, Ribeiro PAB, Kramer CK, et al., Physical activity advice only or structured exercise training and association with HbA1c levels in type 2 diabetes: A systematic review and meta-analysis. JAMA – J Am Med Assoc. 2011. doi:10.1001/jama.2011.576
- Wang Q, Zhang X, Fang L, Guan Q, Gao L, Li Q. Physical activity patterns and risk of type 2 diabetes and metabolic syndrome in middle-aged and elderly Northern Chinese adults. J Diabetes Res. 2018. doi:10.1155/2018/7198274
- Drewnowski A, Darmon N. Food choices and diet costs: an economic analysis. J Nutr. 2005. doi:10.1093/jn/135.4.900
- Adebayo YO, Addo A. Nutritional status of type II diabetes mellitus patients in a teaching hospital in Ogun state, Nigeria. Int J Nutr Diet. 2015;3(1):23-37. doi:10.17654/ijndmay2015_023_037
- Diabetes in Asia Study Group., Islam A, Islam SS. Journal of Diabetology : Official Journal of Diabetes in Asia Study Group. Vol 7. Diabetes in Asia Study Group; 2010.
- Soenen S, Martens EAP, Hochstenbach-Waelen A, Lemmens SGT, Westerterp-Plantenga MS. Normal protein intake is required for body weight loss and weight maintenance, and elevated protein intake for additional preservation of resting energy expenditure and fat free mass. J Nutr. 2013. doi:10.3945/jn.112.167593
- Westerterp-Plantenga MS, Nieuwenhuizen A, Tomé D, Soenen S, Westerterp KR. Dietary protein, weight loss, and weight maintenance. Annu Rev Nutr. 2009. doi:10.1146/annurev-nutr-080508-141056
- Pesta DH, Samuel VT. A high-protein diet for reducing body fat: mechanisms and possible caveats. Nutr Metab (Lond). 2014;11(1):53. doi:10.1186/1743-7075-11-53
- Petrie JR, Guzik TJ, Touyz RM. Diabetes, hypertension, and cardiovascular disease: clinical insights and vascular mechanisms. Can J Cardiol. 2018. doi:10.1016/j.cjca.2017.12.005
- Morkos M, Tahsin B, Fogg L, Fogelfeld L. Newly diagnosed type 2 Diabetes in an ethnic minority population: Clinical presentation and comparison to other populations. BMJ Open Diab Res Care. 2018;6(1):568. doi:10.1136/bmjdrc-2018-000568
- Johansen J, Claudi T, Holtedahl K. Insulin treatment for poorly regulated diabetic patients in general practice. Better regulation and symptom relief? Scand J Prim Health Care. 1999.
- Ley SH, Hamdy O, Mohan V, Hu FB. Prevention and management of type 2 diabetes: Dietary components and nutritional strategies. Lancet. 2014. doi:10.1016/S0140-6736(14)60613-9
Accepted on: 16/04/2020
Second Review by: Dr. Shaw Watanabe Japan
Final Approval by: Ana Laura Isabel De la Garza Hernández


Web of Science Coverage
Emerging Sources Citation Index (ESCI)
2024 Journal Impact Factor: 1.1
Scopus Journal Metrics
CiteScore 2025: 2.6
CiteScore Details
Sustainable Nutrition: Food Systems, Nutrient Retention, and Public Health Impact
![]()
This journal is a member of, and subscribes to the principles of, the Committee on Publication Ethics (COPE)


