Optimisation of Rice Flour Traits for the Production of Indigenous Rice Recipes
Ma. Edelwina Monterey Blasé*
School of Agriculture, Marinduque State College, Boac, Marinduque, Philippines 4900
Corresponding Author Email: dhel4blase@yahoo.com
DOI : http://dx.doi.org/10.12944/CRNFSJ.8.1.33
Download this article as:
![]()
The study aimed to optimize the rice flour characteristics using different rice varieties and milling methods and its effects on the flour traits. Seven varieties of rice, five non-waxy and two waxy types were obtained from Philrice and made into flour using two milling methods (wet and dry) and type of equipment. For the dry milling method, the disc attrition mill (DM) Quadrumat roller mill (QDM) were used. On the other hand, the wet milling method used plain water and (WM) alkali washing (AW). The flours produced were compared with the commercial rice flour from Thailand in terms of proximate composition, physicochemical characteristics, photomicroscopy and sensory evaluation.
Results obtained had notable difference in the parameters of % moisture, crude fat, ash, protein, apparent amylose content, gel consistency and starch damage.
The five non-waxy varieties comprise the different rice classification according to amylose content and gel consistency type. The commercial non-waxy Thai flour was found to be high amylose type rice variety with a soft gel consistency. Photomicrographs of different treatments showed that dry milled flours are bigger in size, irregular in shape and are clumped together while the wet milled and alkali washed flours have smaller appearance, circular in shape and are not clustered together but rather distinct from each particle. Two product models were done such as rice cake for the non-waxy flour while “palitao” for the waxy type flour. Sensory evaluation of rice cakes from non-waxy varieties showed that optimizing the water level of the flours brought satisfactory results for all treated flours. On the other hand, sensory evaluation of palitao on the waxy type variety were observed to have no noteworthy difference between the wet milled, alkali-washed flours and the commercial grade Thai flour in almost all sensory attributes evaluated.
Indigenous Rice; Optimisation; Rice Flour; Physicochemical Properties; Product Model Test; Proximate Analysis
Introduction
The staple food of about half of the world’s population especially in the low income- fast growing countries like the Philippines is Orysa sativa L. or Rice.1 Rice production in the global scenario were observed to largely support the domestic needs and only seven percent (7%) was allotted for rice trading internationally with five leading exporting countries like India, Thailand, Vietnam, Pakistan and the US for they comprise about eighty percent (80%) of the total rice exports beginning 2014.2 This scenario only implies that global rice market is in danger and will affect food security around the globe even at the slightest change.3
Rice consumption in Asia is between 40 to 46 percent (40-46%) of which comes from irrigated cropland from the 90 percent (90%) world’s total rice production.4,5 It remains as one of the most important staple food of the Philippines with superfluity of varieties and gastronomic use.6
It is further consumed mostly as cooked grains and is processed to puff rice,6,7 flour and starch which can be made into various products.5 However, to successfully use the rice flour into different products, properties like product quality and consistency should be analyzed to have good acceptability and satisfaction from consumers.8
Rice flour is usually used as the chief ingredient in numerous traditional foods due absence of gluten, low calcium and allergenic proteins.11 Some of the factors which are known to affect the nutritional value of rice are genotype, agronomic and cultivation condition, storage and processing.9,10,11 Furthermore, rice flour is a very good substitute for imported wheat flour in the bakery industry, although it cannot be used directly in bakery products without alterations and modifications since rice flour lacks gluten protein.12
Although this crop is rich in nutrients, consumption of rice leads to some disadvantage because some nutrients are lacking which is required for normal growth and development of the body. This is due to fairly weak functional characteristics of the proteins in rice since it has eighty percent (80%) glutelin which is insoluble in neutral water solutions.12,13 Rice flour, the finely ground powdery meal of rice kernel has a fairly good market for use as a food ingredient. The flour from rice usually comes from brown or white of a whole or broken grain which is processed by dry or wet milling. Its principal value is connected with the starch component, which consists of very small granules, about 8 to 10 microns in the largest dimension.13 Different rice varieties have different starch properties as reflected in the characteristics of rice flour. Most rice flour is ground. The good product may be used as it comes from the grinder or it may be sifted to obtain fractions with specific particle size distribution.
Rice is also noted for its non-allergenic properties hence, it is the first cereal recommended for infants.14 Other unique functional properties of rice flour are their flavor carrying capability, hypo-allergenicity and bland flavor, which make them desirable for use in value-adding products. Besides being consumed as a staple food, rice is a major ingredient in manufacturing value added food products such as puffed rice, noodles, rice flakes, extruded snack foods, fillers for food processed meats, low fat sauces, salad dressing and preparation of traditional rice products like rice cake (puto), kutsinta, espasol, tikoy, bibingka, palitaw and many other indigenous recipes. Hence, this study was conceptualized to investigate the rice flour traits of local varieties as affected by processing, equipment use and milling methods used.
Materials and Methods
The rice varieties used
Seven rice varieties composed of five non-waxy types and two waxy (glutinous) types with different physicochemical properties has been utilized as raw materials for rice flour production in this study. The non-waxy rice varieties also represent the three major classes of rice based on amylose classification. The non-waxy rice varieties are PSB Rc 52 (low amylose), PSB Rc 72, 18, & 82 (intermediate amylose), and PSB Rc 74 (high amylose). The waxy varieties on the other hand are IMS 5 and IR 65. All of rice varieties came from PhilRice and milling treatment used were dry milling, wet milling and alkali washing.
Dry milling was done using a disc attrition mill and quadromat roller mill designated as DM & QDM respectively. For the wet milling and alkali washing treatment, the milling equipment used was also the disc attrition mill designated as WM and AW. These are from both types of rice varieties (waxy and non-waxy).
Flour preparation for the Dry Milling and Quadromat Roller Milling Method (DM & QDM)
All rice varieties of about 1 kilogram each were milled using the disc attrition mill (DM) and Quadromat Roller Mill (QDM). Flour samples were sieved in a 100-mesh sieve and was packaged using Polypropylene plastic bags and stored in a desiccator until further analysis and use.
Flour Preparation
For the WM & AW treatment, all of the seven rice varieties used in this study were prepared according to the scheme presented in Figure 1.
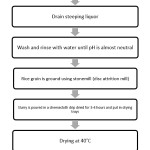 |
Figure 1: Schematic diagram of the flour preparation from different rice varieties Click here to View figure |
Proximate analysis
All of the flours were analyzed for moisture, protein, crude fat and ash adopting the Association of the Official Analytical Chemists standard method.16
Physicochemical Characteristics
The physicochemical characteristics of the 7 rice flour varieties consisted of amylose content, gel consistency and starch damage.
Amylose Content
The simplified method of Juliano (IRRI method)17 for determining amylose content was used. Around 75 mg ground rice (40 mesh) was transferred to a 75 mL volumetric flask. Two milliliters ethanol was added to each flask, and allowed to stand for at least two hours or preferably overnight at room temperature. After overnight standing, ethanol was decanted, (2 mL for non-de-fatted samples) ethanol was added to disperse sample. To each sample, 75 mL of 1 N sodium hydroxide (NaOH) was added and was set aside at ambient temperature for ten minutes. The samples were immersed for ten minutes using boiling water bath with gentle shaking. Cooling followed and the volume was adjusted using de-ionized distilled water. The sample was set aside at ambient temperature for thirty minutes (30 min) using a one hundred volumetric flask, fifty milliliter acetic acid solution and two milliliter iodine solution was incorporated to the mixture. Five milliliters of sample was pipetted into the second 100 mL volumetric flask and made up to volume with acetic acid solution. The color was allowed to develop for 20 minutes and the transmittance read at 620 nm. For the blank, (100% transmittance), 2 mL iodine solution was used and diluted to 100 mL with acetic acid solution. The percentage transmission was converted to % amylose by use of standard curve prepared as follows.
Seventy five milligram of pure amylose was weighed and placed in a 7.5 milliliter volumetric flask. Two milliliters ethanol and 7.5 ml of 1N sodium hydroxide (NaOH) was incorporated to the mixture and the volumetric flask was immersed in boiling water bath for ten minutes, cooled and diluted with distilled water until it reached seventy five milliliter. Standard concentration from 0.25-2.0 ml was prepared (1ml= 1 mg into one 100 ml volumetric flask) and diluted with distilled water until it reached one hundred milliliter. The mixture was allowed to stand for twenty minutes (20 min) with shaking. Absorbance of starch iodine complex was determined at 620 nm. Results were based on “as is (approximately 11% milled rice mixture content) basis.
Gel consistency
Gel consistency test adopted from Cagampang et al., (1973)18 was used in the study. Starch sample of about 0.1 g was weighed and placed in 13 x mm test tubes and 0.2 milliliter of ninety five percent ethanol with 0.025 percent thymol blue reagent was incorporated. The test tubes covered with glass marbles were refluxed and was allowed to cool1 at ambient temperature (26°C) for five (5) minutes. The mixture was placed in a water ice bath for fifteen (15) minutes. Subsequently, the test tubes were horizontally laid on a graphing scaled paper, and the length travelled by the gel was measured from the bottom of the test tube to the front of the gel after thirty to sixty (30-60) minutes.
Starch damage
Five hundred mg sample was dispersed in 50 mL of 0.25 N hydrochloric acid (HCl) solution and shaken at 55º C for two hours. The sample was centrifuged soon after at 2000 rpm for 20 minutes. Damaged starch (% glucose) was determined as 0.25 N hydrochloric acid (HCl) soluble carbohydrate (CHO)/flour dry weight x 100. Percent glucose was determined by phenol-sulfuric acid method. One milliliter of 1/10 aliquot of sample was prepared, and one milliliter of 5% phenol and 1% concentrated H2SO4 acid were added. The sample was then added which reagents and sample was substituted with water. A standard solution of glucose was prepared using 20-80 µg/mL glucose.
Photo-microscopy analysis
The different treated flours were subjected to microscopic examination using a photomicroscope. A pinch of the flour was placed in a glass slide and a drop of glycerol was added as the mounting fluid. Then the slide was covered with a cover slip and then was observed in the photo-microscope under the high power objective magnification. Pictures were then taken to observe the appearance of the different flours.
Product model to test the flour
The flour produced was tested using two product models. Rice cake or puto were made from the non-waxy varieties and palitao were from the waxy type varieties. Fifty grams of rice flour was soaked for half an hour in 80 mL water in a mixing bowl and mixed with an electric mixer at speed one for five minutes. Thirty grams of sugar was added and the batter was mixed for two minutes at speed one. Double acting baking powder (2.3 g) was added and mixed again for one minute. The butter was poured into greased aluminum pans (40 mm bottom dia. X 67 top dia. X 25 mm height) and steamed immediately for 30 minutes.
Palitao on the other hand was prepared by mixing rice flour with 40 mL water. The mixture was mixed and soaked for about an hour before making small balls, which were flattened and were dropped into a boiling water bath until it floated. Roasted sesame seeds, sugar and grated coconut were placed on top of the cooked palitao before serving.
Sensory evaluation was conducted using a scorecard with a seven-point quality scoring sensory parameters, which includes the following attributes: aroma/odor, taste flavor, off-flavor, texture, color, cohesiveness and general acceptability. A panel of fifteen judges was employed to evaluate the product.
Statistical Analysis
The data gathered from the study were analyzed for significant differences among varieties method of flour preparation or treatment and milling equipment by Analysis of Variance (ANOVA) and Duncan’s Multiple Range Test (DMRT).12
Result and Discussion
Proximate analysis of the rice flour
Table 1 summarizes the proximate properties and characteristics of the flour from different rice varieties and milling treatments. The moisture content of the rice flour samples ranges from 5.8-12.2%. The alkali washed flour having the lowest moisture content and highest was 12.2% from the disc attrition mill (dry milling). The moisture content of the dried milled samples is within the standard acceptable range for effective flour storage which is 10-13%.8,20
The moisture content of the flour is significantly different from each other as affected by the milling treatments. Other studies about rice flour21,22 have higher values observed for the moisture content (8.0-9.61). On the other hand, another study23 observed that milling method, processing procedure and temperature can affect the moisture content of rice flour. It further reiterates that if the moisture content is above 20%. Microbial growth is accelerated hence the moisture content should be below the 20% limit to have a longer shelf life.
The fat content of rice flour ranges from 0.22-2.10% (Table 1). The lowest value was observed in the Thai non waxy flour (0.22%) while the highest fat content was noted in the waxy dry milled (2.10%) rice flour. Statistical analysis showed that crude fat content of the two rice varieties is significantly different from each other depending on the milling treatments applied. Several authors20,24,25 have observed in their studies that the fat content of rice flour of different rice varieties varies and the reason why the values are variable may be due to varietal differences, environmental factors, sample processing, and milling methods.25,26,27
Further, well milled rice flours have lower fat content values than dry milled rice flours because washing alone could remove 25-65% of crude fat in milled rice hence the lowest values were observed from the wet milled, alkali washed and Thai rice flour which is also processed by wet milling.8
Ash Content
The ash content of the rice flour using two rice varieties and subjected to different milling treatments ranges from 0.14 (waxy, alkali washed) – 0.81% (non-waxy). The standard ash content value of milled rice ranges from 0.30-0.80% while for rough rice is 2.9-5.2%.23 The ash reflects the mineral content of the sample. Major properties of the fat, fiber, ash and vitamins of cereal grains are often removed with the bran during milling and pretreatment has a profound effect on the rice composition.28 Similarly, it was also observed that variations in ash content of rice flour are due to varietal differences, source and milling methods.25 Moreover, wet milled flour contains lower ash content due to washing process.8,23,24
Protein Content
Results of the protein determination of rice flour using waxy and non-waxy rice varieties (Table 1) ranges from 6.00 (waxy control Thai) – 7.64 (waxy dry milled). Statistical significance was also observed within treatments. Standard rice flour protein content ranges from 5-9%. The present results of the protein content coincides with the values observed with other several studies.21,22,25,26 These authors furthermore observed in their studies that variation of protein within varieties is usually influenced by the method of milling, as protein is mostly found in embryo tissue or aleurone layer which is removed during milling.29
Carbohydrate Content
Milled rice is rich in starch followed by protein.30 Results of the carbohydrate content ranges from 77.71 (DM, Waxy) – 86.77% (AW, NW). Statistical treatment also showed that significant differences were observed between rice type and milling treatment used. Observations of data showed that higher carbohydrate content was noted for wet milled rice treated flours than dry milled rice. Similarly, a study on wet milled rice flour showed lower protein and ash contents but higher carbohydrate content in the nine rice varieties studied.8 Thus, the results of the proximate composition of rice flours are indeed influenced by rice variety, milling treatments or methods as well as processing treatments.
Table 1: Proximate analysis of rice flour sample
| Proximate composition | Rice Type | Treatment/Rice Type | ||||
| DM | QDM | WM | AW | Thai | ||
| % Moisture | Non waxy | 11.75+0.05a | 11.21+0.01a | 6.75+0.03c | 5.80+0.02d | 8.30+0.04b |
| Waxy | 12.20+0.07a | 11.06+0.02a | 6.77+0.01c | 6.15+0.03d | 8.56+0.02b | |
| % Fat | Non waxy | 2.01+0.01a | 1.63+0.01b | 0.35+0.03d | 0.60+0.02d | 0.22+0.01d |
| Waxy | 2.10+0.04a | 0.82+0.03c | 0.53+0.02c | 0.89+0.03c | 1.41+0.02b | |
| % Ash | Non waxy | 0.52+0.02b | 0.46+0.04c | 0.81+0.01a | 0.26+0.05d | 0.39+0.03c |
| Waxy | 0.56+0.03b | 0.68+0.02a | 0.18+0.03d | 0.14+0.05d | 0.33+0.02c | |
| % Protein | Non waxy | 6.70+0.02b | 7.29+0.03a | 7.25+0.04a | 6.57+0.02b | 6.40+0.03b |
| Waxy | 7.64+0.05a | 6.24+0.01c | 6.75+0.02b | 6.65+0.01b | 6.00+0.02c | |
| % Carbohydrates | Non waxy | 79.0+0.02b | 79.41+0.03b | 84.84+0.02a | 86.77+0.01a | 84.09+0.03a |
| Waxy | 77.71+0.04b | 81.20+0.02b | 85.77+0.02a | 86.17+0.02a | 83.83+0.03a | |
*Values are average of three trials
Standard deviation +
DM (Disc attrition milling)
QDM (Quadrumat Roller Mill)
WM (Wet Milling)
AW (Alkali Washing)
Mean values with different letters are significantly different from each other (P<0.05)
Physicochemical Properties
The physic-chemical characteristics of rice flour using waxy and non-waxy rice types and subjected to different milling methods (dry, wet, alkali washed) are presented in Table 2.
Table 2: Physicochemical properties of rice flour
| Properties | Standard Values | Disc Attrition mill (DM) | Quadrumat Roller Mill (QDM) | Wet Milled (WM) | Alkali Washed (AW) | Thai (Commercial) |
| Amylose% | 2.30-30.0 NW | 19.3-24.2+ 0.06 | 18.43-24.13 + 0.05 | 16.3-22.4 + 0.02 | 20.43-24.27+ 0.04 | 25.57+ 0.05 (HA) |
| 1-2 W | 5.92+0.04a (VLA) | 3.7+ 0.05b (VLA) | 2.0 + 0.02c W | 3.74 + 0.04b(VLA) | 1.40 + 0.02c (W) | |
| Gel consistency | 26-40 (H) | 68.13 + 0.04a (S) | 74.87 + 0.004a (S) | 78.74 + 0.02a (S) | 67.2 + 0.02a (S) | 64.67 + 0.04a (S) |
| (mm) | 41-60 (M) | 58.0 + 0.04 b (M) | 85.17 + 0.02a (S) | 85.67 + 0.04a (S) | 83.50 + 0.04a (S) | 79.67+ 0.06a (S) |
| 61-100 (S) | ||||||
| Starch damage | NW | 18.10+0.03a | 5.23+0.02c | 2.75+ 0.03d | 15.0+0.02b | 2.09+0.02d |
| (%) | W | 30.74+0.02a | 5.24+0.03d | 5.26+0.02d | 14.83+0.04b | 10.52+0.03c |
Standard deviation + VLA (Very low amylose (2-10%)
DM (Disc Attrition Mill) NW (Non waxy) (>2%)
QDM (Quadrumat Roller Mill) W (Waxy amylose (1-2%)
WM (Wet Milling) Gel consistency
AW (Alkali Washing);
Thai (commercial rice flour ) Hard (26-40); Medium (41-60); Soft (61-100)
HA (High amylose) (>25%)
Mean values with different letters are significantly different from each other (P<0.05)
Amylose Content
Rice could be classified according to its amylose content. These classifications are 1) high amylose content which is greater than twenty-five percent, 2) very low which is two to ten percent, 3)non-waxy amylose content which is greater than two percent and 4)waxy which is one to two percent amylose content.31 The amylose content of grains is usually determined by the degree of translucency of the endosperm or waxiness. Moreover, cooking, eating qualities and industrial properties of the extracted starch are often affected by the amylose content of the grains.32
The amylose content of rice has a big role in the cooking characteristics of rice.33 Varieties of rice with high amylose content have harder texture during cooking compared to those having low amylose content.34
Similarly, rice containing high amylose has longer chains compared to rice with low amylose content33.
Based on the results presented in Table 2 under the amylose content, non-waxy varieties of rice ranges from 16.3-22.4 (under the wet milled treatment while the highest was 25.27 (Thai samples) and with a high amylose characteristics since it has the highest amylose among the other treatments. On the other hand, waxy varieties with a standard amylose content 1-2% ranges from 1.4 (waxy) – 5.92 (under DM milling method) with a very low amylose. The amylose content of the samples of rice flour in this study was observed to be within the amylose classification which was very low amylose (VLA) and Thai flour (25.27) having a high amylose content (HA).
Gel Consistency
A standard assay usually used for rice cultivars and breeding lines of high amylose content for either soft or firmed texture when rice is cooked is the gel consistency6,19,35 Gel consistency is classified as soft when consistency measurement ranges from sixty one to one hundred millimeters (61-100 mm), medium when measurement ranges from forty one to sixty millimeters (41-60mm) and hard consistency when consistency measurement is between twenty six to forty millimeters (26-40mm).1,34,35
From the results, it was observed that gel consistency was altered and affected by the milling treatment since the medium gel consistency varieties used in the study like PSB Rc 52, 72 and 74 exhibited a soft gel consistency after applying different milling treatments except for sample of rice using disc attrition mill which retained a medium gel consistency of 58.0 mm. Gel consistency37 is a measurement of the cold paste viscosity of cooked milled rice flour. It is also the index in distinguishing cooked rice texture with high amylose rice varieties.37
The lowest gel consistency reading (58-68 mm) was observed in the dry milled rice flour using the disc attrition mill which was considered as having a medium gel consistency while the highest gel consistency value was observed in the wet milled rice flour (78.74 – 85.67mm) having a soft gel consistency composition. Rice with soft gel consistency has a higher preference of acceptability among consumers37 hence; most breeders tend to develop rice genotypes with soft gel consistency.38,39
Starch Damage
Starch damage of the rice flour samples produced through different milling treatments are shown in Table 2. Results showed that for the non-waxy rice varieties the highest starch damage was observed in the disc attrition mill (DM) dry milled rice flour (18.10%) followed by the alkali washed rice flour samples using the same mill (15.0%). On the other hand, the lowest starch damage noted is the commercial Thai samples followed by the wet milled (WM) rice flour samples (2.75%). Moreover, for the waxy rice varieties, the same trend was observed wherein the dry milled flour has the highest starch damage while the wet milled flour has the lowest starch damage.
Studies have shown that milling processes produce different levels of damage to starch granules in the flour produced which are usually due to mechanical forces enforced on the grain during milling.19 The milling equipment used has an effect on the rice grains. The mill equipment pressed the rice against the abrasive ring at high rotating speed to break the grain structure. Moreover, heat exposure of milled rice during grinding is presumed to contribute mechanical damage to starch granules.20 This is expected especially with the kind of milling equipment which operates through the impact of the rotating hammer blades on the grain particles.
Studies have shown that milled flour have the highest percentage of damaged starch because of the lack of water which soften the rice grains and avoid abrasive pressure leading to high starch damage.20
On the other hand, for the wet milled process, there is less damaged starch since the soaking process of rice grain during wet milling and alkali washing affected the rice kernels making it softer, easily broken and resulting in small particle granules during the milling process thus, starch damage is much lower. The results observed in this study is in consonance with the results obtained20,28 from other studies.
Photomicrographs of Rice Flour
Photomicrographs using HPO magnification (40X) was done to the different treated rice flour to compare their appearance and shape as affected by the different milling treatments used.
Results showed that DM and QDM samples, which are dry milled have bigger size, irregular in shape and are clumped together to the WM and AW flour samples, wherein starch particles are distinct from each other and usually circular in shape and are well separated from each other.
Product model test
The product prepared from non-waxy rice flour was rice cake (puto). Water level was adjusted to have an optimum result for the different milling treatments. Fifteen panelists composed of students, research assistants, instructors and professors from the Institute of Food Science and Technology evaluated the samples.
Results showed that the optimum water level for Disc attrition Mill flour (DM) is 75 mL/50g flour and for wet milled (WM) flour is 85 mL/50g and Thai flour needs 90 mL/50g flour. Results showed that wet milled (WM) flour and Thai commercial flour alkali washed (AW) flour samples got the highest scores, but the rice cakes were not significantly different in terms of texture, cohesiveness and general acceptability.
The product model used for waxy rice flour was palitaw. Results of the sensory evaluation showed that for odor and flavor, there was no significance noted between treatments made, but they were significantly different in terms of taste, texture, color, cohesiveness and general acceptability. The lowest scores were observed for the Disc attrition Mill and Quadrumat Roller Mill (QDM) samples and highest for wet milled (WM), Alkali washed (AW) and Thai commercial flour.
Conclusion
After the tests done, the flour found most similar to the commercial grade from Thailand for the non-waxy variety were PSB Rc 18, 82 and 74 and the treatments Quadrumat Roller Mill (QDM), wet milled (WM) and Alkali washed (AW). These varieties were found to be near the characteristics of the commercial flour, which our country is presently importing based on the physicochemical analysis and sensory evaluation tests done on the flours.
For the glutinous or waxy type, the Alkali washed (AW) and wet milled (WM) treatments were found comparable to the commercial grade Thai flour, hence, this milling treatment could be used to prepare the flour. Furthermore, the rice variety used in the study can be used as well as the Alkali washed (AW) and wet milled (WM) milling treatment could be recommended to replace or substitute for the imported Thai glutinous flour.
In this study, it was found that for both rice types, physicochemical characteristics were affected by rice variety, type of milling and the milling method. The changes in the flour functional properties were greatly affected by the milling parameters used. Thus, the factors affecting the quality of rice flour are variety, milling methods and milling equipment used.5
Recommendations
The study has provided information on the rice flour’s physicochemical behavior using different process of flour preparation and different rice flour varieties. However, there are still some unfinished tasks to do such as to have an in depth study of the rice flour characteristics as affected by other factors like the behavior of rice flour when different rice varieties are used or when two or more varieties with different physicochemical characteristics are mixed and made into flour. Another area for further study would be the behavior of rice flour in different food systems aside from the indigenous recipes locally produced in our country. Moreover, the shelf life of the flour produced can be studied to be able to produce the flour in a bigger scale.
All these suggestion could offer a means to further improve our rice flour industry and someday provide our country high quality flour that is locally produced and readily available in the market that would benefit manufacturers and consumers.
Acknowledgement
The author wishes to thank the Lord Jesus for making things possible at all times. The Commission on Higher Education (CHED) for the financial support given for the completion of the research project, Philippine Rice Research Institute (PhilRice) for the varieties of rice used in the study as well as the laboratory equipment used in the analysis, UPLB Food Science Cluster for the proximate analysis and Marinduque State College (MSC) for the administrative support given to the author for the completion of this project.
Funding
The author(s) received no financial support for the research, authorship, and/or publication of this article.
Conflict of Interest
The authors do not have any conflict of interest.
References
- Maclean J., Hardy B., Hettel G. Rice Almanac: Source book for one of the most important economic activities on earth. IRRI. 2013 Dec 1.
- U.S. Department of Agriculture. Production, Supply and Distribution database. Foreign Agricultural Service; 2018 https://apps.fas.usda.gov/psdonline/app/index.html#/app/advQuery. Accessed on 2019 Mar 6
- World Bank. Global Food Crisis Response Program. Washington, DC: World Bank; 2013. http://www.worldbank.org/en/results/2013/04/11/global-food-crisis-response-program-results-profile. 2013 Apr 11. Accessed on 2019 Mar 6.
- International Rice Research Institute. Rice Almanac, Fourth Edition. Los Baños. 2013.
- Horgan F.G., Ramal A.F., Bernal C.C., Villegas J.M., Stuart A.M., Almazan M.L. Applying ecological engineering for sustainable and resilient rice production systems. Procedia food science. 2016;6:7-15.
- Joshi N.D, Mohapatra D., Joshi D.C. Varietal selection of some indica rice for production of puffed rice. Food and bioprocess technology. 2014;7(1):299-305.
- Cabanting, R.M.F. and Perez, L.M., 2016. An ethnobotanical study of traditional rice landraces (Oryza sativa L.) used for medical treatment in selected local communities of the Philippines. Journal of ethnopharmacology, 194, pp.767-773.
- Leewatchararongjaroen J., Anuntagool J. Effects of dry-milling and wet-milling on chemical, physical and gelatinization properties of rice flour. Rice Science. 2016;23(5):274-81.
- Falade K.O., Christopher A.S. Physical, functional, pasting and thermal properties of flours and starches of six Nigerian rice cultivars. Food Hydrocolloids. 2015;44:478-90.
- Peries C.M., Wijesekara K.B., Navarathne S.B. Effect of freezing and hot water soaking on the functional properties of rice flour derived from four Sri Lankan traditional rice varieties. Procedia food science. 2016;6:68-72.
- Reddy, C.K., Kimi, L., Haripriya, S. and Kang, N., 2017. Effects of polishing on proximate composition, physico-chemical characteristics, mineral composition and antioxidant properties of pigmented rice. Rice Science, 24(5), pp.241-252.
- Li X., Liu Y., Li N., Xie D., Yu J., Wang F., Wang J. Studies of phase separation in soluble rice protein/different polysaccharides mixed systems. LWT-Food Science and Technology. 2016;65:676-82.
- Gharibzahedi S.M. Favorite and traditional rice flour-based puddings, breads and pastries in the North of Iran: a review. Journal of ethnic foods. 2018 Apr 4.
- Juliano, B.O., 1993. Rice in human nutrition (No. 26). Int. Rice Res. Inst..
- BeMiller J.N., Whistler R.L, editors. Starch: chemistry and technology. Academic Press; 2009 Apr 6.
- AOAC (Association of Official Analytical Chemists), 2005. Official methods of analysis of the Association of Analytical Chemists International.
- Juliano, B.O., 1971. A simplified assay for milled rice amylose. Cereal Sci. Today, 16, pp.334-360.
- Cagampang, G.B., Perez, C.M. and Juliano, B.O., 1973. A gel consistency test for eating quality of rice. Journal of the Science of Food and Agriculture, 24(12), pp.1589-1594.
- Tran N.A., Daygon V.D., Resurreccion A.P., Cuevas R.P., Corpuz H.M., Fitzgerald M.A. A single nucleotide polymorphism in the Waxy gene explains a significant component of gel consistency. Theoretical and Applied Genetics. 2011;123(4):519-25.
- Asmeda, R., Noorlaila, A. and Norziah, M.H., 2015. Effects of different grinding methods on chemical and functional properties of MR211 rice flour. Int. J. Food Eng, 1(2), pp.111-114.
- Islam, M.Z., Taneya, M.L.J., Shams-Ud-Din, M., Syduzzaman, M. and Hoque, M.M., 2012. Physicochemical and functional properties of brown rice (Oryza sativa) and wheat (Triticum aestivum) flour and quality of composite biscuit made thereof. The Agriculturists, 10(2), pp.20-28.
- Nura, M., Kharidah, M., Jamilah, B. and Roselina, K., 2011. Textural properties of laksa noodle as affected by rice flour particle size. International Food Research Journal, 18(4), p.1309.
- Jamal, S., Qazi, I.M. and Ahmed, I., 2016. Comparative studies on flour proximate compositions and functional properties of selected Pakistani rice varieties. Pakistan Acad Sci, 53(1), pp.47-56.
- Chaiwanichsiri, S., Thumrongchote, D., Suzuki, T. and Laohasongkram, K., 2012. Properties of non-glutinous Thai rice flour: effect of rice variety. Research Journal of Pharmaceutical, Biological and Chemical Sciences, 3(1), pp.150-164.
- Han, H.M., Cho, J.H. and Koh, B.K., 2011. Processing properties of Korean rice varieties in relation to rice noodle quality. Food Science and Biotechnology, 20(5), p.1277.
- Wadchararat, C., Thongngam, M. and Naivikul, O., 2006. Characterization of pregelatinized and heat moisture treated rice flours. Kasetsart J.(Nat. Sci.), 40, pp.144-153.
- Kanlayakrit, W. and Maweang, M., 2013. Postharvest of paddy and milled rice affected physicochemical properties using different storage conditions. International Food Research Journal, 20(3).
- Chiang, P.Y. and Yeh, A.I., 2002. Effect of soaking on wet-milling of rice. Journal of Cereal Science, 35(1), pp.85-94.
- Pérez, E., Baragaño, M., Arteaga, M. and Schroeder, M., 2009. Proximal composition and categorization by the amylose content of rice (Oryza sativa L.) varieties. Revista de la Facultad de Agronomía (UCV), 35(3), pp.94-99.
- Juliano B.O. Rice in human nutrition. Int. Rice Res. Inst.1993.
- Juliano B.O. The chemical basis of rice grain quality. Chemical aspects of rice grain quality. 1979;69-90.
- Preiss J. Biochemistry and Molecular Biology of Glycogen Synthesis in Bacteria and Mammals and Starch Synthesis in Plants. 2010; 429-491.
- Puri, S., Dhillon, B. and Sodhi, N.S., 2014. Effect of degree of milling (Dom) on overall quality of rice—A review. Int. J. Adv. Biotechnol. Res, 5, pp.474-489.
- Juliano, B.O. and Perez, C.M., 1983. Major factors affecting cooked milled rice hardness and cooking time. Journal of texture studies, 14(3), pp.235-243.
- Graham, R., 2002. A proposal for IRRI to establish a grain quality and nutrition research center (No. 2169-2019-1615).
- Cagampang, G.B., Perez, C.M. and Juliano, B.O., 1973. A gel consistency test for eating quality of rice. Journal of the Science of Food and Agriculture, 24(12), pp.1589-1594.
- Chemutai, L.R., Musyoki, M.A., Kioko, W.F., Mwenda, N.S., Muriira, K.G. and Piero, N.M., 2016. Physicochemical characterization of selected Rice (Oryza Sativa L.) genotypes based on gel consistency and alkali digestion. Biochem Anal Biochem, 5(3), p.285.
- Prakash, J., 2019. Physico-Chemical and Cooking Properties of Selected Rice Varieties. Acta Scientific Nutritional Health, 3, pp.23-30.
- Wang, L.Q., Liu, W.J., Xu, Y., He, Y.Q., Luo, L.J., Xing, Y.Z., Xu, C.G. and Zhang, Q., 2007. Genetic basis of 17 traits and viscosity parameters characterizing the eating and cooking quality of rice grain. Theoretical and Applied Genetics, 115(4), pp.463-476.
Accepted on: 25/03/2020
Second Review by: Dr. Wafaa Abd El-Ghany Abd El-Ghany Egypt
Final Approval by: Dr. Dan C. Vodnar


Web of Science Coverage
Emerging Sources Citation Index (ESCI)
2024 Journal Impact Factor: 1.1
Scopus Journal Metrics
CiteScore 2025: 2.6
CiteScore Details
Sustainable Nutrition: Food Systems, Nutrient Retention, and Public Health Impact
![]()
This journal is a member of, and subscribes to the principles of, the Committee on Publication Ethics (COPE)


