Sociodemographic Variables Associated with the Prevalence of Insulin Resistance Using a Non-Invasive Score System Among Adults in the Makkah Region of Saudi Arabia
Hassan Mazher Bukhari*
Clinical Nutrition Department, Faculty of Applied Medical Sciences, Umm Al Qura University, Makkah, Al Badyah, Taif Road, Saudi Arabia.
Corresponding Author E-mail: hmbukari@uqu.edu.sa
DOI : http://dx.doi.org/10.12944/CRNFSJ.11.2.19
Download this article as:
![]()
Insulin resistance is considered as one of the significant causes of morbidity and mortality as it might develop diabetes, heart, and renal diseases. To investigate the prevalence of Insulin resistance in the Makkah region in Saudi Arabia and the related risk sociodemographic Method: An online valid questionnaire was collected from a random sample of only Saudi 1514 adults; non-Arabic speakers and non-Saudi were excluded. The related sociodemographic data was gathered. The insulin resistance risk score was conducted using a non-invasive easy scoring system based on Lindstrom and Tuomilehto's study18. In total, 70% of the sample had a lower risk level, and only about 14% with higher risk compared to 16% with no risk. Individuals at a higher risk of insulin resistance were males, with high-income levels (≤10,000SR) and elementary education. The most common risk of insulin resistance was at a moderate risk level for males with high income and lower education levels.
KEYWORDS:Insulin Resistance; Non-Invasive Scoring System; Saudi Arabia; Sociodemographic Factors; The Makkah Region
Introduction
Insulin resistance is the failure of target tissues to respond normally to insulin. The liver, skeletal muscle, and adipose tissue are the primary tissues where insulin resistance gives rise to abnormal glucose tolerance1. Insulin resistance inhibits glucose elimination, which causes a compensatory rise in beta-cell insulin secretion and hyperinsulinemia. This prediabetic stage could be carried on for years. When the body’s cells resist insulin functions, glucose accumulation in the blood is above normal levels. After periods the patient will be diagnosed with type 2 diabetes (T2DM)2,3. About 48 million suffered from impaired glucose tolerance, which indicated the presence of insulin resistance. This figure is translated into 27 million lives with diabetes or prediabetic stage before they are diagnosed4
However, T2DM prevalence indicates the presence of IR as one of the symptoms. In a recent report by Diabetes UK Organization, it is estimated that 19% of the Saudi population is affected by diabetes, counting about a million adults in Saudi Arabia5. A study by Al Qahtani et al6 found that the figure is lower than the UK report to be 8.5% for people aged 15 and above. It is also higher in males than females (10.3% vs 9.9%) respectively. It is highest in the age group of 60 and more, affecting half of this age category.
The prediabetic and T2DM stages are associated with many manifestations. Accumulation of glucose in the blood has adverse effects on the blood vessels leading to the hardening blood small veins, arteries, and capillaries, reducing blood flow. In association with obesity, hypertension, and T2DM will enhance the development of cardiovascular diseases (CVDs) 1,7.
The incidence and prevalence of insulin resistance are rising fast in the world. IR prevalence in Southeast Asia from 2016 to 2021 was 44.3 percent4,8. A new study found that 33.7% of the Brazilian population in a rural area suffers from IR9. About 40% of persons in the United States (US) aged 18-40 years are affected by insulin resistance syndrome, making it a relatively widespread condition10. The recent international diabetes federation indicated that diabetes in the middle east was diagnosed in 73 million adults, which is highly associated with an increased prevalence of insulin resistance.
Nonetheless, some studies were conducted directly in Arabic countries to measure insulin resistance. For example, in a recent survey by Fahad et al group11, the estimated insulin resistance in Lebanon was 38.0%. In Qatar’s national study, the prevalence of insulin resistance in females was up to 37 percent12. A study by Bahijri et al (2010)13 using lab analysis for insulin and glucose for an abnormal cut-off point found that 64.6% of the study sample has insulin resistance.
Those studies depended on different assessment methods to measure insulin level and resistance. Clinical tests like the hyperinsulinemia clamp, modified insulin suppression test, the Homeostatic Model Assessment (HOMA) evaluation, Quantitative Insulin Sensitivity Test Index (QUICKI) quantitative insulin sensitivity test index, fasting insulin, and glucose concentrations can be used to assess insulin resistance accurately 8-13.
However, those are invasive tests and very expensive and time-consuming. Therefore, some risk factors can be used as indicators for insulin resistance; for instance, high blood pressure, triglycerides, a waist measurement that greatly predicts central and abdominal obesity, and a body mass index. Several studies have developed and used a simple score without needing a hospital or equipment at home to define the prediabetic prevalence for the public2,13-15.
This scoring system came from many countries around the world; the most common scale of IR is obtained from the National Health Service (NHS) trust in cooperation with the University of Leicester to predict the risk of developing T2DM in the next ten years using non-invasive scoring system16, which is found the website of the Diabetes UK organzation17. A more explicit approach was found in the study by Lindstrom and Tuomilehto18, which clearly explained this scoring system. To the research group’s knowledge, no study in 2020-2021 has used this approach to screen IR prevalence in Saudi Arabia using a non-invasive technique.
Furthermore, most of the studies covered the symptoms and risk factors associated with increasing the prevalence of IR. However, only some focus on identifying the sociodemographic factors associated with increasing this public health issue, particularly in the middle east or the Gulf regions. Thus, this current study aimed to investigate the prevalence of insulin resistance in the Makkah area in Saudi Arabia and study the associated sociodemographic factors.
Methodology
Subjects and Methods
Subjects’ inclusion and exclusion criteria
The inclusion criteria were for an individual aged 18 years and older from Saudi Arabia who speaks and reads Arabic. The exclusion criteria were for individuals under 18—additionally, any respondents with missing data, non-Saudi, or those who do not speak Arabic.
Sample size and sampling
The current study included 1514 healthy adults from the Makkah region in Saudi Arabia. A convenience random sampling technique was employed to select the sample. According to the report by Global Media Insight19, the population in 2022 is about 35,840,000 in Saudi Arabia19. The Makkah region was chosen because it is one of the largest and most populated areas in Saudi Arabia, with multiple ethnic varieties of the population as immigrants move to Saudi for religious and economic reasons and for the easy and significant response rate to be obtained. According to recent formal statistics, the population in the Makkah region is about nine million inhabitants20.
Using calculator.net online software (https://www.calculator.net/sample-size-calculator.html, a sample size of at least 385 was sufficient for this study. This inhabitants number means 385 or more surveys are needed with a confidence level of 95% and a margin error of 5%. The collection of 1514 was above the required sample size with a 94% response rate.
Methods
Study design
A randomized, cross-sectional study using a closed-ended validated questionnaire was collected from November 13, 2020, to March 23, 2021, during the academic year of 2020/2021.
Data collection questionnaire
This questionnaire was developed and validated by a team of researchers in 2020 (data not published but available as supplementary materials). The questionnaire was developed based on several studies’ suggested questionnaires in this regard and to include the risk factors and basic information14,18. The questionnaire comprises five parts: personal information, anthropometric measurements, lifestyle information, information related to the medical condition, and family medical history. Personal information includes age, gender, educational level, and income.
For the validity of this questionnaire, it was first reviewed by the team, then by three specialized high-rank professors in nutrition and research in the Department of clinical nutrition. Finally, a first draft was distributed to a small test sample of 30 or so respondents who provided the team with comments and suggestions to modify and change questions. After approval, a final version was used and distributed through social media to reach many platforms. This online approach was followed due to the Corona pandemic that prohibited face-to-face meetings applied till the end of 2022. In addition, for a convenient sample collection from broad and distanced respondents in the Makkah region.
The first page was a consent form for the participants to agree to participate in the project and that all their data would be confidential. Finally, they have the right to withdraw from completing the questionnaire and participate in the study as they wish. The ethical approval number (HAPO-02-M-11-2020-12-912) has been obtained for the project. Data from this questionnaire was used to develop the risk level score and investigate the association between sociodemographic factors and risk levels.
Insulin resistance score formation
A simple risk score to screen for IR prevalence was the aim. Hence, identity prediabetics typically appear as individuals from the society of the Makkah region. We aimed to use an IR risk score that includes variables that were measured routinely, objectively, cheaply, quickly, and non-invasively in any primary clinical setting or even by the general public. A cross-sectional study from the Finnish Diabetes Risk Score leads the team to consider using this approach21. Additionally, the tool of Leicester Risk Assessment score developed by Leicester University and University Hospitals of Leicester NHS Trust was under scrutiny by the team16. Finally, to detect the prevalence of insulin resistance using a simple scoring method, the Lindstrom and Tuomilehto study’s group18 score was decided to be used.
The Lindstrom and Tuomilehto study’s group18 score provided all participants with a score according to answering seven questions (1-age, 2-BMI, 3-waist circumference, 4-used drugs for high blood pressure, 5- having Diabetes or no, 6- Do physical activity or no, 7- daily consumption of vegetables, fruits, or berries).
However, two modifications from Lindstrom and Tuomilehto18 were applied to the risk factors included in the current study. One had more dietary risk factors questions (3 questions instead of one (1-Type of snack, 2-eat breakfast or skipping, and 3-number of meals) to show more focus on nutrition as previously well known that diet has a considerably more significant on insulin resistance and diabetes development. Thus, the risk factors were increased to nine instead of seven (Table 1). The cut points to define those who have risk was the same as stated previously by Lindstrom and Tuomilehto18. These cut points also were applied to the three dietary questions.
Thus, each participant will have a total score when gathering all points given.
Table 1: The nine risk factors related to insulin resistance were in the questionnaire.
|
Risk factors |
Not having risk |
Having risk |
|
Age (years) |
≥ 54 =2 |
55 and more=3 |
|
BMI |
Normal and less 30 = 1 |
More than 30=3 |
|
Waist Circumference |
Below 88 for women and 102 for men =3 |
Over 88 for women and 102 for men=4 |
|
Have you ever used drugs for high blood pressure? No/Yes |
No =0 |
Yes=2 |
|
Having a history of diabetes in the family or being told that you have diabetes |
No, or do not know=0 |
Yes =5 |
|
Physical activity |
Yes=0 |
No= 2 |
|
Diet factor 1 Number of meals |
Four and below=0 |
More than four meals=1 |
|
Diet factor 2 dietary pattern |
Healthy pattern=0 |
Unhealthy habit and other related =1 |
|
Diet factors 3 Skipping breakfast |
No-Skipping or sometimes=0 |
Skipping=1 |
|
Total score |
6 |
22 |
The second variation from the previous score is that the total score in the last study starts from zero for the participant as a whole point. Nonetheless, the range of scores in the current study is from 6 to 22. The reason is that for the 1st three risk factors, namely, age, BMI, and waist circumference, each individual should have a value even if not having risk with a total of six points. The total score for everyone is then separated into levels. Namely, the three score levels, different from Lindstrom and Tuomilehto18, divided participants into four risk levels.
The first is because the minimum to maximum score range differs from the Lindstrom and Tuomilehto18. In other words, the total score value was 22 in the current study compared to 20 in the previous study. To Lindstrom and Tuomilehto, table 2, page three18, the first level was 0-3, and the 2nd was 4 to 8 points for each participant. Meanwhile, in the current study, the lowest score is 6 points, and the maximum has been 22. Thus, the lower two levels are mostly incomparable (0-8 points). This subdivision also makes the risk level higher than it could be true.
Additionally, in the current study, in each risk level, the same range for points is provided apart from the last 3rd and highest risk level to put more weight that was similar to Lindstrom and Tuomilehto18, which put more weight on the last 4th level, which means more risk factors were found in the respondents increasing the chance of developing diabetes (table 2).
Table 2: The risk levels of insulin resistance for all participants.
|
Lindstrom and Tuomilehto |
Score in the current study |
Levels |
|
0-3 |
0-6 |
No risk |
|
4-8 |
7-12 |
lower risk |
|
9-12 |
13-22 |
Higher risk |
Data analysis
Minitab version 21 software was used to analyze the data collected in this study statistically. Frequencies and percentages were used to describe the sociodemographic data of the participants and to analyze the data related to the prevalence of insulin resistance. The chi-square test was used for categorical data with a 5% significant level for significant association.
Results
Table 3: Sociodemographic characteristics of the participants (n=1514).
|
Variables |
Categories |
n |
% |
|
Gender |
Female |
909 |
60.04 |
|
Male |
605 |
39.96 |
|
|
Age groups |
18-20 |
37 |
2.44 |
|
21-29 |
202 |
13.34 |
|
|
30-39 |
415 |
27.41 |
|
|
40-49 |
281 |
18.56 |
|
|
50-59 |
262 |
17.31 |
|
|
60-65 |
215 |
14.20 |
|
|
66 and above |
102 |
6.74 |
|
|
Income levels |
Below 1500 SR |
352 |
23.25 |
|
more than 1500 to 3500sr |
97 |
6.41 |
|
|
more than 3500 to 5000sr |
220 |
14.53 |
|
|
More than 5000 to 10000 SR |
278 |
18.36 |
|
|
more than 10,000 |
567 |
37.45 |
|
|
Education levels |
Elementary Stage |
30 |
1.98 |
|
high school or equal |
240 |
15.85 |
|
|
diploma after high school |
266 |
17.57 |
|
|
Bachelor’s degree |
817 |
53.96 |
|
|
Higher Diploma |
31 |
2.05 |
|
|
Master’s degree |
51 |
3.37 |
|
|
PHD |
79 |
5.22 |
Table (3) indicates that 60.04% (909) were females and 39.96% (605) were males. Out of all participants, 2.44% (37) were 18-20 years old, and 13.34% (202) of the 21-29 years group. 27.41% (415) were aged between 30 to 39 years old. This group was the highest ratio of age groups. The age groups after getting lower gradually. For the income levels, the largest group had an income level of more than 10,000 SR (37.45%, n 567). They were followed by the lowest income group of 1500 SR and below (23.25%, n 352). The smallest ratio goes to the income group of more than 1550 to 3500 SR (6.41%, n 97). Finally, for education levels, more than half comes from the holders of the bachelor’s degree group (53,96%, n 817), followed by about 18% of diploma holders after high school. The high school holders represent about 16% (n 240). The rest of the education groups have about 2-5% smaller proportions.
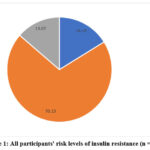 |
Figure 1: All participants’ risk levels of insulin resistance (n = 1514). |
From Figure (1), it is clear that around 70.15% of the participants occurred at a lower level of risk of insulin resistance. However, about 13.67% are at a higher level of risk compared to 16.18% who do not have a risk.
The sociodemographic variables associated with the risk levels
Table 4: IR risk levels with genders.
|
Gender groups |
No risk |
Lower risk |
higher risk |
Person X2 (p-value) |
|
Female |
140 (15.4) |
659 |
110 |
6.758 |
When dividing the sample by gender and risk levels, as shown in table (4), it shows that the male group was peculiarly found more in border levels, where 16% vs 12% were found in the higher risk group compared to females. Additionally, the males were found than females in the no-risk groups (17.4% vs 15%), respectively. Thus, most of the female group was found in the lower risk level (about 73%). The difference was statistically significant (p=0.034).
Table 5: IR risk levels with income levels.
|
Income levels |
No risk |
Lower risk |
higher risk |
Person X2 (p-value) |
|
Below 1500 SR |
69(19.60) |
247(70.17) |
36(10.23) |
19.552 (0.012) |
|
More than 1500 to 3500 SR |
23(23.71) |
67(69.07) |
7(7.22) |
|
|
More than 3500 to 5000 SR |
36(16.36) |
152(69.09) |
32(14.55) |
|
|
More than 5000 to 10000 SR |
45(16.19) |
194(69.78) |
39(14.03) |
|
|
More than 10,000SR |
72(12.70) |
402(70.90) |
93(16.40) |
Table (5) shows that statistically significant differences were found between all income groups when dividing the sample by income levels and risk levels. The table shows that the income of more than 1500 to 3500 SR group was mainly in the no-risk level compared to all other income levels. However, it is noticed that the higher the income, the more respondents to be found in the higher risk group. Furthermore, about 70% of all respondents were in lower-risk groups across all income levels.
Table 6: Education levels and IR risk levels.
|
Education levels |
No risk |
Lower risk |
higher risk |
Person X2 (p-value) |
|
Elementary Stage |
2 (6.67) |
15 (50.00) |
13 (43.33) |
26.54 (0.009) |
|
high school or equal |
41 (17.08) |
169 (70.42) |
30 (12.50) |
|
|
diploma after high school |
42 (15.79) |
192 (72.18) |
32 (12.03) |
|
|
Bachelor’s degree |
133 (16.28) |
577 (70.62) |
107 (13.10) |
Table (6) shows the association between education levels and risk levels, and statistically significant differences were found between all education groups. The table shows that the lower education level group (elementary stage holders) was primarily found in the higher risk level compared to all other education categories. However, it is noticed that the higher the education, the more respondents to be found in the no-risk groups. Furthermore, 50-75% of all respondents were in the lower-risk group across all education levels.
Discussion
The World Health Organization (WHO)22 has ranked Saudi Arabia as the Seventh highest country with T2DM worldwide and estimated that 7 million have diabetes while over 3 million are prediabetes 22. Assessment of insulin resistance would be a precedential step in identifying those who will develop T2DM shortly. Several studies were carried out regarding insulin resistance prevalence among different populations. Many factors were approved to lead to an increase in the prevalence of insulin resistance, hence could be developed into T2DM. Those risk factors are obesity, particularly central obesity, no physical activities, a family history of diabetes and hypertension, or being diabetic and hypertensive, combined with poor diet and being older male. All those factors were long established as a risk to developing diabetes, and the higher the presence of these factors, the larger the incidence of T2DM.
Thus, this study aimed to use those factors to develop a non-invasive score system for insulin resistance. Hence, a score was built similar to the study by Lindstrom and Tuomilehto18, which had some modifications as stated in the methodology. From that score, the prevalence of insulin resistance was found in the Makkah region, Saudi Arabia. The current study has found that about 84% of all participants are either at lower or higher risk compared to only 16% of those with no risk. A study by Bahijri et al group (2010)13 showed that about 65% of randomly nondiabetic Saudi adults aged 18-50 years in Jeddah city had high insulin resistance, which is very similar to the lower-risk group in the current study, with the majority found in the lower risk group (70%).
Other studies’ findings have indicated a much lower prevalence of insulin resistance in Saudi Arabia, 39.8%, for example, Al-Rubeaan et al23, to be as low as 7% as shown in Alowfi et al24 study. This distinctive difference may be due to the range of age of the study sample of Alowfi et al24. Additionally, Alowfi et al24 project included only a very young female group of participants (age range of 12-19 years), contrary to the results by Al-Zahrani et al25, which indicated that the overall prevalence of insulin resistance in Saudi Arabia was 18.8% %. In a review by a Malaysian group to measure IR in some Southeast Asia countries, Goh et al study8 found the prevalence to be 44%. All these studies have used the invasive lab-based approach to measure insulin and glucose levels and identify those with insulin resistance. Nonetheless, using fasting glucose or insulin only might not be sufficient to diagnose diabetes. In particular, for prediabetic stages, changes are not developed to diabetes.
In comparison to other findings of studies using the same non-invasive questionnaire and score system approach as the current study, Winkler et al2, in an extensive study of more than 40,000 subjects who appear normal (prediabetic and might have insulin resistance) insulin resistance found in 41% of the participants. Women had a higher proportion in the higher-risk group of IR than men (42% vs 39%). This group was still a lower portion than the current study of 84% of those with IR risk, regardless of the risk level. In a recently published study in the Gulf area, which is highly comparable in culture, diet, education, income level, and lifestyle, Abbas et al study in Qatar26 using a similar principle as Lindstrom and Tuomilehto18 and other sources were screened for IR. In the Qatar study, half of the respondents were found in moderate or lower risk, in addition to 68% at a higher risk level.
In general, the current study found that the total number of individuals at high risk for developing insulin resistance was higher in males than in females, with numbers (16% vs 12%), respectively. Bahijri et al (2010)13 found supportive evidence indicating that about 88% of males and 54% of females in the Saudi study were obese and had IR, but no statistically significant level was observed. On the contrary, a study by Winkler et al2 indicated that the proportion of women with IR was higher (41.8% vs 39.8%; p<0.001). Even though the same study found that men more than women have a higher prevalence rate of diabetes (8.6% vs. 7.1%). This variation might stem from the age group and the different population, as it was done in Hungary on patients who had received medical care in a hospital. The Bahijri research group conducted another study in 201627, again in The Makkah region in Saudi Arabia, which found the prevalence of prediabetes was 9.4% vs 8.6% in males compared to females, respectively.
Regarding the income level, Afifi et al28 in Saudi Arabia have found that the lowest income level was associated with relatively higher RPG levels (10,000SR- 20,000) which might indicate a prediabetic with IR status. However, the current study is relatively different in the scale of income levels, where it has placed together any income from 10,000SR and above in one category. Nonetheless, the higher income group was the highest affected by IR. Those findings contradict the study by Xie et al29 in the USA, which finds that the lower the income, the higher the risk of developing IR. Thus, the group with the lowest income has 1.56 folds risk levels compared to all higher income categories of <10,000$ (40,000SR). This income scale, again, is mainly different from the Saudi one.
Nevertheless, in principle, it shows that the presence of IR in the USA is related to lower income. IR’s high level might be because the food intake of the Saudi high-income group could be varied and have higher diet quality, but it also shows that the higher the income, the more consumption of deserts, sweet and fatty meat, and processed foods. These food habits, usually combined with less consumption of fruits and vegetables, lead to obesity, IR, and later might progress into T2DM30,31. This dietary intake habit was developed at the early stages of life for the Saudi population as a study by Mumena et al32 found that the higher the income, the more fast food and consumed food items. In the long run, all these will lead to IR and obesity, hence, T2DM.
It was found in the current study that the lower-educated group has a higher risk of IR. In an exploratory study of females only in Saudi Arabia in the Alkharj area, the less educated group has a significantly increased risk of IR25. Almubark et al study33 in a large sample of the Saudi population of about 20492 covering all regions found that diabetes was associated with lower educational level. A European study also supported the association of education and a higher level of IR, which demonstrated that individuals with a lower education background had a higher rate of DM than those with a higher education34.
Conclusion
Thus, the current study has found that IR is prevalent in the study sample on a large scale, and males with a high-income level (more than 10,000 SR) and being in a lower educational category (elementary) are more likely to be in a higher risk of developing T2DM in the longer run.
Recommendations
This study recommends designing and implementing educational programs to create awareness about the lifestyle-related risk factors for insulin resistance among the general population and patients. Those awareness campaigns will effectively contribute to lowering the prevalence of insulin resistance risk factors by setting public awareness and supportive policies, reducing IR and prediabetic or diabetic prevalence.
The strength of the study
The strengths of our study include that it is considered a preliminary cross-sectional study assessing the prevalence of insulin resistance in The Makkah region of Saudi Arabia for the first time. Likewise, it enrolled people from various age groups, including adults, different educational levels, various jobs, and even unemployed, to yield a representative study sample.
Limitations of the study
Limitations of our study include that 909 (60%) of our sample were females, who are reported to have higher rates of insulin resistance than males. In addition, the small sample size limits generalizability, so further future studies with larger sample sizes to better represent the whole population are required. The discrepancy regarding the percentage of insulin resistance was explained by an online questionnaire, not a face-to-face interview.
Future implications of our research include that further studies are required to establish the prevalence of all counties in Saudi Arabia. Also, other studies are recommended to assess the awareness after implementing educational approaches regarding insulin resistance for both males and females.
Acknowledgements
Special thanks to the volunteers on this study and to the Department of clinical nutrition for allowing this study to be completed. To the Institute of Scientific Research and Revival of Islamic Heritage (ISR) at Umm Al-Qura University for project number 43309023 for funding the research project.
Conflict of Interest
The author declares no conflict of interest.
Funding Sources
The Institute of Scientific Research and Revival of Islamic Heritage (ISR) at Umm Al-Qura University supported and funded this research under Grant number 43309023.
References
- Kumar A, Abbas AK, Aster JC. Robbins and Cotran pathologic basis of disease. 10th ed. Chicago: Elsevier – Health Sciences Division; 2020.
- Winkler G, Hídvégi T, Vándorfi G, Balogh S, Jermendy G. Prevalence of undiagnosed abnormal glucose tolerance in adult patients cared for by general practitioners in Hungary. Results of a risk-stratified screening based on FINDRISC questionnaire. Medical Science Monitor. 2013;19:67-72.
CrossRef - Ekoe JM, Goldenberg R, Katz P. Screening for diabetes in adults. Canadian Journal Diabetes. 2018;42(Suppl. S1):S16-S19.
CrossRef - The International Diabetes Federation (IDF). Diabetes Atlas 2021. The USA. IDF. 10th ed. ISBN: 978-2-930229-98-0. 2021: 2-3. Available at: www.diabetesatlas.org. Accessed April 12, 2022.
- Diabetes UK. Countries with the highest number of diabetes cases unveiled. The UK. The Diabetes UK Organization. [Updated 7.6, 2023]. Available at: https://www.diabetes.co.uk/news/2023/jun/countries-with-highest-number-of-diabetes-cases-unveiled.html. Accessed April 12, 2023.
- Al Qahtani B, Elnaggar RK, Alshehri MM, Khunti K, Alenazi A. National and regional prevalence rates of diabetes in Saudi Arabia: analysis of national survey data. International Journal of Diabetes Developing Countries. 2023;43:392-397.
CrossRef - Fujishima M, Kiyohara Y, Kato I, et al. Diabetes and cardiovascular disease in a prospective population survey in Japan, The Hisayama Study. Diabetes.1996;45(Supple. 3):s14-s16.
CrossRef - Goh LPW, Sani SA, Sabullah MK, GansauJA. The prevalence of insulin resistance in Malaysia and Indonesia: an updated systematic review and meta-analysis. Medicina (Kaunas). 2022;58(6):826. https://doi.org/10.3390/medicina58060826
CrossRef - Ferreira J, Zandonade E, Bezerra M, Salaroli L. Insulin resistance by the triglyceride-glucose index in a rural Brazilian population. Archives of Endocrinology and Metabolism. 2022; 66(6):848-855.
CrossRef - Parcha V, Heindl B, Kalra R, Li P, Gower B, Arora G, Arora P. Insulin resistance and cardiometabolic risk profile among nondiabetic American young adults: insights from NHANES. Journal of Clinical Endocrinology Metabolism. 2022;107(1):e25-e37.
CrossRef - Fahed M, Abou Jaoudeh M.G, Merhi S, et al. Evaluation of risk factors for insulin resistance: a cross sectional study among employees at a private university in Lebanon. BMC Endocrine Disorders. 2020;20:85 https://doi.org/10.1186/s12902-020-00558-9
CrossRef - Elrayess MA, Rizk NM, Fadel AS, Kerkadi A. Prevalence and predictors of insulin resistance in non-obese healthy young females in Qatar. International Journal of Environmental Research and Public Health. 2020;17(14):5088. https://doi.org/10.3390/ijerph17145088
CrossRef - Bahijri SM, Alissa EM, Akbar DH, Ghabrah TM. Estimation of insulin resistance in nondiabetic normotensive Saudi adults by QUICKI, HOMA-IR, and modified QUICKI: A comparative study. Annal of Saudi Medicine. 2010;30(4):257-264.
CrossRef - Tan C, Sasagawa Y, Kamo KI, et al. Evaluation of the Japanese metabolic syndrome risk score (JAMRISC): a newly developed questionnaire used as a screening tool for diagnosing metabolic syndrome and insulin resistance in Japan. Environmental Health and Preventive Medicine. 2016;21:470-479.
CrossRef - Glumer C, Carstensen B, Sandbæk A, et al. Danish diabetes risk score for targeted screening. Diabetes Care. 2004;27(3):727-733. https://doi.org/10.2337/diacare.27.3.727
CrossRef - Gray LJ, Taub NA, Khunti K, et al. The Leicester Risk Assessment score for detecting undiagnosed Type 2 diabetes and impaired glucose regulation for use in a multiethnic UK setting. Diabetic Medicine. 2010;27(8):853-969.
CrossRef - Diabetes UK. Know Your Risk – Professionals | Diabetes UK. The UK. The Diabetes UK organization. Available at: https://www.diabetes. org.uk/ professionals/diabetes-risk-score-assessment-tool. Accessed May 14, 2020.
- Lindstrom J and Tuomilehto J. The Diabetes Risk Score: A practical tool to predict type 2 diabetes risk. Diabetes Care. 2002;26(3):725-731.
CrossRef - Global Media Insight. The United Arab of Emirates. Saudi Arabia Social Media Statistics 2022.[Updated 11.7, 2022]. Available at: https://www. globalmediainsight.com/blog/saudi-arabia-social-media-statistics/. Accessed May 8, 2023.
- General Authority for Statistics (stats.gov.sa). Saudi Arabia. Population in the Makkah region by gender, age group, and nationality (Saudi/Non-Saudi). Available at: https://www.stats.gov.sa/en/5723. Accessed August 24, 2022.
- Schwarz PE, Li J, Reimann M, et al. The Finnish diabetes risk score is associated with insulin resistance and progression towards type 2 diabetes. The Journal of Clinical Endocrinology & Metabolism. 2009;94:920-926.
CrossRef - Al Dawish MA, RobertAA, Braham R, et al. Diabetes mellitus in Saudi Arabia: a review of the recent literature. Current Diabetes Review. 2016;12(4):359-368.
CrossRef - Al-Rubeaan K, Bawazeer N, Al Farsi Y, et al. Prevalence of metabolic syndrome in Saudi Arabia – a cross sectional study. BMC Endocrine Disorders. 2018;18(1):1-9.
CrossRef - Alowfi A, Binladen S, Irqsous S, Khashoggi A, Khan MA, Calacattawi R. Metabolic syndrome: prevalence and risk factors among adolescent female intermediate and secondary students in Saudi Arabia. International Journal of Environmental Research and Public Health. 2021;18(4):21-24.
CrossRef - Al-Zahrani J, Aldiab A, Aldossari K, et al. Prevalence of prediabetes, diabetes and its predictors among females in Alkharj, Saudi Arabia: a cross-sectional study. Annals of Global Health 2019;85(1):1-8.
CrossRef - Abbas M, Mall R, Errafii K, et al. A simple risk score to screen for prediabetes: a cross-sectional study from the Qatar Biobank cohort. Journal Diabetes Investigation. 2021;12: 988–997.
CrossRef - Bahijri S, Jambi H, Al Raddadi R, Ferns G, Tuomilehto J. The prevalence of diabetes and prediabetes in the adult population of Jeddah, Saudi Arabia – a community-based survey. PloS One. 2016;11(4): e0152559.
CrossRef - Afifi RM, Saad AE, Al Shehri A. Prevalence and correlates of prediabetes and diabetes results I: a screening plan in a selected military community in Central Saudi Arabia. Journal Diabetes Mellitus. 2017;7:12-30.
CrossRef - Xie Z, Nikolayeva O, and Luo J, Li D. Building risk prediction models for type 2 diabetes using machine learning techniques. Preventing Chronic Disease. 2019;16:190109.
CrossRef - Al-Nuaim AR, Al-Rubeaan K, Al-Mazrou Y, Al-Attas O, al-Daghari N, Khoja T. High prevalence of overweight and obesity in Saudi Arabia. International journal of obesity 1996;20(6):547-552.
- Moradi-Lakeh M, El Bcheraoui C, Afshin A, et al. Diet in Saudi Arabia: findings from a nationally representative survey. Public Health Nutrition. 2017;20(6):1075-1081
CrossRef - Mumena WA, Ateek AA, Alamri RK, et al. Fast-food consumption, dietary quality, and dietary intake of adolescents in Saudi Arabia. International Journal of Environmental Research and Public Health. 2022;19(22):15083. https://doi.org/10.3390/ijerph192215083
CrossRef - Almubark RA, Althumairi NA, Alhamdan AA, et al. Socioeconomic and behavioral disparities among diabetics in Saudi Arabia: a nation-wide descriptive study. Diabetes, Metabolic Syndrome, and Obesity. 2022;15:2693-2703.
CrossRef - Sacerdote C, Ricceri F, Rolandsson O, et al. Lower educational level is a predictor of incident type 2 diabetes in European countries: The EPIC Interact study. International Journal of Epidemiology. 2012;41(4):1162-1173.
CrossRef
Accepted on: 23 Aug 2023
Second Review by: Mohamed Nader
Final Approval by: Dr Jiwan S. Sidhu


Web of Science Coverage
Emerging Sources Citation Index (ESCI)
2024 Journal Impact Factor: 1.1
Scopus Journal Metrics
CiteScore 2025: 2.6
CiteScore Details
Sustainable Nutrition: Food Systems, Nutrient Retention, and Public Health Impact
![]()
This journal is a member of, and subscribes to the principles of, the Committee on Publication Ethics (COPE)


