Phytochemicals and Sensory Quality of Cascara Kombucha Made From Coffee By-Products
 , , , 4, , 4, , 4 and Irfan1
 1Department of Agricultural Product Technology, Faculty of Agriculture, Universitas Syiah Kuala, Jl. Krueng Hasan Kalee 3, Darussalam, Banda Aceh, Indonesia.
2Departement of Biology, Universitas Syiah Kuala, Jl. Krueng Hasan Kalee, Darussalam, Banda Aceh, Indonesia.
3Center for Coffee and Cacao Research, Gedung G Faculty of Agriculture Universitas Syiah Kuala, Jl. Krueng Hasan Kalee 3, Darussalam, Banda Aceh, Indonesia.
4Halal Research Centre, Gedung Lab Terpadu Lt. 2 Universitas Syiah Kuala, Jl. Syech Abdurrauf, Darussalam, Banda Aceh, Indonesia.
Corresponding Author E-mail: murnamuzaifa@usk.ac.id
DOI : http://dx.doi.org/10.12944/CRNFSJ.11.2.12
Download this article as:
![]()
Pulp and husk are the two largest types of coffee by-products in coffee processing. This research aims to study the effect of coffee by-product type (pulp and husk) and sugar concentration (10, 15, and 20%) on cascara kombucha's chemical and sensory quality. The parameters analyzed were pH value, total phenolic content (TPC), total tannin, antioxidant activity, and sensory (hedonic and descriptive). The results showed that the type of coffee by-products and sugar concentration affected the quality of cascara kombucha. The pH values obtained ranged from 2.81-2.98, TPC 63.69 mg GAE/L-80.60 mg GAE/L, tannin 0.46%-0.89%, antioxidant activity 0.46%-0.89%, and total alcohol 0.19%-0.46%. The pH and tannin values of cascara kombucha tended to decrease and TPC increased with increasing concentration of sugar added using both pulp and husk. Antioxidant activity was higher in cascara kombucha using husk and increased with increasing sugar concentration. The higher alcohol content was obtained in cascara kombucha using pulp at higher sugar concentrations. The level of liking for cascara kombucha's color, aroma, and taste varied from dislike to like, with a description of color from weak to strong brown color. The description of cascara kombucha's aroma and sour taste was consistent, tending to be stronger at higher sugar additions using both pulp and husk. The sweet taste of cascara kombucha is obtained stronger in cascara kombucha using husk with higher sugar concentrations. Overall, the use of husk with higher sugar concentration resulted in a better quality cascara kombucha. The implication of this study encourages the utilization of husk more widely in addition to the pulp which has been more widely studied in wet coffee processing.
KEYWORDS:Cascara Kombucha; Coffee By-Products; Husk; Pulp; Sugar Concentration
Introduction
Coffee is one of the most popular drinks in the world. This drink is preferred mainly because of its delicious taste, besides being able to have a positive influence on one’s emotions (increasing one’s comfort, activity, productivity, and satisfaction).1,2 For Indonesia, coffee is a leading commodity that plays an important role in the country’s economy, including employment, foreign exchange, and encouraging regional and agro-industrial development. Indonesia is currently the 4th largest coffee producer in the world after Brazil, Vietnam, and Colombia.3
On the world market, coffee is traded in the form of green beans. Thus, a green bean as the main product is obtained through several process stages by producing a number of wastes as by-products, which can be either pulp, mucilage, husk, or parchment, depending on how the processing is carried out.4,5
Coffee processing in principle consists of two methods, dry processing and wet processing which will produce several types of by-products. Pulp and husk are the largest by-products in coffee processing. Dry coffee processing produces 45% husk while wet coffee processing produces 39% pulp. It is known that the pulp and husk still contain a number of important chemical compounds and can be processed into a special brew-like tea called cascara tea.4,5,6
Heeger et al.,7 stated that cascara is rich in polyphenolic compounds. Chlorogenic acid, gallic acid, protocatechuic acid, and rutin were detected in cascara as a result of the research, which has the potential to be functional drinks. A number of studies have been carried out on cascara, both in the production and brewing process with the aim of expanding its utilization. 8,9,10,11 However, its use as a drink is still less popular, including in Indonesia. Only a few countries have known and used this drink for a long time, such as Ethiopia, Yemen, Bolivia, and El Salvador.4
To increase the use of cascara, it is necessary to diversify cascara-based products. One of the cascara-derived products that have been developed is cascara kombucha which was studied by Muzaifa et al.12 Cascara kombucha was produced from coffee pulp using a different fermentation time and kombucha starter concentration. The best cascara kombucha was obtained on 12 days of fermentation and a 5 % kombucha starter. Kombucha is an acidic beverage produced by fermenting sweet tea with symbiotic cultures of bacteria and yeast (SCOBY).31 Studies on the utilization of different coffee by-products in kombucha production are rarely explored. The use of different types of by-products is thought to affect the characteristics of the kombucha produced.
The use of cascara as a kombucha fermentation medium is based on the many other media (herbs, vegetables, and fruit) that are used besides tea as raw materials for kombuchas, such as peppermint, ginger, lemon balm, oak, nettle leaf, spinach, grape juice, cherry juice, banana peel, and pomegranate juice13. Another factor that is thought to affect the quality of kombucha is the sugar content. Sugar is known as a source of SCOBY nutrients which play a role in kombucha fermentation.14,15,16 The sugar required for each type of kombucha tea raw material is thought to be different. This research aims to study the effect of using different coffee by-products (pulp and husk) and sugar concentrations on the chemical and sensory quality of cascara kombucha.
Materials and Methods
Raw materials preparation
Cascara from two types of coffee skins (pulp and husk) as raw materials in cascara kombucha (Figure 1) was obtained from a coffee producer in Aceh Tengah District. Cascara pulp is obtained from the processing of freshly harvested coffee cherries. Coffee cherries are separated from the seeds and skin of the fruit by pulping, the pulp of the fruit which has been separated is then collected and dried in the sun for 5 days. This dry pulp is called cascara pulp. Cascara husk is obtained from pulped coffee beans which are dried in the sun to a moisture content of around 15%. The dried coffee cherries are separated from the skin by hulling, the separated coffee skin is called cascara husk. These two types of cascara are then stored in sealed containers that have been coded and are ready to be used as raw materials in making kombucha cascara.
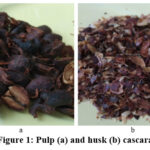 |
Figure 1: Pulp (a) and husk (b) cascara |
Cascara brewing
Cascara brew is made by brewing 250 g of each cascara type (pulp and husk) in 5000 ml of hot mineral water ( ± 95oC) for 8 minutes. Furthermore, the cascara brew is stirred and filtered, and the filtrate (cascara tea) is taken as much as 500 ml each and put into a sterile glass jar that has been coded. The filtrate was added with white crystal sugar (Gulaku) according to the treatment, namely 10%, 15%, and 20% (w/v), and stirred until all the sugar dissolved. The sweet cascara tea is then left for about 20 minutes to cool down.
Cascara Kombucha production
The procedure for making kombucha cascara tea refers to Muzaifa et al12 with slight modifications. Cascara tea that has been sugared and cooled is added to a kombucha starter (SCOBY) as much as 10% (v/v), covered with a sterile cloth, and fermented for 12 days at room temperature.
Product Analysis
Analysis was carried out on cascara kombucha products, including chemical and sensory analysis. The chemical analysis performed was the analysis of pH value, total phenolic content (TPC), antioxidant activity, and alcohol content. The pH value was analyzed with a pH meter referring to AOAC.17 TPC of kombucha was analyzed using Folin-Ciocalteu method. Pipetted 0.2 ml of kombucha sample, added 15.8 ml of distilled water and 1 ml of Folin-Ciocalteu reagent, vortexed until homogeneous and allowed to stand for 8 minutes. Then 3 ml of Na2CO3 was added and vortexed again until homogeneous and allowed to stand at room temperature for 2 hours. Absorbance was measured at a maximum absorption wavelength of 765 nm.18
Tannin content was analyzed by the spectrophotometric method.19 1 ml of kombucha sample was added to 0.3 ml of 0.1 M FeCL3 and then shaken. Then 0.3 ml of 0.008 M K3Fe(CN)6 was added, shaken and allowed to stand for 10 minutes. The absorbance value was measured using a UV-Vis spectrophotometer at a wavelength of 720 nm. Antioxidant activity was determined by the DPPH (1.1-diphenyl-2-pycrylhidrazil) method. 0.1 ml of kombucha sample was added to 5 ml of methanol p.a and vortexed. Then 4 ml of the solution was taken and 1 ml of DPPH was added, vortexed and incubated in a dark room for 30 minutes. The absorbance was measured at a wavelength of 517 nm.20 The alcohol content was determined by the dichromate method.21 As much as 1 ml of 1 N K2Cr2O7, 1 ml of concentrated H2SO4 and 1 ml of 0.1 N K2SO4 were filled into the Conway cup and as much as 2 ml of the sample was filled into the middle of the cup. Then the cup was closed and slightly shaken gently until the sample was mixed in the solution and continued with the curing process for 2 hours in a room without light. If the curing results form a green color, it is certain that there is ethanol in the sample. A total of 1 ml of the resulting solution was taken and dissolved with 25 ml of distilled water. Then the absorbance was measured at a wavelength of 460 nm using a UV-Vis spectrophotometer.
Sensory analysis was carried out using hedonic and descriptive tests. A total of 25 semi-trained panelists rated their level of preference for color, aroma and taste on a likert scale of 1-4 (dislike very much – like very much). In the description test, the panelists gave an assessment of color, sour aroma, sour taste and sweet taste with a scale of 1-5 (very weak-very strong).19
Data Analysis
The research data obtained were analyzed using SPSS software with the analysis of variance (ANOVA) method. Treatments that had an effect were tested further with the Duncan Multiple Range Test (DMRT) at 5% level of probability.
Results and Discussion
pH of Cascara Kombucha
The pH values obtained in this study ranged from 2.81 to 2.98 with an average of 2.91. This value is much lower than the raw material (cascara brew). The cascara pH analysis results of several coffee varieties ranged from 5.09–5.3.22 This result indicates that there has been a process of biochemically degrading the substrate in the cascara brew to produce a more acidic compound, which is characteristic of kombucha. The effect of using the type of cascara and sugar concentration on the pH of cascara kombucha can be seen in Figure 2.
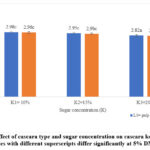 |
Figure 2: Effect of cascara type and sugar concentration on cascara kombucha pH (values with different superscripts differ significantly at 5% DMRT). |
Figure 2 shows that the type of coffee by-products and the concentration of sugar added affect the cascara kombucha produced. The lowest pH value was obtained from kombucha processing using pulp and husk with 20% sugar concentration (L1K3 and L2K3), namely 2.81 and 2,82, which was different from the other treatments (L1K1, L1K2, L2K1,L2K2). The pH value of cascara kombucha tends to decrease with increasing concentration of sugar added, both in husk and pulp. This result is thought to be related to the increasing number of organic acid metabolites produced during fermentation due to increased SCOBY activity. Bacteria and yeasts found in SCOBY cooperate and compete like a cascade reaction that produces various chemical components as metabolites including acetic acid, gluconic acid, glucuronic acid, and ethanol.23 Sugar is the main substrate used by SCOBY to produce alcohol and organic acids. The more sugar added, the more substrate is used by SCOBY to produce metabolites in the form of alcohol and organic acids.15,16,24,25 The alcohol produced by the yeast will also be broken down again by acetic acid bacteria into acetic acid and other organic acids,14,16 so it is very obvious to cause a decrease in pH.
The decrease in pH with increasing sugar concentration is also in line with the research of Sinamo et al 26 where secang (Caesalpinia sappan L.) kombucha fermented for 7 days with higher sugar addition resulted in a lower pH of below 3. The pH value of kombucha produced in this study is still within the kombucha standard set by The Centre of Disease Control of British Columbia (BCCDC), Canada (document with recommendations for the commercial kombucha-making process) which is 2.5-4.2.16 Selvaraj and Gurumurthy 27 mentioned that organic acids found in kombucha include acetic acid, gluconic acid, glucuronic acid, citric acid, L-lactic acid, malic acid, tartaric acid, malonic acid, oxalic acid, succinic acid, pyruvic acid, and saccharic acid.
Total phenolic content (TPC)
Polyphenols are bioactive substances that contain more than one phenol structure per molecule. Polyphenols represent the largest group of phytochemicals found in various plant parts (roots, stems, leaves, fruits, and seeds), acting as secondary metabolites derived from phenylalanine and tyrosine. The structure of phenolic compounds contains hydroxyl groups that can capture free radicals.25,28,29,30,31 The TPC obtained from this study ranged from 63.69 mg GAE/L-80.60 mg GAE/L with an average of 72.29 mg GAE/L. The effect of using cascara type and sugar concentration on the TPC of cascara kombucha can be seen in Figure 3.
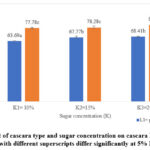 |
Figure 3: Effect of cascara type and sugar concentration on cascara kombucha TPC (values with different superscripts differ significantly at 5% DMRT). |
The highest TPC was obtained in cascara kombucha using husk with 20% sugar concentration (L2K3) reaching 80.94 mgGAE/L which was different from the other treatments. However, there is a tendency that cascara kombucha using husk (L2K3, L2K2, and L2K1) has a higher TPC than using pulp at all levels of sugar concentrations. It is suspected that husk has higher phenolic compounds. This result is reinforced by data on the content of several phenolic compounds (chlorogenic acid and tannin) in pulp and husk studied by Oliviera et al.5 Husk contains 12.59% chlorogenic acid and 4.5-9.3% tannin, while pulp contains 10.7% chlorogenic acid and 1.5-8.6% tannin.
Apart from the raw material itself, phenolic content can also be generated during the fermentation process. TPC was observed to increase with increasing concentration of sugar added in both pulp and husk kombucha. This outcome is thought to be related to the increased activity of SCOBY in producing free phenolic compounds during fermentation. According to Sun et al.32 and Zubaidah et al.33, the increase in TPC can be derived from polyphenolic compounds and the activity of microorganisms in kombucha that release enzymes (such as invertase, cellulase, and amylase) that can break down the complex bonds of phenolic compounds and other compounds during fermentation into small molecules (into free phenolic compounds). This result is in line with Bhattacharya et al.34 who mentioned that the increase in TPC in black tea kombucha fermentation is the result of degradation of complex compounds into simpler compounds, in this case, free phenolic compounds. Consequently, the content of phenolic compounds in kombucha will increase. Another component that decomposes and can increase phenolic compounds is the content of tannin compounds.28,35
Tannin content
Tannin is one of the secondary metabolite compounds found in abundance in plants. The tannin content obtained from this study ranged from 0.46%-0.89% with an average of 0.66%. The effect of using cascara type and sugar concentration on the tannin content of cascara kombucha can be seen in Figure 4.
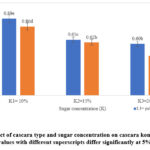 |
Figure 4: Effect of cascara type and sugar concentration on cascara kombucha tannin content (values with different superscripts differ significantly at 5% DMRT). |
Based on Figure 4, it can be stated that the tannin content in cascara kombucha pulp and husk decreased with increasing sugar concentration. The lowest tannin content was obtained in the L2K3 treatment, which was 0.46%. The lower tannin levels are strongly suspected to be related to the increased activity of microorganisms in SCOBY that can break down tannin into simpler molecules. Myo et al 28 mentioned that there was a decrease in tannin in the coffee pulp after fermentation. The same thing was obtained by Shang et al.35 which showed that fermentation of Xuan-Mugua (Chaenomeles speciosa) fruit by microorganisms significantly reduced tannin content due to the breakdown of most tannin compounds into smaller structures, such as catechins, gallic acid, and others. A possible mechanism is the breakdown of ester bonds of tannin compounds by tanasse enzymes produced by microorganisms that contribute to the decrease in tannin. Catechins and gallic acid are both phenolic compounds that are known as natural sources of antioxidants.
Figure 4 also shows that kombucha cascara using pulp tends to have higher tannin, presumably because the pulp has greater tannin than the husk. Although there was no initial analysis of tannin in both raw materials, this opinion is supported by the results of Bhoite and Murthy 36 which showed that coffee pulp contains 8-10% tannin, while husk is only 5%.37 The low amount of tannin analyzed in cascara kombucha proves that the compound has been decomposed due to fermentation by the action of microorganisms (SCOBY) as previously described.
Antioxidant Activity
The antioxidant activity obtained from this study ranged from 65.19%-80.11% with an average of 69.18%. The effect of using cascara type and sugar concentration on the antioxidant activity of cascara kombucha can be seen in Figure 5.
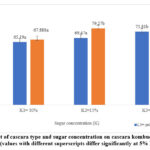 |
Figure 5: Effect of cascara type and sugar concentration on cascara kombucha antioxidant activity (values with different superscripts differ significantly at 5% DMRT). |
Figure 5 illustrates the higher antioxidant activity of cascara kombucha obtained in treatment L2K3 reaching 80.11% which is not different from L2K3 and L1K3 (79.27 and 75.81%). The results of the antioxidant analysis in this study correlated positively with the results of the TPC analysis. This result indicates that phenolic compounds contribute to the antioxidant activity of cascara kombucha. Various phenolic compounds found in several parts of plants exhibit dominant antioxidant activity.28,29,30,31
In connection with tannin, there is a negative correlation, the antioxidant activity of cascara increases with decreasing tannin levels. It is suspected that the decomposition of tannin into simple molecules contributes to the increase in phenolic compounds in cascara kombucha. This finding is supported by Adebo and Medina-Meza (2020),38 antioxidant activity increases during fermentation because the structure of phenolic compounds is broken down by microorganisms, and the resulting free compounds act as antioxidants.
Total Alcohol
The kombucha starter (SCOBY) mainly consists of acetic acid bacteria, osmophilic yeasts, and a small number of lactic acid bacteria. The involvement of yeast contributes to the alcohol content of kombucha, which is one of the factors that must be considered in the regulation of kombucha beverages.39 The alcohol content obtained in this study ranged from 0.19% – 0.46% with an average of 0.29%. The effect of using cascara type and sugar concentration on the value of alcohol content can be seen in Figure 6.
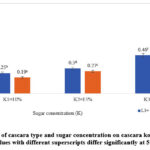 |
Figure 6: Effect of cascara type and sugar concentration on cascara kombucha alcohol content (values with different superscripts differ significantly at 5% DMRT). |
The highest alcohol content of cascara kombucha, 0.46%, was obtained in the treatment of making kombucha using pulp and 20% sugar concentration (L1K3), followed by K2L2 0.32% and L1K2 0.30%. The graph of alcohol value tends to be higher in kombucha cascara using pulp and increases with increasing sugar concentration. It is suspected that there are differences in nutrients in pulp and husk as a food source for bacteria and yeast in the fermentation process, thus affecting the amount of alcohol produced. The carbohydrate content in the pulp ranges from 44-50% and 57.8% in husk.5 However, it is suspected that pulp contains higher simple carbohydrates than husk. In fermentation, microorganisms find it easier to utilize simple carbohydrates than complex carbohydrates as an energy source. Thus the pulp has a higher substrate for SCOBY activity so that the alcohol produced is higher. The concentration of sugar added also significantly affects the alcohol content obtained because more substrate can be used by yeast to produce ethanol.
The alcohol content obtained in this study is still within the limit set by several regulations, which is below 0.5%. The alcohol content is one of the key measurable parameters that kombucha producers and consumers must consider. Ethanol as a result of yeast activity can still be detected in small amounts, although acetic acid will then consume the alcohol.40 The ethanol level set by the United States Alcohol and Tobacco Tax and Trade Bureau (TTB) for any kombucha sold as a non-alcoholic beverage must be less than 0.5% by volume (ABV). In Indonesia, the MUI fatwa41 also provides similar limits for the alcohol content of fermented beverages.
Sensory Analysis
Sensory analysis was carried out with the hedonic and descriptive tests. The hedonic test is an assessment to determine the level of panelist preference for a product by observing the taste, aroma, color, texture, and shape of food products, beverages, or medicines.42 In this study, the level of panelist preference was carried out only on the color, taste, and aroma of cascara kombucha produced. The hedonic scale used is 1-4, where 1 = very dislike, 2 = dislike, 3 = like, and 4 = very like. The number of panelists used for the hedonic test was 25 semi-trained panelists. The results of the analysis of the level of liking (hedonic) panelists to the color, aroma, and flavor of cascara kombucha can be seen in Table 1.
Table 1: Hedonic Characteristics of Cascara Kombucha*
|
Kombucha# |
Color |
Aroma |
Taste |
|
L1K1 |
3.06±0.04b |
2.89±0.02a |
2.28±0.15a |
|
L1K2 |
3.17±0.11ab |
3.25±0.21b |
3.51±0.57b |
|
L1K3 |
3.65±0.00c |
3.29±0.28b |
3.17±0.28b |
|
L2K1 |
3.00±0.06ab |
2.82±0.02a |
2.46±0.13a |
|
L2K2 |
2.88±0.06a |
2.65±0.00a |
2.20±0.15a |
|
L2K3 |
2.99±0.15ab |
3.13±0.17b |
3.46±0.46b |
* Likert scale: 1=dislike very much; 2= dislike, 3= like, 4= like very much
# L1K1= pulp with 10% sugar; L1K2=pulp with 15% sugar; L1K3=pulp with 20% sugar; L2K1=husk with 10% sugar; L2K2= husk with 15% sugar; L1K3=husk with 20% sugar (values with different superscripts differ significantly at 5% DMRT).
Based on Table 1, the panelists’ level of preference for color, aroma, and taste varied from dislike to like. The most preferred color was cascara kombucha which used pulp with 20% sugar concentration (L1K3). There is a tendency for the color of cascara kombucha with pulp to be preferred allegedly because of its bright color, similar to the original kombucha (kombucha tea). The cascara kombucha that uses husk produces a denser color. The average aroma of cascara kombucha is in the range of likes (2.65-3.29), of all the treatments, none of them had a prominent aroma. The most preferred flavor of cascara kombucha is treatment L1K2 which is not different from L1K3 and L2K3. This level of favorability is thought to be related to the description of the resulting product. The sensory test results in this product description can be seen in the cascara kombucha sensory profile as shown in Figure 7.
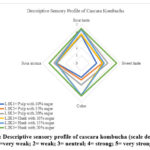 |
Figure 7: Descriptive sensory profile of cascara kombucha (scale description 1=very weak; 2= weak; 3= neutral; 4= strong; 5= very strong). |
Figure 7 shows that the description values of the tested parameters (color, sour aroma, sour taste, and sweet taste) vary on a scale of very weak (2) to strong (4). The color of cascara kombucha visually is brownish with a description scale that tends to be stronger or thicker in the treatment using husk (L2K1, L2K2, and L2K3) than pulp (L1K1, L1K2 and L1K3). This result was obtained because the husk used in this study originated from the natural honey process where the initial brew (before being processed into kombucha) was brownish and more intense than pulp. Cascara pulp steeping is not much different from regular tea steeping. It is known that in the honey-making process, the mucilage attached to the coffee beans is still thick, containing sugars and other components that will ferment naturally along with drying so that the resulting husk is darker color.43
The aroma and sour taste of cascara kombucha were consistent, tending to be stronger in treatments with higher sugar additions using both pulp and husk (K1L3 and K2L3). This outcome is due to more acid formed with higher sugar addition.16,25,26 The sweetness of cascara kombucha also tends to get stronger with increasing sugar content (K1L3 and K2L3). It is presumed that at the same fermentation time as the other treatments, there is still sugar remaining/not yet consumed by SCOBY so this sweetness is still detected strongly. This result is related to recent research conducted by Phetxumphou et al.44 which showed that with higher sugar concentration at the same fermentation time, sweeter kombucha was produced.
Conclusion
Coffee by-products, pulp and husk, have the potential to be used as raw materials in the preparation of cascara kombucha. The type of coffee by-products and sugar concentration affect the quality of cascara kombucha produced. The pH values obtained ranged from 2.81-2.98, TPC 63.69 mg GAE/L-80.60 mg GAE/L, tannin 0.46%-0.89%, antioxidant activity 0.46%-0.89%, and total alcohol 0.19%-0.46%. The pH and tannin values of cascara kombucha tended to decrease and TPC increased with increasing concentration of sugar added using both pulp and husk. Antioxidant activity was higher in cascara kombucha using husk and increased with increasing sugar concentration. The alcohol content was higher in cascara kombucha using pulp at higher sugar concentrations. The alcohol produced has met the requirements which are below 0.5%. The level of liking for the color, aroma, and taste of cascara kombucha varies from dislike to like, with a description of a weak brown color (2) to (4) strong. The description of the aroma and sour taste of cascara kombucha is consistent, tending to be stronger at higher sugar additions using both pulp and husk. The sweet taste of cascara kombucha was obtained stronger in cascara kombucha using husk with higher sugar concentrations. Overall, the use of husk with 20% sugar concentrations resulted in better quality cascara kombucha. The implication of this study encourages the wider utilization of husk as a raw material for food products other than pulp which has been widely studied and produced in wet coffee processing.
Further research is needed to optimize the liking level of kombucha from coffee by product to be highly preferred (very like). This can be done by adding a variety of fruit which can enhance the color as well as the nutrition and sensation of freshness.
Acknowledgments
The authors would like to thank the Halal Research Center and LPPM Universitas Syiah Kuala. The authors also thank Ilham Ramallah who have assisted in this research.
Conflict of Interest
The authors declare no conflict of interest
Funding Sources
LPPM Universitas Syiah Kuala is funding this research through “Penelitian Penugasan Pusat Riset Kategori B/P3KB”. Research Grant No 391/UN11/SPK/PNBP/2022.
References
- Samoggia A., Del Prete M., Argenti C. Functional needs, emotions, and perceptions of coffee consumers and non-consumers. Sustainability. 2020; 12(14): 5694. https://doi.org/10.3390/su12145694
CrossRef - Bhumiratana N., Wolf M, Chambers IV E., Adhikari K. Coffee drinking and emotions: Are There key sensory drivers for emotions? Beverages. 2019; 5(2): 27. https://doi.org/10.3390/beverages5020027
CrossRef - International Coffee Organisation (ICO). Crop year production by country. 2022. [Accessed Online May 8, 2023]. https://ico.org/prices/po-production.pdf
- Muzaifa M., Rahmi F. Utilization of coffee by-products as profitable foods-a mini review. In: IOP Conference Series: Earth and Environmental Science. Vol 672. IOP Publishing; 2021; 12077.
CrossRef - Oliveira G., Passos C. P., Ferreira P., Coimbra M.A., Gonçalves I. Coffee by-products and their suitability for developing active food packaging materials. Foods. 2021; 10(3): 683. https://doi.org/10.3390/foods10030683
CrossRef - Eckhardt S., Franke H., Schwarz S., Lachenmeier D. W. Risk Assessment of Coffee Cherry (Cascara) Fruit Products for Flour Replacement and Other Alternative Food Uses. Molecules. 2022; 27(23): 8435. https://doi.org/10.3390/molecules27238435
CrossRef - Heeger A., Kosińska-Cagnazzo A., Cantergiani E., Andlauer W. Bioactives of coffee cherry pulp and its utilisation for production of Cascara beverage. Food Chem. 2017; 221: 969-975. doi: 10.1016/j.foodchem.2016.11.067
CrossRef - Muzaifa M., Hasni D., Arpi N., Sulaiman M. I., Limbong M. S. Kajian pengaruh perlakuan pulp dan lama penyeduhan terhadap mutu kimia teh cascara. J Teknol Pertan Andalas. 2019; 23(2): 136-142.
CrossRef - Abduh M. Y., Nofitasari D., Rahmawati A., Eryanti A. Y., Rosmiati M. Effects of Brewing Conditions on Total Phenolic Content, Antioxidant Activity and Sensory Properties of Cascara. Food Chem Adv. Published online 2023; 100183.
CrossRef - Prono W. H., Arpi N., Andini R., Muzaifa M., Gunawan F. Chemical analysis of cascara tea from wine coffee processing with a different fermentation times. In: IOP Conference Series: Earth and Environmental Science. Vol 667. IOP Publishing; 2021; 12104. DOI 10.1088/1755-1315/667/1/012104
CrossRef - Maharani S., Mustikawati I., Nailufhar L., Istiqomah S. The effect of brewing time on pH values, polyphenols content, and antioxidant activities of coffee husk tea (cascara tea). In: Journal of Physics: Conference Series. Vol 1869. IOP Publishing; 2021; 12050. doi:10.1088/1742-6596/1869/1/012050
CrossRef - Muzaifa M., Andini R., Sulaiman M. I., Abubakar Y., Rahmi F. Novel utilization of coffee processing by-products: kombucha cascara originated from ‘Gayo-Arabica.’ In: IOP Conference Series: Earth and Environmental Science. Vol 644. IOP Publishing; 2021; 12048.
CrossRef - Nyhan L. M., Lynch K. M., Sahin A. W., Arendt E. K. Advances in kombucha tea fermentation: A review. Appl Microbiol. 2022; 2(1): 73-103.
CrossRef - Laureys D., Britton S. J., De Clippeleer J. Kombucha tea fermentation: A review. J Am Soc Brew Chem. 2020; 78(3): 165-174. doi: 10.1080/03610470.2020.1734150
CrossRef - Villarreal‐Soto S. A., Beaufort S., Bouajila J., Souchard J., Taillandier P. Understanding kombucha tea fermentation: a review. J Food Sci. 2018; 83(3): 580-588. https://doi.org/10.1111/1750-3841.14068
CrossRef - de Miranda J. F., Ruiz L. F., Silva C. B., Uekane T. M., Silva K. A., Gonzalez A. C. M., Fernandes F. F., Lima A. R. Kombucha: A review of substrates, regulations, composition, and biological properties. J Food Sci. 2022; 87(2): 503-527. https://doi.org/10.1111/1750-3841.16029
CrossRef - Association of Official Analytical Chemist (AOAC). Official Methods Of Analysis. Mc Graw Hills Press; 2019.
- Marjoni M. R., Afrinaldi A., Novita A. D. Kandungan total fenol dan aktivitas antioksidan ekstrak air daun kersen (Muntingia calabura L.). J Kedokt Yars. 2015; 23(3): 187-196.
- Nurzainura. Pengaruh Waktu Fermentasi Dan Konsentrasi Starter Terhadap Kualitas Kombucha Cascara. Universitas Syiah Kuala; 2020.
- Jakubczyk K., Kałduńska J., Kochman J., Janda K. Chemical profile and antioxidant activity of the kombucha beverage derived from white, green, black and red tea. Antioxidants. 2020; 9(5): 447. https://doi.org/10.3390/antiox9050447
CrossRef - Nahak B. R. H., Aliah A. I., Karim S. F. Analisis Kadar Alkohol pada Minuman Beralkohol Tradisional (Arak) dengan Metode Spektrofotometri UV-Vis: Analysis of Alcohol Content in Traditional Alcoholic Beverages with UV-Vis Spectrophotometry Method. J Sains dan Kesehat. 2021; 3(4): 448-454.
CrossRef - Murlida E., Noviasari S., Nilda C., Rohaya S., Rahmi F., Muzaifa M. Chemical characteristics of cascara tea from several varieties of coffee in Aceh Province. In: IOP Conference Series: Earth and Environmental Science. Vol 667. IOP Publishing; 2021; 12078.
CrossRef - May A., Narayanan S., Alcock J., Varsani A., Maley C., Aktipis A. Kombucha: a novel model system for cooperation and conflict in a complex multi-species microbial ecosystem. PeerJ. 2019; 7: e7565. doi: 10.7717/peerj.7565
CrossRef - Martínez-Leal J., Ponce-García N., Escalante-Aburto A. Recent evidence of the beneficial effects associated with glucuronic acid contained in kombucha beverages. Curr Nutr Rep. 2020; 9: 163-170.
CrossRef - Bishop P., Pitts E. R., Budner D., Thompson-Witrick K. A. Kombucha: Biochemical and microbiological impacts on the chemical and flavor profile. Food Chem Adv. 2022; 1(4): 100025.
CrossRef - Sinamo K. N., Ginting S., Pratama S. Effect of sugar concentration and fermentation time on secang kombucha drink. In: IOP Conference Series: Earth and Environmental Science. Vol 977. IOP Publishing; 2022; 12080.
CrossRef - Selvaraj S., Gurumurthy K. An overview of probiotic health booster-kombucha tea. Chinese Herb Med. 2022; 15(1): 27-32. doi: 10.1016/j.chmed.2022.06.010. PMID: 36875441; PMCID: PMC9975612
CrossRef - Myo H., Nantarat N., Khat-Udomkiri N. Changes in bioactive compounds of coffee pulp through fermentation-based biotransformation using Lactobacillus plantarum TISTR 543 and its antioxidant activities. Fermentation. 2021; 7(4): 292. https://doi.org/10.3390/fermentation7040292
CrossRef - Mazahir M., Ahmed A., Ahmad A., Ahmad M. S., Khan M. A., Manzoor M. F. Extraction and determination of bioactive compounds and antioxidant activity of buckwheat seed milling fractions. Food Sci Technol. 2022; 42. http://dx.doi.org/10.1590/fst.81721
CrossRef - Wang C., Li N., Wu L, Wu L., Xia L., Hu Z., Li X., Qu Z., Yang J. Optimization of ultrasound-homogenization combined extraction of phenolics in peony roots and leaves. Food Sci Technol. 2022; 42. http://dx.doi.org/10.1590/fst.1086
CrossRef - Mitrović J., Nikolić N., Karabegović I., Lazić M., Nikolić L., Savić S., Pešić M., Simurina O., Stojanović-krasić M. The effect of thermal processing on the content and antioxidant capacity of free and bound phenolics of cookies enriched by nettle (Urtica dioica L.) seed flour and extract. Food Sci Technol. 2022; 42. http://dx.doi.org/10.1590/fst.62420
CrossRef - Sun T. Y., Li J. S., Chen C. Effects of blending wheatgrass juice on enhancing phenolic compounds and antioxidant activities of traditional kombucha beverage. J food drug Anal. 2015; 23(4): 709-718. doi: 10.1016/j.jfda.2015.01.009
CrossRef - Zubaidah E., Ifadah R. A., Afgani C. A. Changes in chemichal characteristics of kombucha from various cultivars of snake fruit during fermentation. In: IOP Conference Series: Earth and Environmental Science. Vol 230. IOP Publishing; 2019; 12098.
CrossRef - Bhattacharya D., Bhattacharya S., Patra M. M., Chakravorty S., Sarkar S., Chakraborty W., Koley H., Gachhui R. Antibacterial activity of polyphenolic fraction of kombucha against enteric bacterial pathogens. Curr Microbiol. 2016; 73: 885-896. doi: 10.1007/s00284-016-1136-3
CrossRef - Shang Y. F., Cao H., Ma Y. L, Zhang C., Ma F., Wang C., Ni X., Lee W., Wei Z. Effect of lactic acid bacteria fermentation on tannins removal in Xuan Mugua fruits. Food Chem. 2019; 274: 118-122. http://dx.doi.org/10.1016/j.foodchem
CrossRef - Bhoite R. N., Murthy P. S. Biodegradation of coffee pulp tannin by Penicillium verrucosum for production of tannase, statistical optimization and its application. Food Bioprod Process. 2015; 94: 727-735.
CrossRef - Blinová L., Sirotiak M., Bartošová A., Soldán M. Utilization of waste from coffee production. Res Pap Fac Mater Sci Technol Slovak Univ Technol. 2017; 25(40): 91-101.
CrossRef - Adebo O. A., Gabriela Medina-Meza I. Impact of fermentation on the phenolic compounds and antioxidant activity of whole cereal grains: A mini review. Molecules. 2020; 25(4): 927.
CrossRef - Alcohol and Tobacco Tax and Trade Bureau. Kombucha information and resources. https://www.ttb.gov/kombucha/ kombucha-general [Accessed May 7, 2023].
- Tran T., Grandvalet C., Verdier F., Martin A., Alexandre H., Tourdot-Maréchal R. Microbial dynamics between yeasts and acetic acid bacteria in kombucha: impacts on the chemical composition of the beverage. Foods. 2020; 9(7): 963.
CrossRef - Indonesian Ulema Council. Fatwa of the Indonesian Ulema Council Number 10 of 2018 on Food and Beverage Products Containing Alcohol/Ethanol.; 2018.
- Nasiru N. Teknologi Pangan Teori Praktis Dan Aplikasi. Graha Ilmu; 2014.
- Clayton L. What is honey process coffee.2022. Online https://sprudge.com/what-is-honey-processed-coffee-184876.html (accessed, May 10, 2023
- Phetxumphou K., Vick R., Blanc L., Lahne J. Processing condition effects on sensory profiles of kombucha through sensory descriptive analysis. J Am Soc Brew Chem. 2023; 81(1): 99-108. doi:10.1080/03610470.2021.2022879
CrossRef
Accepted on: 8 Aug 2023
Second Review by: Dimas Rahadian Aji Muhammad
Final Approval by: Dr. Angelo Maria Giuffrè


Web of Science Coverage
Emerging Sources Citation Index (ESCI)
2024 Journal Impact Factor: 1.1
Scopus Journal Metrics
CiteScore 2025: 2.6
CiteScore Details
Sustainable Nutrition: Food Systems, Nutrient Retention, and Public Health Impact
![]()
This journal is a member of, and subscribes to the principles of, the Committee on Publication Ethics (COPE)


