Physicochemical and Functional Properties of Banana Starch and Its Alternative Returns
Md. Abdus Satter Miah1*
, Nusrat Abedin1, Md. Nazmul Islam3, Md. Faridul Islam1, , Anik Kumar Saha1, Shahin Aziz2 1Institute of Food Science and Technology (IFST), Bangladesh Council of Scientific and Industrial Research (BCSIR), Dr. Qudrat-I-Khuda Road, Dhanmondi, Dhaka, Bangladesh.
2Institute of Fuel Research and Development ( IFRD), Bangladesh Council of Scientific and Industrial Research (BCSIR), Dr. Qudrat-I-Khuda Road, Dhanmondi, Dhaka, Bangladesh.
3Bangladesh Food Safety Authority, Dhaka. Bangladesh.
Corresponding Author E-mail: mabdussatter@yahoo.com
DOI : http://dx.doi.org/10.12944/CRNFSJ.11.2.34
Download this article as:
![]()
The current study’s goal is to isolate the starch from different varieties of banana i.e. Local Banana (LB) and BARI Banana2 (BB2)and characterize them in order to explore their physical and chemical compositions, amylose content, resistant starch content, functional properties, granule morphology and crystalline pattern. Different techniques were used for characterization viz. X-ray diffractometery (XRD), Fourier Transform Infrared Spectroscopy (FTIR), Scanning Electron Spectroscopy (SEM) etc. The starch extracted from banana showed significant difference in the amylose content and the value was found 28.26%and 25.93%respectively for local banana starch (LBS) and bari banana 2 starch (BB2S). This study also revealed that selected banana varieties can be a potential source for the production of resistant starch. The resistant starch (RS) content of the banana was found 46.93% and 45.78% respectively for LBS and BB2S. Using de-branching and autoclaving technique in the starch, there was a significant increase in RS content. Paste clarity was decreased gradually with time for all the starch samples. Water absorption capacity (WAC) and oil absorption capacity (OAC) of LBS and BB2Swere found in the ranged of 165.8-170.7% and 132.6-168.1% respectively. XRD showed both LB and BB2 starches had B-type crystal pattern. The d-spacing of banana starches were ranged from 3.86-5.88Á. SEM data revealed that banana starches possessed the regular elongated round ridges with smooth surface in the range of 4.3-12.4 µm. The information obtained from this research indicates that both banana starches can be used in different areas; especially in food, pharmaceutical and cosmetics industries as an edible coating, thickening agent, fat replacer, etc. Also, banana starch containing functional food can be recommended for diabetic patients.
KEYWORDS:Functional properties; Physicochemical; Potential uses; SEM; Starch extraction; XRD
Introduction
Banana (“Musa Paradisiaca”) is the world 4th most important agricultural crops and considered as one of the most important energy sources for human.1 In tropical and subtropical regions, they are highly cultivated and popularly consumed. India is the leading country for the production of banana. According to FAO, approximately 119 million MT of bananas were produced worldwide annually in 2020.2 Banana consists primarily of water (75%), carbohydrates (25%), and trace amounts of protein and fat.3 Additionally, it is a major source of micronutrients and has significant amounts of potassium, calcium, phosphorus etc.3Interestingly, starch is being considered the principal ingredient of green banana and an important nutritional component in all human populations and is the storage form of polysaccharides found in green plants i.e cereals, roots and tubers, rhizomes, stems and fruits.4
Amylose and amylopectin are two important high-molecular-weight carbohydrate components, which are largely responsible for the functioning of starch.5 For modifying the consistency and texture of food, this biopolymer is a great raw material. In starch, glucose molecules are covalently linked together in a long chain. Due to its white appearance, absence of odor, ease of digestion, and small particle size, banana starch has gained much more attention nowadays. Due to these qualities, starch has a wide range of uses in both the culinary and non-food industries.6 In the food industry, starch serves as a thickening, a processing aid, a source of suspended particles, and it can also perform specialized activities by changing its structural makeup. 7 Starch type and quantity both play a crucial role on the texture of a particular food product. Extensive studies have shown that starch has physiological functions similar to those of dietary fiber.8 The modern food industry produces a large variety of food products that require starch, which can withstand a wide range of preparation conditions and processing procedures.9 The industrial use of starch is controlled by its functional properties. The origin and variety in granule morphology (size and shape), degree of crystallinity, amylose and amylopectin concentration all affect the functional qualities of native starches.10 To meet these requirements, native starches are modified through enzymatic, chemical, and physical processes.11
The extraction of starch from various banana cultivars has been the subject of numerous investigations and their physicochemical characteristics. The main focus being on the proximate analysis, chemical structure, the swelling power and solubility, amylose content and amylose leaching, the pasting properties and paste clarity, gelatinization, crystallization, morphological, and digestibility.12 Depending on the variety, banana flour’s chemical composition ranged from 3.71 to 4.53% crude protein, 10.32 to 10.72% moisture, 0.12 to 0.16% crude fat, 1.20 to 2.38% ash, 0.68 to 1.19% crude fiber, 81.95 to 83.15% carbohydrate, and 8.00 to 8.54% dietary fiber.13 The banana starches moisture, ash, and protein contents were 11.12%-11.84%, 0.23%-0.47%, and 0.1% respectively, whereas the amylose concentration ranged between 11% and 13%. The average diameter size of the banana starches was between 16.31 and 21.98 µm. The starch’s peak viscosity was ranged 488.42 to 558.66 RVU. At 80°C, significantly rose the water absorption capacity (WAC) and swelling power (SP). The maximum values of solubility (12.52%–14.19%) and SP (12.43–14.27 g water/g starch) were attained at 90°C. The starch clarity follow the same pattern and ranged from 1.7% to 2.3%.14 In an another study, it was found that banana flour has lower amount of gluten compare to mostly used wheat flour, so banana flour can be used for several purposes in food industry like as in producing bread, pasta, cookies etc..15 In 2020, National Institute of Health, Italy, reported that high amylose content in banana starch can fight against obesity and lower the glycemic load. Banana starch contains considerable amount of resistant starch that make it more appealing to researcher to develop food products.16 RS is considered as a functional starch when added to food products since the enzyme from human micoflora cannot degrade it. They reside longer period of time in the small intestine and feed the healthy microbiome living in human gut. As a result RS is considered to have many potential health benefits such as reduced appetite, improved insulin sensitivity, lower the glycemic index and several benefits for digestion.17,18
Though several researches are available where the isolation of starch from banana and their functional properties were investigated, but there is no comparative research has been done so far on the starch extracted from different verities of banana grown in Bangladesh and their potential uses. Considering the importance of banana starch, research in this area aimed to accomplish the following:(i) isolate the starch from two banana varieties; (ii) to characterize the extracted starches to know their physicochemical, microstructural and functional properties; (iii) to build up a comparative relationship between the banana starches and finally (iv) to find out the possible field for potential application of the extracted starches.
Materials and Methods
Sample collection
Locally cultivated green banana samples were collected on random basis from seven different areas of Bangladesh. The Bangladesh Agricultural Research Institute (BARI), Joydebpur, Gazipur, Dhaka, Bangladesh provided the source material for the BARI banana-2.
Physical characteristics analysis of banana
Physical characteristics of banana were determined according to Faquino C Fet.al. (2017).19The following properties were assessed on sixty randomly selected samples after fruits were removed from the comb, leaving a 1.5 cm stalk behind. A digital balance was used to determine the fresh. The length and girth of the fruit were measured. To determine the pulp and peel ratio, the pulp and peel ratio components of fruits that had been hand peeled and steam-peeled were separated and weighted.
Proximate composition analysis
Samples were analyzed for proximate composition (moisture, ash, protein, fat and fiber contents) by Association of Official Analytical Chemist (AOAC, 2005) standard procedures.20The amount of protein was calculated from g/100g N× 6.25. By calculating the difference, carbohydrates were determined, and Atwater conversion factors were used to compute the energy. All measurements were done in triplicate.
Micronutrients analysis
With few modifications, the procedure outlined by AOAC (1990) was emploed for micronutrients analysis. The ash dissolved with 40 mL of 10% HCl and heat over a water bath for 1.0 hour to dehydrate silica. Add more water to dissolve soluble salt and filter into a 100.0 mL volumetric flask using Whatmann No. 1 filter paper. The sodium (Na) and potassium (K) content of the samples were determined by using a flame photometer (Jenway, PEP7, UK).Calcium (Ca), Magnesium (Mg), Iron (Fe), Manganese (Mn), Zinc (Zn) and Copper (Cu) content were determined by atomic absorption spectrometer (VARIAN-220, USA).
Amylose content determination
Zhu et al. (2008) developed method was followed to determine the amylose content.21 0.1 g of sample was treated with 100.0 mL 0.1N alkali to release the amylose from the starch. The presence of amylose produces blue color by the addition of tri-iodide ion. Using a UV-vis spectrophotometer the OD was measured at 600nm. Standard control was used for the determination of amylose content in samples
Determination of blue value
1.0 mL of 95% ethanol was added to 0.1 g of banana starch to disperse the starch. 9.0 mLof 1M sodium hydroxide was added and gelatinized by being heated in a water bath. A volumetric flask of 100.0 mLwas used to quantitatively transfer the mixture, which was then topped off with distilled water. Pipetteing out 5.0 mL of this solution and transfered into a 100.0 mL volumetric flask. 1.0 mL1.0M acetic acid and2.0 mL of stock iodine (0.2 g I2/2 g KI) solution was mixed and then volume made up to mark with distilled water. For color development, the mixture was kept for 20 min. The solution was scanned at 350-950 nm in a UV visible spectrophotometer. The same iodine solution but without sample was used as blank. Amylose from potato was used to prepare standard curve.
Starch extraction
Green banana slices were peeled and soaked in 200.0 mL of 0.2% sodium bisulfite solution at pH 4.5. The mixture was then mixed on low speed for 5 minutes in a waring blender before being left at 40°C for 24 hours. To remove pulp, it passed through a 200 mesh screen which was then rinsed with a touch of distill water. The remaining peel and fiber in the starcy slurry were removed by centrifuging the filtrate at 500 rpm for 5 minutes. The starch was then precipitated by centrifuging the decanted starch slurry at 3000 rpm for 10 minutes. Then the white sediment was dried in anair convection oven at 40°C for 48.0 hours. After drying, ground with a mortar and pestle and passed through 150 and 80 mesh screen. Stored in a zip-lock bag at room temperature for further analysis.
Determination of resistant starch content
The enzymatic method developed by Goni et al. (1997) was employed to determine resistant starch content with some change.22 500 mg of homogenized sample previously sieved through 200 mesh was transferred to a 50 mL falcon tube. 0.2 mL of pepsin solution (1 gm pepsin/10 mL of KCl-HCl buffer, pH 1.5) was added and placed in a water bath for 60 minutes at 40ºC and 120 stokes per minutes. Treated the mixture with1.0 mL of Pancreatic Alpha Amylase solution(40 mg Alpha amylase per mL of tris maleate buffer) and incubated for 16 hours in a 37ºC water bath with continuous shaking. The supernatant was discarded by centrifugation, then 3 mL of 4M KOH and distilled water were added and kept for 30 minutes. After adding 80 µL of amyloglucosidase and 5.5 mL of 2M HCl were added, placed the mixture in a 60ºC shaking water bathfor 45 min. Centrifuged at 3000×g for 15 min and collected the supernatant. The residue was washed again and the supernatant was collected. Using a spectrophotometric technique and glucose oxidase-peroxidase reagent, the glucose concentration was calculated.
RS content (%) = Concentration of glucose from calibration curve × 0.9 × volume correction × 1/1000 × 100/weight of sample
Functional properties analysis
Foaming properties determination
The method described by Narayana and Narasinga (1982) was followed to determine the foam capacity (FC) and foam stability (FS).231.0 g of sample was transferred to a graduated cylinder and diluted with 50 mL of distilled water at 30 ± 2 ºC. Foam was formed after the suspension was shaken for 5 minutes. In order to calculate the foam capacity, the volume of foam at 30 seconds post-whipping was used:
Where, AW = after whipping, BW = before whipping.
Foam stability was calculated as a percentage of the initial foam volume by measuring the volume of the foam one hour after whipping.
Solubility and Swelling Power
Solubility and swelling power were determined according to the method employed by Oladele and Aina, (2007) with few change.241.0 g of sample was transferred to a pre-weighted 50 mL centrifuge tube and stirred after adding 40.0 mL of distilled water.The mixture was heated at 55, 65, 75, 80, 85 and 95ºC while being stirred constantly for 30 minutes. It was centrifuged at 2200 rpm for 15 minutes after being cooled to room temperature. The supernatant was poured into crucible that had been previously weighed, and then heated until it evaporated. Solubility was determined by measuring the amount of solid that remained in the crucible after the liquid had been removed.

The swelling power was calculated by measuring the weight of the paste in the tube and plugging the results into the following equation:

Paste clarity
The samples clarity and stability were evaluated at 4°C after 24, 48 and 72 hours of storage period (Bello-Perez, Roger, Baud and Colonna, 1998).25For the preparation of the sample paste, 0.2 g of sample was suspended in 5.0 mL water in a screw cap test tube and heated in a boiling water bath for 30 minutes. After every 5 minutes, the test tubes were vigorously shook. Using a double beam spectrophotometer (Specord 205, Analytikjena, Germany), % transmittance was measured at 650 nm when contents were reached at room temperature.
Water absorption capacity (WAC)
The WAC of the sample was evaluated by following the method developed by Fontes et al., 2017 with slight modification.26 1.0 g of sample was transferred into a 50 mL centrifuge tube and add 40.0 mL of distilled water followed by shaking for an hour, the resulting slurry was centrifuged at 2200 rpm for 15 minutes. Drained off the supernatant as much as possible with soft tissue paper. The amount of water absorbed was calculated in grams by 100 gm sample was determined.
Oil absorption capacity (OAC)
Following the procedure described by Chagam, K.Retal.(2015), the oil absorption capacity was calculated.2730.0 mL of fortified soybean oil was combined with 1.0 gof the sample, and the mixture was let to stand at RT for 30 minutes. For 10 minutes, the contents were centrifuged at 2000×g. The percentage of oil bound per gramme of sample was used to express the oil absorption capacity.
Bulk Density
Bulk density was calculated following the procedure of Oladele and Aina, 2007 with slight modification.24 A sample weight of 10.0 g was taken in a 50.0 mL graduated cylinder that was filled with gentle and uniform tapping. The sample was weighed after the cylinder was filled to the appropriate level. The formula used to get the bulk density was mass divided by volume, in grammes per mililiter (gmL-1).
ATR-FTIR Spectroscopy
The samples FTIR spectra were acquired at room temperature usingan FTIR equipment (Frontier, PerkinElmer, USA) between the wavenumber of 4000-650 cm-1.
Starch X-ray diffraction analysis
The XRD pattern was established according to Jiang H et al. (2015).28 20g/100 g H2O (wet basis) starch sample was taken after water sorption in desiccators with saturated potassium sulfate solution. An X-ray diffractometer (Smart LAB, SE, Rigaku, Japan) was used to obtain the diffraction diagrams. Data was taken for the 2θ range of 10º to 80º and the generator settings was 30 mA, 40 kV.
Morphological analysis by scanning electron microscopy
Starch samples were prepared for viewing in the SEM. A piece of double-sided scotch tape was affixed to the specimen tubes, and the samples were scattered onto it. The samples were attached to the specimen stubs by a spot of silver dag so that samples of the surface were exposed. All specimens were coated in a vacuum evaporator first with carbon and then with approximately 200 to 250 A of gold. The samples were examined at 10kV in a scanning electron microscope (JSM-7610F, JEOL, USA) after being coated with carbon-gold.
Statistical Analysis
All experiments were triplicated, and statistics are presented as means and standard deviations. SPSS 22.0 statistical software were used for statistical analyses. In addition, Sigma Plot 14.5 software was used to create graph in Figure 1, 2 and 3.
Results and Discussion
Physical characteristics of banana samples
Physical properties of banana varieties were analyzed to know the average length, breadth, weight and pulp/peel ratio. All the investigation was done in triplicate manner and values are used in average ± standard deviation. The obtained data are presented in the following Tab. 1. The length, breadth, weight, L/B and pulp/peel ratio was found 16.98 cm, 5.10 cm, 149.21 g/unit, 3.3 and 1.94 for LB, whereas for BB2 these values were 12.3 cm, 4.02 cm, 93.62 g/unit, 3.5 and 3.1 respectively. The weight difference among different sample is significant. The L/B ratio is almost same for the entire sample and the range is 3.1 to 3.3.
Table 1: Physical Characteristic Data of Banana
|
Test Parameter |
Local Banana (LB) |
BARI Banana 2 (BB2) |
|
Length(cm) |
16.98 ± 2.36 |
5.10 ± 0.87 |
|
Breadth (cm) |
5.10 ± 0.87 |
4.02 ± 1.03 |
|
L/B |
3.3± 0.53 |
3.1± 0.65 |
|
Pulp/Peel |
1.94± 0.36 |
2.12± 0.29 |
|
Weight (g) |
149.21 ± 4.22 |
93.62 ± 3.27 |
Values expressed are mean ± standard deviation of triplicates.
Micronutrient analysis of the raw samples
The micronutrients (Na, K, Mg, Ca, Mn, Fe, Cu and Zn) content of the peeled banana was analyzed. The concentrations of the micronutrients were varied slightly. The copper and manganese content was found almost same for both varieties of banana. The zinc level was found to be between 11.7 and 13.2 mg/kg. The potassium was found higher in the LB than the BB2 but lower than the reported value for ripe banana.29 The second highest concentration was found for calcium. The Ca content in LB and BB2 was found to 176.29 mg/kg and 155.30 mg/kg respectively. For Mg and Na content, there were also observed significant variation between LB andBB2 sample. BB2 has the higher amount of Mg and Na than LB samples. Since, both of the banana varieties have considerable amount of micronutrients, so the green banana can be used as a potential source for the Na, Mg, K, Ca, Mn, Fe, and Cu. All the data are presented in Table 2.
Table 2: Micronutrient Contents of Peeled Banana
|
Test Parameter (mg/kg) |
Local Banana (LB) |
BARI Banana 2 (BB2) |
|
Iron (Fe) |
19.14 ± 3.74 |
16.14±0.09 |
|
Zinc (Zn) |
13.2 ± 4.35 |
11.7±0.06 |
|
Calcium (Ca) |
176.29 ± 0.37 |
155.30 ±0.84 |
|
Magnesium (Mg) |
104.18 ± 0.38 |
144.65 ±0.57 |
|
Manganese (Mn) |
6.86 ± 0.05 |
6.83±0.12 |
|
Copper (Cu) |
8.62 ± 0.09 |
8.22±0.04 |
|
Sodium (Na) |
21.06 ± 0.08 |
28.79 ± 0.26 |
|
Potassium (K) |
315.90 ± 2.17 |
296.91 ± 0.34 |
Values expressed are mean ± standard deviation of triplicates.
Proximate analysis of the raw banana flour and isolated starch samples
The chemical composition data of peeled banana and banana starches collected from different sources is tabulated in Tab. 3. The moisture content of peeled oven dry LB and BB2 powder samples were almost same and ranged between 10.49-10.79% and this is because the temperature and time for drying was same for all the samples. The ash, proteinand crude fiber content value were almost close to all verities and ranged from 2.79-3.04%, 3.62-3.98% and 4.14-5.12% respectively for LB and BB2. But, slightly higher amount of ash, protein and crude fiber was found in BB2 than LB. The starch content between these two samples can be ranked as LB> BB2. The carbohydrate contents of all samples were about 80%, whereas the fat contents were ranged from 1.03-1.56%.
Table 3: Proximate Composition Analysis of Peeled Oven Dry Banana and Banana Starch
|
Test Parameter (g/100 g db) |
LB |
BB2 |
LBS |
BB2S |
|
Moisture |
10.49 ± 0.13 |
10.79 ± 0.54 |
9.21 ± 0.93 |
9.73 ± 0.85 |
|
Ash |
2.79 ± 0.02 |
3.04 ±0.17 |
1.29 ± 0.04 |
1.26 ± 0.02 |
|
Starch |
68.91 ± 0.21 |
65.43 ±0.73 |
88.23 ± 0.53 |
86.30 ± 1.13 |
|
Protein |
3.62 ± 0.03 |
3.98 ± 0.04 |
0.62 ± 0.07 |
0.71 ± 0.03 |
|
Fat |
1.03 ± 0.06 |
1.56 ± 0.08 |
0.76 ± 0.05 |
0.86 ± 0.01 |
|
Carbohydrate |
80.96 ± 1.13 |
78.51 ± 0.95 |
90.32 ± 0.99 |
89.35 ± 1.02 |
|
Crude fiber |
4.14 ± 0.16 |
5.12 ± 0.09 |
1.06 ± 0.03 |
0.98 ± 0.08 |
Values expressed are mean ± standard deviation of triplicates.
From Table 3., LBS and BB2S were found almost same in moisture, ash, starch, protein, fat, carbohydrate and crude fiber contents. The moisture content of the extracted starches ranged between 9.21-9.73%. The ash content was found higher in LBS i.e. 1.29% whereas BB2S has1.26%ash, but all the ash content value of extracted starches was found lower than the raw powdered samples. This is because higher amount of minerals was present in raw banana flour. Also, this starch ash contents reflected the certain level of minerals might be present in the starches. Significant changes were observed between the protein content of extracted starches and raw powdered samples. The low ash and protein value of starches indicated the higher quality of starch and the extraction procedure was effective. The protein values were close to those reported i.e. 0.15% to 0.42%.30 High protein might be affected the starch surface charge and rate of hydration, ultimately interfere the swelling and gelatinization properties of starch. So, protein content in starch directly related to the functional properties of starch. The starch content of LB (88.23%) showed higher to others varieties such as BB2S (86.30%). Considering the starch content, it can be said that the quality of extracted starch is very high. In a previous study, the starch content in banana starch was reported as 90.08%.31 The carbohydrate and fiber contents were found almost same for both banana starches. The fat content was found higher in BB2S (0.86%) and lower in LBS (0.0.76%). Fats can affected the functionality of starch by forming helical structure with amylose and this way can hinder the swelling and decrease the paste clarity.32Due to the extraction method of starch,, cultivation area and botanical varieties, the chemical composition of all the samples were found different.
Blue value, Amylose and resistant starch content
The maxima of starch-iodine absorption spectra was recorded at 600 nm. Blue values were recorded 0.72 and 0.68 respectively for LBS and BB2S. The amylose content of LBS and BB2S varied significantly with the values ranging from 28.26 % to 25.93 % respectively. Compared with the reported data, this investigation got the more amylose content in the studied samples. A research groups have found amylose content of banana starches in the range of 12% to 13%.33 Amylose impacts the functional qualities of starch, so the amylose level of a starch is a crucial factor. High amylose percentage can plays important role as a prebiotic, strengthen immunity, lower heart ailments, improve oral and neurological health’s.34 The application of starch in food, cosmetics, pharmaceutical and other industry depends on the amylose content of starch. High amylose containing starch has huge demand in industry as a gelling agent. But, the variation in amylose content can result from differences in source, harvesting season, growing environment and maturity of the analyte samples. Resistant starch content was found 46.93% and 45.78% respectively for LBS and BB2S. According to T.B. Tribess et al., resistant starch content of green banana flour was varied from 40.9% to 58.5% depending on the drying conditions.35 In another study, the resistant starch contents of the fruit seed and mung bean starches were reported in the range of 2.90% to 29.83%.36Resistant starch is crucial for supporting a healthy microbiome. Its feed the friendly bacteria reside in human gut. As a result, the good bacteria increase which lead to decreased levels of constipation, lower cholesterol levels and reduced the chance of gas pains.37 So, high resistant starch containing food is good for diet chart.
Table 4: Blue Value, Amylose and RS Composition Data of Banana starches
|
Test Parameter |
Blue value |
Amylose (%) |
RS (%) |
|
LBS |
0.72 ± 0.045 |
28.26 ± 1.13 |
46.93 ± 0.85 |
|
BB2S |
0.68 ± 0.036 |
25.93 ± 1.07 |
45.78 ± 0.11 |
Values expressed are mean ± standard deviation of triplicates
Water and oil absorption capacity, foaming capacity, foaming stability and bulk density
WAC and OAC of the starch molecules represents the ability to associate with limited oil and water addition.38 High water absorption capacity indicates the presence of highest amylose content. When amylose content is higher, water uptake will be higher; results will be loose compaction of amylose and amylopectin. In that case, due to intensive association of hydroxyl groups in between the starch chains, strong covalent and hydrogen bonds formation occur.39 Oil absorption capacity measures the emulsifying potentials of the starch. Low OAC indicates the presence of low level of protein in the starches. The OAC and WAC of starch are also dependent on the source of amylose/amylopectin content and extraction procedure. Between two starch samples, LBS showed 170.66 % whereas BB2S showed 165.84% WAC. The OAC was found 132.63% and 168.12% respectively for LBS and BB2S. In culinary products like bread goods, where hydration is necessary to enhance the features of dough handling, starch with a high water absorption capacity is crucial. The absorption of oil enhances oral taste and retention because it provides food a soft texture and flavor.40 A starch with the appropriate oil absorption ability will also be needed for products like mayonnaise and dough for frying.41
Table 5: Water and Oil Absorption Capacity, Foaming Capacity, Foaming Stability and Bulk Density of LBS and BB2S
|
Test Parameter |
LBS |
BB2S |
|
WAC (%) |
170.66 ± 0.82 |
165.84 ± 0.56 |
|
OAC (%) |
132.63 ± 1.81 |
168.12 ± 4.28 |
|
FC (%) |
4.20 ± 0.42 |
4.06 ± 0.73 |
|
FS (%) |
2.01 ± 0.32 |
3.27 ± 0.22 |
|
BD (g/mL) |
0.91 ± 0.16 |
0.86 ± 0.21 |
Values expressed are mean ± standard deviation of triplicates; LBS = local banana starch, BB2S = BARI banana 2 starch, WAC = water absorption capacity, OAC = oil absorption capacity, FC = foaming capacity, FS = foaming stability, BD = bulk density
The foaming capacity of the starches was ranged from 4.06% to 4.20% whereas foaming stability were found 2.01% and 3.27% respectively for LBS and BB2S. FC depends on the amount of protein content present in the starch and the configuration of the protein molecules. The ductile protein structurelessening the surface tension of the water molecule as a result increases the foaming capacity. The FC of banana starch was reported 4.28% to 10.85% for three different verities.40 There was no significant difference among the bulk density value of starches. LB starch bulk density was slightly higher than the bulk density of BB2 starch. Since particle size and bulk density are inversely proportional, so when particle size will increase, bulk density will decrease. For industrial application, bulk density should be low.
Solubility (S) and swelling capacity (SC)
The majority of starchy food products have significant qualities that are influenced by swelling ability.The swelling power reveals the starch granules’ ability to absorb water at high temperatures. Solubility and swelling ability can be influenced by several factors like starch particle size, amylose and amylopectin content and their ratio. Starch crystalline/amorphous property and their compositions (amylose/amylopectin) molecular structure also affect their S and SC.
The swelling power is typically low for starch granules with high amylose content, higher crystalline areas and strong covalent interactions in the crystalline regions. Primarily swelling is a property of amylopectin. The solubility and swelling power of banana starches were determined at 55℃, 65℃, 75℃, 80℃, 85℃ and 95℃. In this study, it was found that as the temperature rose, so did the SP and solubility. But, the behavior of the change was not same. In case of solubility, there were no significant change upto 65℃ for all starch samples, but the sudden changed (sharp increased) occurred in between 65℃-85℃. The solubility of the banana starches was found similar characteristics with the increase of temperature.
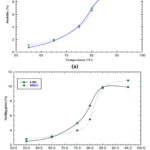 |
Figure 1: (a)Solubility and (b)swelling power of banana starches in function of the temperature |
The swelling behavior of banana starches showed two-fold characteristics. BB2S started swelling at relatively higher temperature than the LBS. Their swelling capacity swiftly increased from 65℃ to 85℃ and then gradually climbed till it reached 95℃. The swelling behavior data followed the same trends as reported by Hasmadi M. group.42 High swelling power is a crucial prerequisite for high-quality starch.
Paste clarity
The samples paste clarity was determined after every 24 hours storage in refrigerator at 40C and observation continued for three days. All the samples paste clarity data followed the same trend i.e. the clarity of the solution were decreased with time. The transmittance value of the starches was ranged from 3.39% to 6.27%. Paste clarity data of banana starches are illustrated in Fig. 2. After one day’s observation, BB2S exhibitedhigher paste clarity than LBS. It is shown that, after 48 hours, maximum decreased (32.4%) was observed for LBS. Results also revealed that at the same concentration; LBS were less translucent than the BB2S. Degree of transmittance value can be affected by the degree of water absorption capacity, sucrose and lipid content. With the increase of water absorption, the paste clarity will increase.43 Paste clarity also varies with the difference in methods and concentrations. Since paste clarity contribute to the cloudiness and polish to product color, banana starches can have the potential application for food products that requires low transparency especially for sauces, puddings, seasonings and salads dressings.
 |
Figure 2: Paste clarity profile of banana starches |
ATR-FTIR analysis
The FTIR spectra were recorded in the range between 4000-650 cm-1 and shown in the Fig.3. The hydrogen bonded O-H stretching vibrational broad absorption band was found ranging from 3293.01-3294.61 cm-1 whereas sharp C-H stretching vibrational band associated with the hydrogen atoms of ring methane appeared at 2929.93 cm-1 and 2927.35 cm-1 for the LBS and BB2S. The characteristic angular O-H bending vibration was found in the range of 1636.20-1648.22 cm-1. Absorption band ranged from 1335-1340 cm-1 attributed to the bent mode of C-C-H,C-O-H and O-C-H. The band appeared at 1150.83 cm-1 and 1150.39 cm-1 is due to the anti-symmetric stretching vibration of C-O-C glycosidic bond respectively for LBS and BB2S. Absorption band for the stretching vibration of C-O was found at 1176.22 cm-1 and 1176.81 cm-1. The strong O-H stretching band at 998.29 cm-1 and 996.28 cm-1 was found for anhydrous glucose units. The FTIR analysis data of both banana starch showed close results with the recently reported value for native banana starch.44
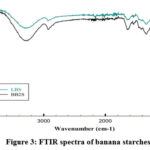 |
Figure 3: FTIR spectra of banana starches |
Morphological characteristic of starch granules
SEM analysis was performed on the starch to determine the granule shape and shown in the Fig 4. The magnification was used 500X and 450X respectively for LBS and BB2S. Both local banana and BARI banana 2 starch granules were found in regular elongated round ridges with smooth surface. The results showed that BB2S granules were larger than the LBS granules. The local banana starch granule length was in the range of 11.3-4.3 µm, whereas width 5.8-3.2 µm. Length of BB2S granules varied from 12.4-4.8 µm, and width ranged from 6.0-2.4 µm. Additionally, in BB2S was found few spherical particles with diameter ranged from 9.6-3.6 µm.
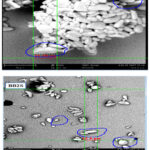 |
Figure 4: Scanning electron microscopic (SEM) images |
Previous study reported that starch granule size has been affecting the physiochemical properties of starch like swelling power and viscosity.45 Smaller granules have a positive impact on digestibility since they have a larger surface area and are easier for enzymes to digest.46 Several other factors also responsible for starch granule variation i.e. agronomic factors, climatic conditions and processing.
X-ray diffraction
The presence and properties of crystalline structures in starch granules were determined using the XRD.47 The X-ray diffraction spectra of the banana starch samples are shown in Figure 5. Based on the characteristics X-ray diffraction line, native starch crystal structure can be classified into four different patterns: A-type, B-type, C-type and V-type.48 With characteristic peaks at around 15°, 17°, 18° and 23° 2θ value, an A-type diffraction pattern is typical of grain starches, but tuber starches typically exhibit a B-type pattern with peaks at roughly 5.8°, 15° 2θ, and a single, strongest peak at 17°, and two minor peaks at around 23° and 24°. The usual X-ray diffraction pattern for pea starches is a C-type, which is a combination of A- and B-type patterns.49 LBS and BB2S had the B-type crystal pattern with strong reflection peak of 2θ at 15.1°, 17.1° and 23.0° where the peak appeared at 17.1° had the highest intensity which confirm the B-type crystal pattern. A less intense peak was also appeared at 34.0°. The d-spacing value for BB2S was found in the range of 3.87 Á to 5.89 Á whereas 2.63 Á to 5.86 Á was found for LBS.
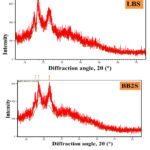 |
Figure 5: X-ray diffraction characteristics of banana starches |
The starch crystallinity can be affected by the amylose content, average chain length of amylopectin and double helices orientation within the crystals.50 C-type starch crystallinity did not follow any pattern, but B-type starch crystallinity decreased with increasing amylose level. The crystallinity of A-type starches was unaffected by the amylose concentration. 51
Conclusion
Banana starches were isolated from two varieties and were characterized to compare their physico-chemical and functional properties with each others. It was found that both of the extracted starch showed the same morphological and crystalline properties, but slightly different functional properties. Smaller granules also have a positive impact on digestibility since they have a larger surface area and are easier for enzymes to digest. So, banana starch with small particle size can be used in infant food preparations. Resistant starch data revealed that both of the varieties can be used as an efficient source for RS extraction. High resistant starch contining food products are advantageous for consumers’ health and intestinal function. To become a good quality starch, swelling power is a crucial prerequisite and this parameter should be high. Based on the physico-chemical and functional properties, these finding reveals that both of the starches can be used as a thickener, stabilizer, emulsifier and de-foaming agents in various food (confectionery, sauces, edible films etc.), pharmaceutical (excipient, tablet/capsule disintegrant, binder etc.) and paper industry.
Acknowledgement
The authors acknowledge and thank the Institute of Glass and Ceramic Research and Testing (IGCRT), and Biomedical and Toxicological Research Institute (BTRI), BCSIR for some of the research facilities.
Conflict of Interest
Authors have no conflict of interest pertaining to this study whatsoever.
Funding Sources
Bangladesh Council of Scientific and Industrial Research (BCSIR), Dhaka-1205, Bangladesh has been funded to conduct this research.
References
- Mondal A., Banerjee S., Bose S., Das P. P., Sandberg E. N., Atanasov A. G. and Bishayee A. Cancer preventive and therapeutic potential of banana and Its bioactive constituents: A systematic, comprehensive, and mechanistic review. Front Oncol.2021; 11: 697143. DOI: 10.3389/fonc.2021.697143.
CrossRef - Banana market review – Preliminary results, FAO, 2022.<https:/fao.org/publications/card/en/c/CB9411EN/>
CrossRef - Soorianathasundaram K., Narayana C.K. and Paliyath G. Bananas and Plantains. In Encyclopedia of Food and Health; Academic Press: Oxford, UK. 2016; 320–327. ISBN:9780123849472.https:// www.elsevier.com/ books/encyclopedia-of-food-and-health/ caballero/978-0-12-384947-2.
CrossRef - French D. Organization of Starch Granules. In: Whistler R.L., BeMiller J.N. and Paschall E.F. Starch: Chemistry and Technology, 2nd Edition, Academic Press, New York, 1994; 183-195. DOI: 10.1016/b978-0-12-746270-7.50005-7.
CrossRef - Suma P. F. and Urooj A. Isolation and Characterization of Starch from Pearl Millet (Pennisetumtyphoidium) Flours. Int J Food Prop. 2015;18(12): 2675-2687. DOI: 10.1080/10942912.2014.981640.
CrossRef - Hanes D.,Nowinski B., Lamb J. J., Larson I. A., McDonald D., Knight R., Song S. J. and Patno N.The gastrointestinal and microbiome impact of a resistant starch blend from potato, banana, and apple fibers: A randomized clinical trial using smart caps. FrontNutr. 2022;9: 987216. DOI: 10.3389/fnut.2022.987216.
CrossRef - Silva G. A. S., Cavalcanti M. T., Almeida M. C. B. M., Araújo A. S., ChinelateG. C. B. and Florentino E. R.Utilização do amido da amêndoa da manga Tommy Atkins comoespessanteembebidaláctea. RevistaBrasileira de EngenhariaAgrícola e Ambiental,2013;17: 1326-1332.http://www.agriambi.com.br Protocolo 310.12 – 22/03/2012.
CrossRef - Morales-Medina R.,Muñio M. D. M.,Guadix E. M. andGuadix A. Produciton of Resistant Starchby Enzymatic Debranching in Legume Flours. Carbohydr Poly. 2014;101(30): 1176-1183. DOI:10.1016/j.carbpol.2013.10.027.
CrossRef - Prerna K. and Sankar C.D. Effect of Modified Resistant Starch of Culinary Banana on Physicochemical, Functional, Morphological, Diffraction and Thermal Properties. Int J Food Prop.2016; DOI: 10.1080/10942912.2016.1147459.
CrossRef - Gibert O., Dufour D.,Giraldo A., Sanchez T.,Reynes M., Pain J P., Gonzalez A., Fernandez A.and Diaz A. Differentiation between Cooking Bananas and Dessert Bananas, Morphological and Compositional Characterization of Cultivated Colombian Musaceae (Musa sp.) in Relation to Consumer Preferences. JAgric Food Chem. 2009; 57: 7857–7869. DOI: 10.1021/jf901788x.
CrossRef - Agama-Acevedo E.,Nuñez-Santiago M.C., Alvarez-Ramirez J. and Bello-Pérez L.A. Physicochemical, Digestibility and Structural Characteristics of Starch Isolated from Banana Cultivars. CarbohydrPolym. 2015; 124: 17–24.DOI: 10.1016/j.carbpol.2015.02.003.
CrossRef - Zhang Y., Zhang Y.,Xu F., Wu Gang. and Tan L. Molecular structure of starch isolated from jackfruit and its relationship with physicochemical properties. SciReport.2017;7(1): 13423.DOI: 10.1038/s41598-017-13435-8.
CrossRef - Hasmadi M., Addrian I., Umairah B.A.,Mansoor A.H. and Zainol M.K. Evaluation of physicochemical and functional characteristics of flour from three cultivars of unripe banana (Musa sp.) cultivated in Sabah, Malaysia. Food Res. 2021;5(4):135–144. DOI: 10. 26656/ fr.2017. 5(4).642.
CrossRef - Ssonko U. L. andMuranga F. I. Partial characterization of starches from major banana (matooke) cultivars grown in Uganda. Food SciNutr. 2017;1–9. DOI: 10.1002/fsn3.505.
CrossRef - FidaR., PramafisiG. and CahyanaY. Application of banana starch and banana flour in various food products: A review, IOP Conf. Series: Earth Environ Sci.2020; 443: 012057. DOI: 10.1088/1755-1315/443/1/012057.
CrossRef - Cahyana Y., Wijaya E., Halimah T. S., Marta H.,Suryadi E. and Kurniati D. The effect of different thermal modifications on slowly digestible starch and physicochemical properties of green banana flour (Musa acuminatacolla), Food Chem. 2019; 274: 274-280. DOI: 10.1016/j.foodchem.2018.09. 004.
CrossRef - Bojarczuk A., Skapska S., Khaneghah M. A. and Marszalek K. Health benefits of resistant starch: A review of the literature.JFunc Food. 2022; 93: 105094. DOI: 10.1016/j.jff.2022. 105094.
CrossRef - Sanju B. D., AnkitaC., Maurice N. C., Sneh P. B., Prince C. and Ajay S.Lotus Seed Starch: A Novel Functional Ingredient with Promising Properties and Applications in Food-A Review.Starch – Stärke.2022; 74: 2200064. DOI: 10.1002/star.202200064.
CrossRef - Faquino C. F., Salomao L. C. C., Cecon P. R., Siqueira D. L. D. and Ribeiro S. M. R. Physical, Chemical and Morphological Characteristics ofBanana Cultivars Depending on Maturation Stages. 2017; 30: 87-96.ISSN : 1983-2125.
CrossRef - AOAC Official method of Analysis. 18th Edition, Association of Officiating Analytical Chemists, Washington DC, 2005; Method 935.14 and 992.24.
- Zhu, T., Jackson, D. S., Wehling, R. L., Geera, B. Comparison of Amylose Determination Methods and the Development of a Dual Wavelength Iodine Binding Technique.2008, 85(1), 51–58. doi:10.1094/cchem-85-1-0051
CrossRef - Nigudkar M. R. Estimation of Resistant Starch Content of Selected Routinely Consumed Indian Food Preparations. Curr Res Nutr Food Sci 2014; 2 (2). doi : 10.12944/CRNFSJ.2.2.03
CrossRef - Narayana K. and NarasingaRao M.S. Functional Properties of Raw and Heat Processed Winged Bean Flour. J Food Sci.1982; 42: 534-538.DOI: 10.1111/j.1365-2621.1982.tb04976.x.
- Oladele A.K. and Aina J.C. Chemical Composition and Functional Properties of Flour Produced from Two Varieties of Tiger Nut (Cyperusesculentus). African J Biotechnol. 2007; 3: 2473-2476.DOI: 10.5897/AJB2007.000-2391.
CrossRef - Bello-Perez L.A., Roger P., Baud B. and Colonna P. Macromolecular features of starches determined by aqueous high-performance size exclusion chromatography. J Cereal Sci. 1998; 27: 267-278.DOI: 10.1006/jcrs.1998.0186.
CrossRef - Fontes S., Cavalcanti M.,Candeia R. and Almeida E. Characterization and Study of Functional Properties of Banana Starch Green Variety of Mysore (Musa AAB-Mysore). Food Sci Technol. 2017; 37: 224–231.DOI:10.1590/1678-457X.18916.
CrossRef - Functional Characteristics of Starches from Different Banana Cultivars. J. Food Sci. Technol.2015, 52, 7289–7296.DOI: 10.1007/s13197-015-1809-0.
CrossRef - Jiang H., Zhang Y., Hong Y., Bi Y., Gu Z., Cheng L., Li Z. and Li C. Digestibility and Changes to Structural Characteristics of Green Banana Starch During In vitro Digestion. Food Hydrocoll.2015; 49: 192–199.DOI: 10.1016/j.foodhyd.2015.03.023.
CrossRef - Safreena K., Nagamaniammai G., Preetha K. A., Musthafa M. E. and Walid Q.Efect of diferent drying techniques on the nutrient and physiochemical properties of Musa paradisiaca (ripe Nendran banana) powder. J Food SciTechnol. 2022; DOI: 10.1007/s13197-022-05498-x.
CrossRef - SakshiS., Sukhcharn S. and Charanjit S. R. Isolation of starches from different tubers and study of their physicochemical, thermal, rheological and morphological characteristics. Starch/Stärke.2016; 68: 160–168.DOI: 10.1002/star.201500186.
CrossRef - Fontes S. de M., Cavalcanti M. T.,Candeia R. A. and Almedia E. L. Characterization and study of functional properties of banana starch green variety of Mysore (Musa AAB – Mysore). Food Sci and Technol.2017;37(2): 224–231. DOI:10.1590/1678-457X.18916.
CrossRef - Chumsri, P.; Panpipat, W.; Cheong, L.-Z.; Chaijan, M. Formation of Intermediate Amylose Rice Starch–Lipid Complex Assisted by Ultrasonication. Foods 2022, 11, 2430. Doi: 10.3390/ foods11162430
CrossRef - Florence I. M. and Umar L. S. Partial characterization of starches from major banana (matooke) cultivars grown in Uganda.FoodSciNutr. 2017; 1–9.DOI: 10.1002/fsn3.505.
CrossRef - Bird A. R. and Regina A. High amylose wheat: a platform for delivering human health benefits. J Cereal Sci.2018; (82): 99-105. DOI: 10.1016/j.jcs.2018.05.011.
CrossRef - TribessT.B., Hernández-UribeJ.P., Méndez-MontealvoM.G.C., MenezesE.W., Bello-PerezL.A. and, TadiniC.C. Thermal properties and resistant starch content of green banana flour (Musa cavendishii) produced at different drying conditions, LWT – Food Sci Technol. 2009; 42(5): 1022-1025. DOI:10.1016/j.lwt.2008.12.017.
CrossRef - TaeweeT. Some Properties of Starch Extracted from Three Thai Aromatic Fruit Seeds.Starch/Stärke. 2008; 60: 199–207.DOI: 10.1002/star.200800641.
CrossRef - Marta H.,Cahyana Y.,Djali M. andPramafisi G. The Properties, Modification, and Application of Banana Starch. Polymers.2022; 14: 3092. DOI:10.3390/polym14153092.
CrossRef - Awolu O.O., Osemeke R.O. and Ifesan B.O.T. Antioxidant, functional and rheological properties of optimised composite flour, consisting wheat and amaranth seed, brewers’ spent grain and applepomace. J of Food Sci Technol. 2016; 53(2): 1151-1163. DOI:10.1007/s13197-015-2121-8.
CrossRef - Scott J. M., David E. M., Hugh J. C., Colin J. R. The Role of Hydrogen Bonding in Amylose Gelation. 2004, 56(3-4), 122–131. doi:10.1002/star.200300242
CrossRef - Amandikwa C. I.,Uzomah A. and Olawuni A.I. Physico-chemical properties of wheatyam flour composite bread. Nigerian Food Jour. 2015; 53(1): 12-17.DOI: 10.1016/j.nifoj.2015.04.011.
CrossRef - Alimi B.A., Workneh T.S. and Sibomana M.S. Effect of hydrothermal modifications on functional, pasting and structural properties of false banana (Enseteventricosum) starch. Food Biophys. 2016; 11(3): 248–256. DOI: 10.1007/s11483-016-9435-6.
CrossRef - Hasmadi M., Addrian I., UmairahB. A. Z., Mansoor A.H. and Zainol M.K. Evaluation of physicochemical and functional characteristics of flour from three cultivars of unripe banana (Musa sp.) cultivated in Sabah, Malaysia.Food Res.2021; 5 (4): 135 – 144. DOI:10.26656/FR.2017.5(4).642.
CrossRef - Thanyapanich N.,Jimtaisong A. andRawdkuen S. Functional Properties of Banana Starch (Musa Spp.) and Its Utilization in Cosmetics. Molecules.2021;26: 3637.DOI:10.3390/molecules26123637.
CrossRef - Torrenegra M., Solano R., Herrera A., Leon G. andPajaro A., Fourier transform Infrared Spectroscopy (FTIR) Analysis of Biodegradable Films Based on Modified Colombian Starches of Cassava and Yam. Int J Chem Tech Res.2018; 11(11): 184-192. DOI: 10.20902/IJCTR.2018.111118.
CrossRef - Bi Y., Zhang Y., Jiang H., Hong Y., Gu Z., Cheng L., Li Z. and Li C. Molecular Structure and Digestibility of Banana Flour and Starch. Food Hydrocoll. 2017; 72: 219–227. DOI: 10.1016/j.foodhyd.2017.06.003.
CrossRef - Riley C. K. In vitro digestibility of raw starches extracted from five yam species grown in Jamaica. Starch/Starke.2004; 56: 69–73.DOI: 10.1002/star.200300195.
CrossRef - Wang J., Huang H.H. and Chen P.S. Structural and Physicochemical Properties of Banana Resistant Starch from Four Cultivars. Int J Food Prop. 2017; 20: 1338–1347. DOI: 10.1080/10942912.2016.1209517.
CrossRef - Xiaoyan.T.,Xiaoxi L., Ling C., Fengwei X., Lin L. and Huang J.Effect of heat-moisture treatment on multi-scale structures and physicochemical properties of breadfruit starch.Carbohydr Poly.2017;. DOI: 10.1016/j.carbpol.2017.01.029.
CrossRef - Eisenhaber F. and Schulz W. Monte carlo simulation of the hydration shell of double-helical amylose: A left-handed antiparallel double helix fits best into liquid water structure. 1992; 32(12): 1643–1664.DOI: 10.1002/bip.360321207.
CrossRef - Tester R. F. and Morrison W. R. Swelling and gelatinization of cereal starches. I. Effects of amylopectin, amylose, and lipids. Cereal Chem. 1990; 67(6): 551-557.DOI.10.1006/jcrs.1993.1001.
- Liu Q. Understanding starches and their roles in foods. In S. W. Cui (Ed.), Food carbohydrates: Chemistry, physical properties, and applications. 2005; 327–329. ISBN: 9780849315749.
CrossRef
Scopus Citation(s): 14
Accepted on: 02 Jun 2023
Second Review by: Arpita Das and Rigopoulos Nikolaos
Final Approval by: Dr. Vikas Chopra


Web of Science Coverage
Emerging Sources Citation Index (ESCI)
2024 Journal Impact Factor: 1.1
Scopus Journal Metrics
CiteScore 2025: 2.6
CiteScore Details
Sustainable Nutrition: Food Systems, Nutrient Retention, and Public Health Impact
![]()
This journal is a member of, and subscribes to the principles of, the Committee on Publication Ethics (COPE)


