Optimizing Ultrasound Probe Extraction for Anthocyanin and Phenolic Content from Purple Waxy Corn’s Dried Cobs: Impact of Extraction Temperature and Time
Rattana Muangrat*
Division of Food Process Engineering, Faculty of Agro-Industry, Chiang Mai University, Chiang Mai, Thailand.
Corresponding Author E-mail: rattanamuangrat@yahoo.com
DOI : http://dx.doi.org/10.12944/CRNFSJ.11.2.32
Download this article as:
![]()
The utilization of purple waxy corn's dried cobs as agricultural waste holds potential for the recovery of valuable anthocyanins and phenolic compounds, thereby adding value to the cobs and facilitating their application in the food industry. This study aimed to employ an ultrasound probe extraction technique in combination with the central composite face-centered design, which is widely used in response surface methodology (RSM). Specifically, this research aimed to determine the suitable extraction temperature and time that would result in the highest possible yield of anthocyanins and phenolic compounds from the purple waxy corn’s dried cobs The ultrasound probe extraction method was implemented with a solvent-sample weight ratio of 20:1 w/w, utilizing a solvent composition consisting of a water to ethanol weight ratio of 1:1 w/w. Furthermore, an ultrasonic amplitude of 50% was employed during the extraction process. The result indicated that the optimal extraction condition to obtain the high yield of anthocyanins and phenolics simultaneously was at the extraction temperature of 70 C for 25 min extraction time. Under the suitable extraction condition, the experimental extraction produced the dried cob extract with a high total anthocyanin content of 305.40 g cyanidin-3-glucoside equivalent (C3G)/g dried cob) and total phenolic content of 25.50 mg gallic acid equivalent (GAE)/g dried cob). For this optimal condition, an antioxidant activity of the extract of approximately 6.41 mg/mL was also found, resulting in 50% reduction in the initial DPPH concentration.
KEYWORDS:Anthocyanins; cyanidin-3-glucoside; Phenolic Compounds; Purple Waxy Corn Cobs; Ultrasound Probe Extraction
Introduction
One type of corn, which is the most popular and receives high consumer demand, is purple waxy corn, scientifically named Zea mays L. var. ceratina. The purple waxy corn provides functional compounds with high antioxidant activity, which are anthocyanins and other phenolics.1,2,3 Therefore, purple waxy corn can be an alternative natural source of antioxidant compounds, which can be utilized in the supplement, food, and beverage industries.3,4,5 Anthocyanins, found in several plants, can produce various colors and are used as natural colorants.6 Anthocyanins could enhance the erythrocyte function, promote body immunity, protect against atherosclerosis, decrease cancer incidence, etc.5,7 Anthocyanins are detected in several parts of purple waxy corn; for example, cob, silk, husk, and seed.2,3 Cyaniding-3-glucoside, peonidin-3-glucoside, pelargonidin-3-glucoside, and corresponding malonate complements are detected as important anthocyanins in purple waxy corn.1,5,8 Most dried purple waxy corn cobs are usually thrown away as agricultural waste or used as an essential ingredient for animal food production.9,10 Therefore, the dried cobs of purple waxy corn could be a natural source of anthocyanins and phenolics for the production of food colorants instead of synthetic colorants. Therefore, this natural color source might reduce the amount of imported artificial colorants and add value to the dried cobs of purple waxy corns. Selection of a suitable extraction technique is an important step to achieve high recovery of anthocyanins and other phenolics from the dried cobs of purple waxy corn.
Recently, various novel extraction techniques have been reported, including subcritical or supercritical solvent extraction,3,11,12 microwave or ultrasound combined with solvent extraction,13,14,15 and accelerated solvent extraction.16 Ultrasound combined with solvent extraction, called ultrasound assisted extraction is one interesting and practical technique for bioactive compound extraction from several raw materials. This technique is inexpensive, requires a minimum amount of solvent to extract, and is easy to operate.17 Moreover. the advantage of the ultrasound extraction technique is that it can generate cavitation bubbles within the extraction system. Ultrasound cavitation improves the mass transfer rate between raw material and extraction solvent by producing cavitation flows on the surface of the raw material, which causes an easier breakdown of material cell.18 Thus, the ultrasound assisted extraction method has been extensively utilized for extracting total anthocyanins and phenolics from several fruits and vegetables; for example, eggplant,19 pomegranate,20 mulberry,21 black and purple rice bran,22 sweet potato,23 raspberry,24 sugar beet,25 blackberry,26 and grapes.27,28 Nevertheless, there are few extraction studies of anthocyanins and phenolics from purple waxy corn’s dried cobs by using the ultrasonic probe extraction method. Additionally, several extraction factors; for example, type of solvents, solvent composition, the mass ratio of solvent to raw material, ultrasound amplitude, temperature and time, have affected the extraction efficiency.29 Then, it is necessary to use extraction factors to determine the optimum extraction condition to gain a high amount of total anthocyanins and phenolics. An effective approach, which is widely used in statistical and mathematical design for optimizing the extraction process factors, is response surface methodology (RSM).30 The RSM approach helps reduce the number of experiments and evaluate the interactions between multiple extraction factors. Besides, the RSM approach for optimization of the extraction process could present a visual effect result of various extraction factors, which can easily help to determine an optimal area for the extraction process.31 In an earlier study,15 ultrasound amplitude levels of 25, 50, 100%, extraction solvents (as water, water-ethanol mixed solvent with the weight ratio of 1:1 w/w and ethanol), by using a solvent-sample weight ratio of 20:1 w/w, at 65 C extraction temperature for 30 min, were examined to determine the high content recovery of total anthocyanins and phenolics. The most effective method for obtaining high levels of anthocyanins and phenolics involved using a water-ethanol mixed solvent with a weight ratio of 1:1, and an ultrasound amplitude level of 50%. This resulted in a high content of anthocyanins, specifically 240.16 g cyanidin-3-glucoside equivalent/g dried cob, and a total phenolics content of 27.66 mg gallic acid equivalent/g dried cob. To further increase the amount of these compounds extracted from purple waxy corn’s dried cobs, a mathematical model for ultrasound probe extraction was developed through experimentation using the central composite face-centered design method through the implementation of the RSM technique. The extraction temperature and time were identified as critical extraction process factors. Finally, the dried cob extract, obtained using optimal extraction conditions, was evaluated for its antioxidant capacity.
Materials and Methods
Samples
The cobs of purple waxy corn with the genotype known as Fancy Muang 111 were acquired from Pacific Seeds (Thai) Ltd. located in Thailand. After the purple waxy corn cobs were harvested, they underwent the drying process using a tray drier. The drying of the cob samples was carried out for 6 h at 60±5°C temperature, with a 0.5 m/s drying air velocity, resulting in a moisture content of approximately 4.58 g/100 g of dried cob samples. The dried cobs were then cut into 0.2-0.5 cm long pieces, loaded into polyethylene bags, sealed, and stored at a temperature of 4°C for further testing of their physicochemical properties.
Chemicals and Reagents
Analytical-grade chemicals and reagents were used in the experiments. High-purity gallic acid (97%) was obtained from Sigma-Aldrich in Germany and used as the standard phenolic compound. Cyanidin-3-glucoside, used as the standard anthocyanin, was also acquired from Sigma-Aldrich. Folin-Ciocalteu’s reagent, DPPH (2, 2-diphenyl-1-picryl-hydrazyl), HPLC grade acetonitrile, and trifluoroacetic acid (TFA) were also obtained from Sigma-Aldrich. Sodium acetate (CH3COONa), anhydrous sodium carbonate (Na2CO3), and ascorbic acid were acquired from Loba Chemie, located in India, while potassium chloride (KCl) was obtained from Ajax Finechem Pty Ltd., in Australia. Lastly, hydrochloric acid (HCl, 37% w/w) and ethanol (C2H5OH, 95% w/w) were procured from RCI Labscan Limited, located in Thailand.
Ultrasound Probe Extraction Process
A Model VC505 ultrasonic processor with a 500-watt capacity, 20 kHz frequency, and a 1.3 cm diameter probe from Sonics & Materials, Inc., located in the USA, was employed to extract the total anthocyanins and phenolics. The extraction temperature was maintained with a water bath, utilizing a 250 mL stainless steel extraction vessel. The ultrasound probe was placed at a half-height position in the dried cob sample, and the solvent-sample weight ratio of 20:1 w/w, along with a water-ethanol mixed solvent with a weight ratio of 1:1 w/w and an amplitude level of 50%, was used for the extraction process at various temperatures (50, 65, and 80 C) and extraction times (15, 30, and 45 min). After reaching the desired temperature, the extraction process was initiated for each experiment. Upon completion of the extraction process, the ultrasonic probe was turned off, taken out of the sample vessel, and the vessel was cooled down to 25°C, which is the ambient room temperature. The extract samples were then filtered, transferred to sealed amber glass bottles, and stored at 4±1 C to analyze their properties.
Experimental Design and Statistical Analysis
To extract total anthocyanins and phenolics from purple waxy corn’s dried cobs, the study employed the response surface methodology (RSM) approach, specifically the central composite face-centered design. The RSM approach used two process factors, extraction temperatures (50, 65, and 80°C) and extraction times (15, 30, and 45 min), to evaluate the optimum conditions. The central composite face-centered design allowed for the evaluation of the relationship between these factors and the yield of total anthocyanins and phenolics. The response optimizer was used to predict values for each response variable to achieve optimum conditions. The regression equation for each process factor was coded as shown in equation (1).
where Xi is the coded process factor, Xi is the uncoded process factor, X0 is the uncoded process factor at the center point and ΔX is the step change value of uncoded process factor. Table 1 shows the values of lower level, center point, and upper level of each process factor which are coded as −1, 0, and +1, respectively, by using RSM.
Table 1: Levels of the process factors for the central composite face-centered design
|
Process factors |
Levels |
||
|
Lower (–1) |
Center points (0) |
Upper (+1) |
|
|
Extraction temperature (°C) |
50 |
65 |
80 |
|
Extraction time (min) |
15 |
30 |
45 |
The RSM technique using regression analysis was applied to analyse the experimental yield of total anthocyanins and phenolics for fitting into the second order (or quadratic) polynomial equation as shown in the following equation:
where Y is each predicted response variable; Xi and Xj are value of process factors, i and j are in the range from 1 to k ; k is the number of process factors where k is 2 in this study. βo , βi, βii and βij are the constants which represent the intercept, coefficients of linear terms, coefficients of quadratic terms, and coefficients of interactive terms, respectively. In this study, the central composite face-centered design included 22 factorial points, 4 axial points (2 × 2), and 1 center point, with each point replicated twice. The negative and positive values of alpha (α) are at −1 and 1, respectively, for the axial points. Table 2 demonstrates how all extraction conditions are used.
Table 2: Process factorsand experimental response variables.
|
Expt. No. |
Uncoded Process Factors |
Coded Process Factors |
Response Variables |
|||
|
Temperature (°C) |
time (min) |
x1* |
x2* |
anthocyanin concentration (µg C3G/g dried cob) |
total phenolic concentration (mg GAE/g dried cob) |
|
|
1 |
50 |
15 |
-1 |
-1 |
90.00 |
19.54 |
|
2 |
50 |
15 |
-1 |
-1 |
120.00 |
16.91 |
|
3 |
80 |
15 |
+1 |
-1 |
410.00 |
17.58 |
|
4 |
80 |
15 |
+1 |
-1 |
370.00 |
18.19 |
|
5 |
50 |
45 |
-1 |
+1 |
110.00 |
19.32 |
|
6 |
50 |
45 |
-1 |
+1 |
130.00 |
18.71 |
|
7 |
80 |
45 |
+1 |
+1 |
260.00 |
14.79 |
|
8 |
80 |
45 |
+1 |
+1 |
190.00 |
11.42 |
|
9 |
50 |
30 |
-1 (-α) |
0 |
190.00 |
23.68 |
|
10 |
50 |
30 |
-1 (-α) |
0 |
170.00 |
25.32 |
|
11 |
80 |
30 |
+1 (+α) |
0 |
360.00 |
19.06 |
|
12 |
80 |
30 |
+1 (+α) |
0 |
380.00 |
15.21 |
|
13 |
65 |
15 |
0 |
-1 (-α) |
290.00 |
24.22 |
|
14 |
65 |
15 |
0 |
-1 (-α) |
210.00 |
26.44 |
|
15 |
65 |
45 |
0 |
+1 (+α) |
160.00 |
15.72 |
|
16 |
65 |
45 |
0 |
+1 (+α) |
170.00 |
20.73 |
|
17 |
65 |
30 |
0 (cp) |
0 (cp) |
230.00 |
26.73 |
|
18 |
65 |
30 |
0 (cp) |
0 (cp) |
250.00 |
29.57 |
* x1 and x2 show the coded value of extraction temperature and time, respectively
In order to determine the significance of the regression coefficients of the quadratic polynomial equation, a multiple regression analysis was conducted. This analysis estimated the effect of extraction temperature and time on the response variables, specifically the yield of anthocyanins and phenolics. The significance of the terms in the quadratic polynomial equation for each response variable was evaluated using analysis of variance (ANOVA). Various descriptive statistical analyses were utilized to compute the experimental data, including the sum of squares, mean squares, degree of freedom (df), F-value, and p-value, which indicated the statistical significance of the quadratic polynomial equation. In order to evaluate the suitability of the quadratic polynomial equation, an analysis was conducted to test for lack of fit, and the adjusted coefficient of determination ( adjusted R2) was computed. Additionally, 2D contour and 3D surface plots were created to depict the estimated quadratic polynomial equations of the total anthocyanin and phenolic content. Moreover, interactions between each extraction variable and response variables were visualized using interaction plots. Minitab statistical software (Minitab version 16.1, USA) was employed conduct the multiple regression analysis, to compute regression coefficients, and achieve the 2D contour plots, 3D surface plots, and interaction plots.
Determination of Anthocyanins Concentration
As outlined in previous studies, the anthocyanin yield was determined through a pH-differential method.15,32 Specifically, the extract sample (0.1 mL) was mixed with 0.025 M potassium chloride buffer solution pH 1.0 until the final volume reached 3 ml, while another cuvette containing the extracted sample (0.1 mL) was mixed with 0.4 M sodium acetate buffer solution pH 4.5 until the final volume reached 3 mL. The absorbance of the mixture was measured at 510 nm and 700 nm, using the lambda 25 double-beam UV/Vis Spectrometer from Perkin Elmer Inc. in Shelton, USA. The cyanidin-3-glucoside equivalent anthocyanin content of the extract samples was computed using equation (3).

The anthocyanin content (in µg C3G (cyanidin-3-glucoside equivalent)/g dried cob) was computed using equation (3), where Abs is the absorbance value calculated as [(Abs510-Abs700)at pH 1.0 – (Abs510-Abs700)at pH 4.5] , MW is the anthocyanin molecular weight (449.2 g/mol), DF is the dilution factor, is the cyanidin-3-glucoside molar absorptivity (26,900 L/mol/cm), and the value of L, representing the optical path length of the cuvette cell, is equal to 1.
Determination of Phenolic Compound Concentration
To measure phenolic compound content in the crude extracts, Folin-Ciocalteu reagent and a gallic acid standard curve were utilized.15 Initially, the extract sample (0.25 mL) was mixed with the Folin-Ciocalteu reagent (0.25 mL), followed by incubation at 25 °C for 2 min.33 Afterward, 15% Na2CO3 solution (1 mL) was added to the mixture, and it was subsequently incubated at 25 °C for 1 h. The resulting mixture’s absorbance was detected at 765 nm using the lambda 25 double-beam UV/Vis Spectrometer (PerkinElmer, Inc., Waltham, MA, USA). The total phenolic compound content was computed using the gallic acid standard curve and the results were presented as mg GAE (gallic acid equivalent)/g dried cob.
Anthocyanin Compound Analysis
To characterize individual anthocyanins in extract samples, a Dionex UltiMate 3000 chromatography-mass spectrometry analysis was conducted using a high-performance liquid chromatography (HPLC) system from Thermo Fisher Scientific Inc. in Bremen, Germany, according to a method of Vayupharp and Laksanalamai,1 and Muangrat.15 A C18 HPLC column was used to separate anthocyanins to gain individual anthocyanin. After adding 0.5% HCl to the anthocyanin extracts, the resulting solution was filtered through a syringe filter with a 0.45 μm pore size. For the mobile phase A, it consisted of an aqueous solution of trifluoroacetic acid (TFA, 0.05% v/v), while mobile phase B was composed of HPLC-grade acetonitrile (100%). Linear gradient elution was employed, starting with 95-80% A for the first 20 minutes, followed by 80-60% A for the next 30 minutes, and at a 0.8 mL/min flow rate. The column oven was maintained at a constant temperature of 35°C during the analysis. A 10 μL sample volume was injected into the HPLC column. Each analyte in the extracted sample was simultaneously determined at wavelength of 520 nm. Next, the chromatogram of the sample was compared to that of the cyanidin-3-glucoside standard.
Antioxidant Activity Measurement
The crude extract obtained from purple waxy corn’s dried cobs was evaluated using DPPH scavenging activity assay based on the method reported by Brand-Williams.34 The 60 μM concentration of DPPH solution was obtained by dissolving it in ethanol. Various concentrations of extract samples were mixed with the DPPH solution. In each cuvette, 0.1 mL of extract concentration was added to ethanolic DPPH solution (3.9 mL) and kept in the dark at 25°C for 30 minutes to incubate. The absorbance of the mixture was measured at a wavelength of 515 nm, and the measurement was performed in triplicate. For the evaluation of antioxidant activity in the extract samples, the DPPH IC50 value was utilized, while ascorbic acid was employed as the positive control. To obtain the DPPH IC50 value, a graph was plotted between the percent inhibition of free radical DPPH and the extract sample concentration, and the extract sample concentration that was needed to decrease the absorbance at a specific wavelength by 50% was determined. The percentage of DPPH inhibition was calculated using equation (4) to determine the scavenging activity of the extract samples towards the DPPH free radical.
where Acontrol represents the DPPH solution absorbance in ethanol, which served as a control and did not contain any antioxidant, while Acsample represents the absorbance of each extract sample or positive control mixed with the DPPH solution.
Results and Discussion
Model Fitting for Ultrasonic Probe Extraction Process
A combination of central composite face-centered design and RSM technique was utilized for optimization to enhance the extraction efficiency of anthocyanin and phenolic compound content from purple waxy corn’s dried cobs. The study focused on two crucial process variables, namely extraction temperature and extraction time, and the experimental data and process parameters are summarized in Table 2. The analysis of variance, good-fit, and mathematical model adequacy values are also reported. The yield of total anthocyanins ranged from 90-410 μg C3G/g dried cob, while that of total phenolics was 11.42-29.57 mg GAE/g dried cob. The optimal yield of total anthocyanins was 410 μg C3G/g dried cob for 15 min at an extraction temperature of 80 C, while the optimal yield of total phenolics was 29.57 mg GAE/g dried cob for 30 min at an extraction temperature of 65 C. After extracting data from the experiment, a quadratic polynomial model was applied, and ANOVA was performed to identify the significance of each coefficient in the model. Any variables deemed insignificant were eliminated from the analysis. Tables 3 and 4 present the subsequent results.
The final predictive equations (equation (5) and equation (6)) with uncoded variables for the overall amount of anthocyanins (equation (5)) and phenolic compounds (equation (6)) of dried cob extract subjected to ultrasound probe extraction are given as follows:
Anthocyanin content (μg C3G/g dried cob) = – 683.889 + 12.444Temp + 24.833 time – 0.241 time2 – 0.200 Temperature × time … (5)
Phenolic compound content (mg GAE/g dried cob) = – 95.013+ 3.264 Temperature + 1.514 time – 0.025 Temperature 2 – 0.021 time 2 –
– 0.006 Temperature × time … (6)
According to the quadratic polynomial model (equation (5)), the amount of anthocyanin present was positively correlated with both temperature and time, with the quadratic term of time significantly impacting the total anthocyanin yield. However, the interaction between extraction temperatures and times had a negative effect on the total anthocyanin yield. The regression coefficients of the quadratic polynomial model were calculated, and ANOVA results were obtained. The quadratic polynomial model showed the highest level of significance (p<0.05) with a very high F-value (54.31) in terms of the extraction of total anthocyanins. Following the ANOVA test, the values of determination coefficient ( R2) and adjusted determination coefficient (adjusted R2) were determined to be 0.9435 and 0.9262, respectively. The p-value of lack of fit for the total anthocyanin yield was found to be 0.735 (>0.05), indicating that the quadratic polynomial model was suitable for predicting response variables in this experimental study.
Table 3: ANOVA results for the quadratic polynomial model of overall amount of anthocyanins.
|
Source |
Sum of squares |
df |
Mean square |
F-value |
p-value |
|
Model |
158478 |
4 |
39619.4 |
54.31 |
0.000 |
|
Linear |
59884 |
2 |
29942.2 |
41.05 |
0.000 |
|
Temperature (°C) |
59733 |
1 |
59733.3 |
81.88 |
0.000 |
|
time (min) |
21578 |
1 |
21577.6 |
29.58 |
0.000 |
|
Square |
11736 |
1 |
11736.1 |
16.09 |
0.001 |
|
time (min)´time (min) |
11736 |
1 |
11736.1 |
16.09 |
0.001 |
|
2-Way Interaction |
16200 |
1 |
16200.0 |
22.21 |
0.000 |
|
Temperature (°C)´time (min) |
16200 |
1 |
16200.0 |
22.21 |
0.000 |
|
Residual Error |
9483 |
13 |
729.5 |
||
|
Lack of fit |
1733 |
4 |
433.3 |
0.50 |
0.735 |
|
Pure error |
7750 |
9 |
861.1 |
||
|
Total |
167961 |
17 |
|||
|
R2 = 0.9435 |
R2adjust = 0.9262 |
Equation (6) presents the quadratic polynomial model for total phenolic content, including quadratic terms of extraction temperature and extraction time, an interaction term, and linear terms of extraction temperature and extraction time. The ANOVA results in Table 4 indicate that the adjusted R2 value was 0.743, which is relatively low, but the mathematical model was still statistically acceptable (p<0.05). Additionally, the ANOVA test revealed that the lack of fit had an insignificant p-value of 0.097 (>0.05), suggesting that this quadratic polynomial model was suitable for determining relative response variables.
Table 4: ANOVA results for the quadratic polynomial model of the overall amount of phenolic compounds.
|
Source |
Sum of squares |
df |
Mean square |
F-value |
p-value |
|
Model |
329.06 |
5 |
65.813 |
10.85 |
0.000 |
|
Linear |
186.34 |
2 |
93.170 |
15.36 |
0.000 |
|
Temperature (°C) |
123.78 |
1 |
123.777 |
20.41 |
0.001 |
|
time (min) |
80.15 |
1 |
80.146 |
13.22 |
0.003 |
|
Square |
210.72 |
2 |
105.359 |
17.37 |
0.000 |
|
Temperature (°C)´Temperature (°C) |
124.96 |
1 |
124.955 |
20.60 |
0.001 |
|
time (min)´time (min) |
85.76 |
1 |
85.763 |
14.14 |
0.003 |
|
2-Way Interaction |
15.49 |
1 |
15.493 |
2.55 |
0.136 |
|
Temperature (°C)´time (min) |
15.49 |
1 |
15.493 |
2.55 |
0.136 |
|
Residual Error |
72.78 |
12 |
6.065 |
||
|
Lack of fit |
35.49 |
3 |
11.828 |
2.85 |
0.097 |
|
Pure error |
37.29 |
9 |
4.144 |
||
|
Total |
401.84 |
17 |
|||
|
R2 = 0.8189 |
R2adjust = 0.7434 |
The extraction of the overall amount of anthocyanins and phenolics from purple waxy corn’s dried cobs using ultrasound probe extraction can be effectively modelled using quadratic polynomial equations, as depicted in equations (5) and (6), respectively. Therefore, it is recommended that these models be used to predict experimental values with high accuracy.
Response Surface Analysis
Impact of Ultrasound Probe Extraction Parameters on Total Anthocyanin Content
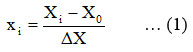
Fig. 1 displays contour and three-dimensional surface plots for the overall amount of anthocyanins. The results demonstrate that the content of total anthocyanins exceeded 350 μg C3G/g dried cob when the extraction time was between 15-30 min and the extraction temperature was within the range of 75-80 °C, as depicted in Fig. 1(b). The highest recorded level of total anthocyanin content was achieved at 392.70 μg C3G/g dried cob, utilizing an extraction temperature of 80 °C and an extraction duration of 18.33 minutes.
 |
Figure 1: (a) 3D and (b) 2D plots show the relationship between total anthocyanins in extract samples, extraction temperatures, and extraction times in ultrasound probe extraction |
From Fig. 1, it is observed that the yield of total anthocyanins increased significantly during the first 15 min of extraction process, and then the rate of extraction slowed until it reached equilibrium. For the first 15 min, cell wall of dried cob sample might be fractured because of the acoustic cavitation effect, resulting in the solvent penetration through the sample matrix and then increasing the anthocyanin dissolution into the solvent.35 The optimal extraction yield was attained at 18.33 min, and any extension of the extraction time could result in the degradation of anthocyanins in the extract from dried cobs. Hence, a longer extraction time than 18.33 min might be unnecessary.
Fig. 1 illustrates the relationship between the total anthocyanins content in extract samples and the process factors, namely extraction temperature and extraction time, using three-dimensional (3D) surface and contour (2D) plots in ultrasound probe extraction. As depicted in Fig. 1, the content of total anthocyanins increased significantly from approximately 150.00 to 392.70 μg C3G/g dried cob when the extraction temperature was increased from 50 °C to 80 °C. The higher extraction temperature caused an increase of the target compounds’ solubility, solvent diffusion and mass transfer.36 The lowest extraction temperature and highest extraction time, which were used, would have produced the low content of total anthocyanins. Therefore, the optimal amount of total anthocyanins could be obtained by operating the extraction condition at 80 C for 18.33 min.
Impact of Ultrasound Probe Extraction Parameters on Total Phenolic Content
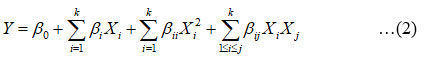
The 3D surface and 2D plots visualizing the correlation between the content of total phenolics are presented in Fig. 2. There was a significant quadratic relationship between the extraction temperatures and times, and the overall amount of phenolic compounds. Increasing both the extraction temperatures and times resulted in an improvement in the overall amount of phenolic compounds. The overall amount of phenolic compounds reached a maximum value of 27.35 mg GAE/g dried cob when the extraction temperature was set at 62.42 °C for 27.42 min extraction time. The effect on the content of total phenolics by increasing the extraction temperature greater than 62.42 °C or extraction time beyond 27.42 min was analyzed and reported in Fig. 2. It was found that the longer extraction time than 27.42 min, the efficiency of extracting phenolic compounds was not improved because of a reduction in the overall amount of phenolic compounds. Furthermore, it was observed that when the extraction temperature exceeded 62.42 °C, there was a decline in the overall amount of phenolic compounds. The reason for this could be the degradation of compounds sensitive to higher temperatures.35,37
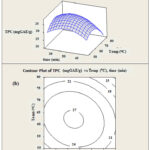 |
Figure 2: (a) 3D and (b) 2D plots illustrate the correlation among total phenolic content in extract samples, ultrasound probe extraction temperatures, and extraction times. |
Optimization and Verification of Predictive Model for Ultrasound Probe Extraction Process
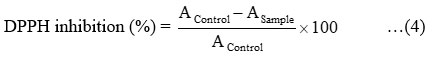
The preliminary experiments determined the ideal processing conditions that maximize the yield of both anthocyanins and phenolic compounds. A desirability function corresponding to two simultaneous response variables as, anthocyanin and phenolic compound content, was used because the content of these response variables was affected by a factor combination of extraction temperatures and times. Consequently, the synergetic effect of various extraction process factors on the overall production of total anthocyanins and phenolic compounds could be fully investigated. The obtained results are presented in Fig. 3.
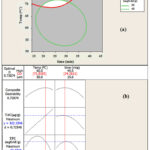 |
Figure 3: (a) Contour plot overlay and (b) Two-dimensional representation of the impact of temperatures and times on the optimum anthocyanin and phenolic compound content in dried corn cobs’ extract |
Fig. 3 shows the stationary point of anthocyanin and phenolic content obtained from dried cob, which was at the highest point according to canonical analysis. The overlaid contour plot was used to illustrate the optimization of anthocyanin and phenolic content simultaneously shown in Fig 3(a). The overall optimal ultrasound probe extraction conditions were found to be an extraction temperature of 71.82 °C for 24.26 min extraction time, predicting that the optimal content of anthocyanins was 322.15 μg C3G/g dried cob, and that of phenolic compounds was 25.07 mg GAE/g dried cob.
The reliability of the experimental method was examined. Then, the program visual analytic method was utilized to model the extraction experiment. The modified extraction condition was an extraction temperature of 70 °C for 25 min extraction time. The experimental result reported an anthocyanin yield of 305.40 μg C3G/g dried cob, and phenolic yield of 25.50 mg GAE/g dried cob. For the model validation, the predicted yield by the response surface model (307.39 μg C3G/g dried cob for anthocyanin yield, and 25.19 mg GAE/g dried cob for phenolic yield) was compared with the experimental result.
Detection and Characterization of Anthocyanins in Extract Obtained from Dried Cobs
Fig. 4 illustrates the results of analyzing the anthocyanin extract obtained from purple waxy corn’s dried cobs using HPLC-MS under optimal extraction conditions. The chromatograms revealed the presence of 8 different anthocyanin components, with peak 1 identified as cyanidin-3-glucoside, and peaks 2 to 8 representing pelargonidin-3-glucoside, peonidin-3-glucoside, cyanidin-3-(6-malonylglucoside), pelargonidin-3-(6-malonylglucoside), peonidin-3-(6-malonylglucoside), cyanidin-3-(6-ethylmalonylglucoside), and petunidin-3-glucoside. The extraction was carried out at an optimal temperature of 70°C for 25 minutes. These components were previously reported by Muangrat.15
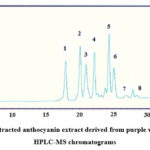 |
Figure 4: Optimally extracted anthocyanin extract derived from purple waxy corn’s dried cobs: HPLC-MS chromatograms |
Additionally, the obtained HPLC-MS chromatographic profiles (Fig. 4) showed similar results as observed by other researchers,38,39 even though these authors have investigated anthocyanin extraction by different methods. Moreno40 found cyanidin-3- glucoside, cyanidin- 3-(3′,6′- dimalonylglucoside), cyanidin-3-(6′-malonylglucoside), pelargonidin-3-glucoside, and peonidin-3-glucoside in the extract samples obtained from kernels of Mexican purple corn. Meanwhile, Vayupharp and Laksanalamai1 identified main anthocyanin components in extracts obtained from Thai purple waxy corn cob, namely cyanidin-3-glucoside, cyanidin-3-(6-ethylmalonylglucoside), cyanidin-3-(6-malonylglucoside), peonidin-3-glucoside, pelargonidin-3-glucoside, pelargonidin-3-(6-malonylglucoside), and peonidin-3-(6-malonylglucoside).
Assessment of Antioxidant Capacity in Extract Derived from Dried Corn Cob
The antioxidant potential of the extract obtained from dried corn cob was assessed using the DPPH free radical scavenging activity assay, with the extraction being carried out under the optimal conditions, and the findings are illustrated in Fig.5, which shows the results of the antioxidant activity.
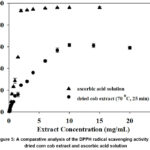 |
Figure 5: A comparative analysis of the DPPH radical scavenging activity in dried corn cob extract and ascorbic acid solution |
Using the optimal extraction conditions, which involved a 20:1 w/w dried cob solvent to sample weight ratio, 1:1 w/w water to ethanol weight ratio, and an extraction temperature of 70 °C for 25 min extraction time, the DPPH assay was employed to determine the antioxidant activity of the dried cob extract. In addition, the results illustrated in Fig. 5 included an evaluation of the antioxidant activity of the dried cob extract using the DPPH IC50 value, which was compared to that of a standard antioxidant solution of ascorbic acid. The dried cob extract had a DPPH IC50 value of 6.41 mg/mL, while the ascorbic acid solution had a value of 1.49 mg/mL. It can be inferred that the dried cob extract had an antioxidant activity which was approximately 4.3 times less than that of the ascorbic acid solution.
Conclusions
An investigation was conducted to extract total anthocyanins and phenolics from purple waxy corn’s dried cobs using ultrasound probe extraction. The results indicated that the extraction temperature and time significantly influenced the content of total anthocyanins and phenolics. To optimize the extraction process, the response surface methodology (RSM) and central composite face-centered design were employed, and it was found that the optimal experimental factors for achieving high content of both total anthocyanins and phenolics were an extraction temperature of 70 °C for 25 min extraction time. Under these optimal conditions, the experimental content of total anthocyanins was approximately 305.40 µg C3G/g dried cob, and that of total phenolics was 25.50 mg GAE/g dried cob. The predicted content of total anthocyanins was 307.39 µg C3G/g dried cob, and that of total phenolics was 25.19 mg GAE/g dried cob. The DPPH IC50 value of the extract obtained under these conditions was 6.41 mg/mL. Overall, these findings demonstrate that ultrasound probe extraction is an effective and worthwhile method for improving extraction efficiency, resulting in higher content of total anthocyanins and phenolics in a shorter time and without using hazardous solvents.
Acknowledgement
The author acknowledges the Faculty of Agro-Industry, Chiang Mai University for supporting equipment.
Conflicts of Interest
The authors have no conflict of interest to declare.
Funding Source
No research funding or grant number has been allocated for this article.
References
- Vayupharp B., Laksanalamai V. Antioxidant properties and color stability of anthocyanin purified extracts from Thai waxy purple corn cob. J Food Nutr Res. 2015; 3(10): 629–636. https://doi.org/10.12691/jfnr-3-10-2
- Simla S., Boontang S., Harakotr, B. Anthocyanin content, total phenolic content, and antiradical capacity in different ear components of purple waxy corn at two maturation stages. AJCS. 2016;10: 675–682.
CrossRef - Muangrat R., Williams P. T., Saengcharoenrat P. Subcritical solvent extraction of total anthocyanins from dried purple waxy corn: Influence of process conditions. J Food Process Preserv. 2017; 41(6): e13252. https://doi.org/10.1111/jfpp.13252
CrossRef - Ramos-Escudero F., Gonzalez-Miret M. L., Garcia-Asuero A. Effect of various extraction systems on the antioxidant activity kinetic and colour of extracts from purple corn. Vitae Columbia. 2012; 19: 41–48.
CrossRef - Lao F., Sigurdson G. T., Giusti, M. M. Health benefits of purple corn (Zea mays L.) phenolic compounds. Compr Rev Food Sci Food Saf. 2017; 16: 234–246. https://doi.org/10.1111/1541-4337.12249
CrossRef - Ghosh S., Sarkar T., Das A., Chakraborty R. Natural colorants from plant pigments and their encapsulation: An emerging window for the food industry. LWT – Food Sci. Technol. 2022; 153: 112527. https://doi.org/10.1016/j.lwt.2021.112527
CrossRef - He J., Giusti M. M. Anthocyanins: natural colourants with health-promoting properties. Annu Rev Food Sci Technol. 2010;1: 163–187. https://doi.org/10.1146/annurev.food.080708.100754.
CrossRef - Harakotr B., Suriharn B., Tangwongchai R., Scott M. P., Lertrat K. Anthocyanins and antioxidant activity in coloured waxy corn at different maturation stages. J Funct Foods. 2014; 9: 109–118. https://doi.org/10.1016/j.jff.2014.04.012
CrossRef - Thapphasaraphong S., Rimdusit T., Priprem A., Puthongking P. Crops of waxy purple corn: A valuable source of antioxidative phytochemicals. Int J Adv Agric Environ Eng. 2016; 3: 73–77. https://doi.org/10.15242/ijaaee.er0116037
CrossRef - Simla S., Boontang S., Harakotr B. Anthocyanin content, total phenolic content, and antiradical capacity in different ear components of purple waxy corn at two maturation stages. Aust J Crop Sci. 2016; 10: 675–682. https://doi.org/10.21475/ajcs.2016.10.05.p7389
CrossRef - Delfanian M., Kenari R. E., Sahari M. A. Influence of extraction techniques on antioxidant properties and bioactive compounds of loquat fruit (Eriobotrya japonica Lindl.) skin and pulp extracts. Food Sci. Nutr. 2015;3: 179–187. https://doi.org/10.1002/fsn3.201
CrossRef - Plaza M., Turner C. Pressurized hot water extraction of bioactives. Trends Anal Chem. 2015; 71: 39–54. https://doi.org/10.1016/j.trac. 2015.02.022
CrossRef - Abdel-Aal E. M., Akhtar H., Rabalski I., Bryan M. Accelerated, microwave-assisted, and conventional solvent extraction methods affect anthocyanin composition from coloured grains. J Food Sci. 2014; 79: 138–146. https://doi.org/10.1111/1750-3841.12346
CrossRef - Demirdoven A., Ozdogan K., Erdogan-Tokatli K. Extraction of anthocyanins from red cabbage by ultrasonic and conventional methods: optimization and evaluation. J Food Biochem. 2015; 39: 491–500. https://doi.org/10.1111/jfbc.12153
CrossRef - Muangrat R., Pongsirikul I., Blanco P. H. Ultrasound assisted extraction of anthocyanins and total phenolic compounds from dried cob of purple waxy corn using response surface methodology. J Food Process Preserv. 2018; 42(2): e13447. https://doi.org/10.1111/ jfpp.13447
CrossRef - Gomes S. V. F., Portugal L. A., dos Anjos J. P., de Jesus O. N., de Oliveira E. J., David J. P., David J. M. Accelerated solvent extraction of phenolic compounds exploiting a Box-Behnken design and quantification of five flavonoids by HPLC-DAD in Passiflora species. Microchem J. 2017; 132: 28–35. https://doi.org/10.1016/ j.microc. 2016.12.021
CrossRef - Pingret D., Fabiano-Tixier A. S., Chemat, F. Degradation during application of ultrasound in food processing: a review. Food Control. 2013; 31: 593–606. https://doi.org/10.1016/j.foodcont.2012.11.039
CrossRef - Paniwnyk L., Cai H., Albu S., Mason T. J., Cole, R. The enhancement and scale up of the extraction of anti-oxidants from Rosmarinus officinalis using ultrasound. Ultrason Sonochem. 2009; 16(2): 287–292. https://doi.org/10.1016/j.ultsonch.2008.06.007
CrossRef - Ferarsa S., Zhang W., Moulai-Mostefa N., Ding L., Jaffrin M. Y., Grimi, N. Recovery of anthocyanins and other phenolic compounds from purple eggplant peels and pulps using ultrasonic-assisted extraction. Food Bioprod Process. 2018; 109: 19–28. https://doi.org/10.1016/j.fbp.2018. 02.006
CrossRef - Sumere B. R., de Souza M. C., dos Santos M. P., Bezerra R. M. N., da Cunha D. T., Martinez J., Rostagno, M. A. Combining pressurized liquids with ultrasound to improve the extraction of phenolic compounds from pomegranate peel (Punica granatum L.). Ultrason Sonochem. 2018; 48: 151–162. https://doi.org/10.1016/j.ultsonch. 2018.05.028
CrossRef - Espada-Bellido E., Ferreiro-González M., Carrera C., Palma M., Barroso C. G., Barbero G. F. Optimization of the ultrasound-assisted extraction of anthocyanins and total phenolic compounds in mulberry (Morus nigra) pulp. Food Chem. 2017; 219: 23–32. https://doi.org/10.1016/j. foodchem.2016.09.122
CrossRef - Das A. B., Goud V. V., Chandan Das C. Extraction of phenolic compounds and anthocyanin from black and purple rice bran (Oryza sativa L.) using ultrasound: A comparative analysis and phytochemical profiling. Ind Crops Prod. 2017; 95: 332–341. https://doi.org/10.1016/ j.indcrop.2016.10.041
CrossRef - Zhu Z., Guan Q., Guo Y., He J., Liu G., Li S., Barba F. J., Jaffrin M. Y. Green ultrasound-assisted extraction of anthocyanin and phenolic compounds from purple sweet potato using response surface methodology. Int Agrophys. 2016; 30: 113–122. https://doi.org/10.1515/ intag-2015-0066
CrossRef - Teng H., Lee W. Y., Choi Y. H. Optimization of ultrasonic-assisted extraction of polyphenols, anthocyanins, and antioxidants from raspberry (Rubus coreanus Miq.) using response surface methodology. Food Anal. Methods. 2014; 7: 1536–1545. https://doi.org/10.1007/s12161-013-9786-2
CrossRef - Chen M., Zhao Y., Yu, S. Optimisation of ultrasonic-assisted extraction of phenolic compounds, antioxidants, and anthocyanins from sugar beet molasses. Food Chem. 2015; 172: 543–550. https://doi.org/ 10.1016/j.foodchem.2014.09.110
CrossRef - Oancea S., Grosu C., Ketney O., Stoia M. (2013). Conventional and ultrasound-assisted extraction of anthocyanins from blackberry and sweet cherry cultivars.Acta Chim. Slov. 2013; 60: 383–389.
- Carrera C., Ruiz-Rodríguez A., Palma M., Barroso C. G. Ultrasound assisted extraction of phenolic compounds from grapes.Anal Chim Acta. 2012;732: 100–104. https://doi.org/10.1016/j.aca.2011.11.032
CrossRef - Aadil R. M., Zeng X. A. Han Z., Sun, D. W. Effects of ultrasound treatments on quality of grapefruit juice. Food Chem. 2013; 141(3):3201–3206. https://doi.org/10.1016/j.foodchem.2013.06.008
CrossRef - Esclapez M. D., Garcia-Perez J. V., Mulet A., Carcel J. A. Ultrasound assisted extraction of natural products. Food Eng Rev. 2011; 3(2): 108–120. https://doi.org/10.1007/s12393-011-9036-6
CrossRef - Bimakr M., Rahman R. A., Taip F. S., Adzahan N. M., Sarker M. Z. I., Ganjloo A. Optimization of ultrasound-assisted extraction of crude oil from winter melon (Benincasa hispida) seed using response surface methodology and evaluation of its antioxidant activity, total phenolic content and fatty acid composition. Molecules. 2012; 17(10): 11748–11762. https://doi.org/10.3390/molecules171011748
CrossRef - Banik R. M., Pandey D. K. Optimizing conditions for oleanolic acid extraction from Lantana camara roots using response surface methodology. Ind Crops Prod. 2008; 27(3):241–248. https://doi.org/10.1016/j.indcrop.2007.09.004
CrossRef - Giusti M. M., Wrolstad R. E. Characterization and measurement of anthocyanins by UV-visible spectroscopy. In: Wrolstad R. E., Schwartz S. J. Current protocols in food analytical chemistry. New York: John Wiley & Sons; 2001: 1–13.
CrossRef - Benzie I. F. F., Strain J. J. The ferric reducing ability of plasma (FRAP) as a measure of antioxidant power: The FRAP assay. Anal Biochem. 1996; 239:70–76. https://doi.org/10.1006/abio.1996.0292
CrossRef - Brand-Williams W., Cuvelier M. E., Berset C. Use of a free radical method to evaluate antioxidant activity. LWT – Food Sci Technol. 1995; 28: 25–30. https://doi.org/10.1016/S0023-6438(95)80008-5
CrossRef - Zhu C. P., Zhai X. C., Li L. Q., Wu X. X., Li B. Response surface optimization of ultrasound-assisted polysaccharides extraction from pomegranate peel. Food Chem. 2015; 177: 139–146. https://doi.org/10.1016/j.foodchem.2015.01.022
CrossRef - Ghafoor K., Choi Y. H., Jeon J. Y., Jo I. H. Optimization of ultrasound-assisted extraction of phenolic compounds, antioxidants, and anthocyanins from grape (Vitis vinifera) seeds. J Agric Food Chem. 2009; 57: 4988–4994. https://doi.org/10.1021/jf9001439
CrossRef - Rostagno M. A., Palma M., Barroso C. G. Ultrasound-assisted extraction of isoflavones from soy beverages blended with fruit juices. Anal Chim Acta. 2007; 597(2): 265–272. https://doi.org/10.1016/j.aca.2007.07.006
CrossRef - Yang Z., Chen Z., Yuan S., Zhai W., Piao X., Piao X. Extraction and identification of anthocyanin from purple corn (Zea mays L.). Int J Food Sci Technol. 2009; 44: 2485–2492. https://doi.org/10.1111/j.1365-2621.2009.02045.x
CrossRef - Yang Z., Zhai W. Optimization of microwave-assisted extraction of anthocyanins from purple corn (Zea mays L.) cob and identification with HPLC–MS. Innov Food Sci Emerg Technol. 2010; 11:470–476. https://doi.org/10.1016/j.ifset.2010.03.003
CrossRef - Moreno Y. S., Sanchez G. S., Hernandez D. R., Lobato N. R. Characterization of anthocyanin extracts from maize kernels. J Chromatogr Sci. 2005; 43(9): 483–487. https://doi.org/10.1093/ chromsci/43.9.483
CrossRef
Scopus Citation(s): 3
Accepted on: 17 Jul 2023
Second Review by: Sofia Agriopoulou
Final Approval by: Mohd Nizam Lani


Web of Science Coverage
Emerging Sources Citation Index (ESCI)
2024 Journal Impact Factor: 1.1
Scopus Journal Metrics
CiteScore 2025: 2.6
CiteScore Details
Sustainable Nutrition: Food Systems, Nutrient Retention, and Public Health Impact
![]()
This journal is a member of, and subscribes to the principles of, the Committee on Publication Ethics (COPE)


