Nutritional and Antinutritional Characteristics of Two Biofortified Bean Varieties Grown in Kenya
Alice W. Ritho*
and Zipporah W. Ndungu Department of Food Science and Technology at Jomo Kenyatta University of Agriculture and Technology (JKUAT), School of Food and Nutrition Sciences (SOFNUS), City Square Nairobi, Kenya.
Corresponding Author E-mail: Allyritho13@gmail.com
DOI : http://dx.doi.org/10.12944/CRNFSJ.11.2.28
Download this article as:
![]()
Introduction: The introduction of biofortified bean varieties has brought attention to their potential as a source of high iron and zinc content. Objective: This study aimed to investigate the nutritional composition and antinutrient content of two biofortified bean varieties in Kenya, namely Angaza and Nyota. Methodology: The Proximate composition and mineral content were analyzed using standard AOAC procedures. HPLC analysis was used to determine the Phytic acid content, and the vanillin-HCL method to analyze tannins. Results:The two bean varieties had no statistically significant difference (P > 0.05) in carbohydrate content, with Nyota beans at 63.21% and Angaza beans at 61.67%. However, Nyota beans exhibited significantly higher protein content (19.97%) compared to Angaza beans (18.88%) with. While Nyota beans had lower crude fiber (3.65%) compared to Angaza beans (4.78%), the variety showed significantly higher crude fat content (3.23%) than Angaza (1.55%). Both varieties had similar levels of crude ash, i.e., Nyota 3.29%, and Angaza 3.35%. Nyota beans demonstrated higher Iron and Zinc levels, i.e., 5.36 mg/100g and 2.77mg/100g respectively, compared to Angaza beans, 5.07 mg/100g Iron and 2.30 mg/100g Zinc. Nyota beans showed significantly lower levels of phytic acid, i.e., 2.53 mg/g and tannins 2.32 mg/g. Conclusions: The study found no significant statistical difference in the nutritional characteristics of the two varieties. However, the Nyota had higher protein, fat and mineral content, and lower levels of phytates and tannins. Thus, this study concludes that Nyota could have potential nutritional advantages over the Angaza variety.
KEYWORDS:Angaza Beans; Antinutrients; Biofortified; Nyota Beans
Introduction
Common bean, Phaseolus vulgaris L., is a staple food in Eastern, Central, and Southern Africa, including Kenya where it is recognized as the third most important food crop and a vital source of dietary protein 1. Beans account for 9% of the national staple food calories and 5% of the total food calories in the diet 2. The National yield of beans per year is estimated to be approximately 600,000Megatonnes placing Kenya as the seventh global producer and the second in East Africa after Tanzania 3. About 40% of the beans produced are marketed while the remaining 60% is reserved for household consumption. The per capita consumption is estimated to be 14kg per year with some regions such as the western region having a consumption of as high as 66kg per year3. Beans are considered as a near-perfect food because of a high protein content, iron, folic acid, and complex carbohydrates 3. However, despite the average iron and zinc concentration in beans being high compared to other major staple crops like wheat, rice, and maize, it is still not sufficient to meet daily requirements in the absence of other iron-rich and zinc-rich foods 4. Additionally, the probable presence of anti-nutrients such as phytic acid inhibits the bioavailability of these trace elements. Phytic acid represents 0.6% to 2.4% of the total dry seed weight 5. Notably, it binds with minerals such as iron and zinc as well as proteins to form stable insoluble complexes which are unavailable for absorption in the human gut. The stable insoluble complexes are observed to contribute to iron and zinc deficiency among vulnerable groups such as children, pregnant women, and terminally ill patients 6.
In 2017, three new breeds of biofortified beans, i.e., Angaza, Faida, and Nyota were released to Kenya for agricultural production. The Nyota variety is derived from the red-speckled common bean variety locally known as the “Nyayo” bean. Developed by the Kenya Agricultural and Livestock Research Organization (KALRO), the Nyayo bean exhibits traits of drought tolerance and disease resistance. Similarly, the Angaza variety was improved from a common bean variety locally known as “Mwitemania.” These varieties are considered to have a higher concentration of bioavailable iron and zinc giving them a significant advantage over the common beans. In part, the introduction of these varieties was to address iron deficiency, prevalent among preschool children and women. According to the Kenya National Micronutrient survey, iron deficiency is approximately 21.8%, 36.1%, and 21.3% for preschool children, pregnant and women of reproductive age respectively7. Biofortified beans also contain a significant amount of proteins, carbohydrates, fiber, and minerals including zinc 7. Iron and zinc deficiencies are responsible for an extensive range of non-specific functional impairments, resulting in metabolic disorders, low disease resistance, and delayed physical and psychomotor development8. Incorporating biofortified beans into the diet can be the key to curbing these deficiency disorders and growth disorders.
Biofortification is the application of agronomic practices, conventional plant breeding, and modern biotechnology to increase nutrient concentration 9. Over the years, the production and utilization of bio-fortified high-iron and zinc bean varieties have gained increased attention globally and most recently in Central, Southern, and Eastern Africa. One of the reasons for the focus is the realization that the biofortification of common beans is a feasible and sustainable approach to address micronutrient deficiency 6. In Rwanda, the biofortified bean varieties have been reported to improve the iron status of women of reproductive age significantly in a span of 4 months 3. Consumption of iron-biofortified beans positively impacted their cognitive performance and reduced iron deficiency according to a study conducted among female students between 18 and 27 years old in Rwanda 6. A report of the study conducted in Rwanda established that biofortified foods break the intergenerational anemia-poor-school performance-low productivity cycle 1.
While the new biofortified bean varieties have been on the market and are readily available for consumption, there has been very limited research on the nutritional and anti-nutritional content of the varieties grown in Kenya. Thus, this study aimed to analyze and compare the nutrient content (carbohydrates, proteins, fiber, fats, and ash), the mineral composition (iron and zinc), and the anti-nutrient content (phytic acid and tannins) of two biofortified bean varieties in Kenya namely Angaza and Nyota. The success of this project holds significant capacity in the use of the beans in value-added products and consequently addresses iron and zinc deficiencies in Kenya.
Materials and Methods
Sample Procurement and Preparation
Two varieties of bio-fortified beans namely Nyota and Angaza were obtained from the Kenya Agricultural and Livestock Research Organization (KALRO) with support from the International Center for Tropical Agriculture (CIAT). The beans had been grown in one season under uniform agronomic conditions and cultural practices on a single farm in Nakuru County.
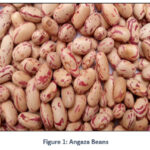 |
Figure 1: Angaza Beans |
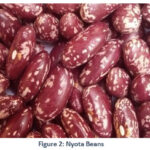 |
Figure 2: Nyota Beans |
The beans were sorted to remove rocks, broken husks, impurities, and any seeds with deformities. The samples were then put in an incubator at 25 °C at 75 % relative humidity for 24 hours to equilibrate the moisture content. The dried samples were then blended into flour with a blender and then sifted through a 50mm mesh sieve. The flour was put in zip-lock bags and stored for further analysis.
Determination of Proximate Composition
Proximate composition was determined using the Association of Official Analytical Chemists (AOAC) standard procedures. Moisture content was determined as per the 925.09 AOAC method by drying the sample in the oven at 105°C until the weight was constant. The moisture content was expressed in terms of percentage. The crude fat was determined using the Soxhlet extraction method while crude protein content was determined by the Kjeldahl method as described by 2003.05 and 990.03 AOAC methods respectively 10. The crude fiber and ash content were quantified using the 978.10 and 923.03 AOAC methods respectively 10. Lastly, the carbohydrate content was estimated by deduction of moisture + ash + protein + fat + alcohol + crude fiber from 100 and expressed as percentage.
Determination of Mineral Content
Two minerals namely iron and zinc were determined using the AOAC method 975.03 (2010). The dried ground bean flour was divided into three replicas weighing 5 g each and charred before ashing in a furnace at 550 ºC for 8 hours. The ash was washed into a 100ml volumetric flask using 0.5N nitric acid. To determine Fe and Zn content, the digest was filtered out, and the filtrate used for analysis in atomic absorption spectrophotometry (AAS) (AA-7000 Shimadzu Japan). Standards were prepared (0.25, 0.5, 1.0, and 1.5 ppm) and the mineral concentrations were calculated based on the calibration curves of the standard solutions.
Determination of Antinutrients
Determination of Phytic Acid
Phytic acid was analyzed using HPLC analysis 11. About 0.5 g sample of the ground bean flour was extracted with 10 ml of 3% H2SO4. The mixture was filtered and the filtrate transferred to a boiling water bath for 5 minutes. Subsequently, 3 ml of FeCl3, i.e., 1mg of Fe per 1 ml of 0.375N HCl was added. The contents were then incubated at 60°C for 45 min to extract phytic acid. Subsequently, the sample was centrifuged at 2500 rpm at room temperature for 10 minutes. The precipitate was then washed using distilled water, centrifuged and the supernatant discarded. The contents were then treated with 3 ml 1.5N Sodium hydroxide and the volume brought to 30 ml using distilled water before being put for 30 to 50 min in a boiling-water bath to coagulate Fe (OH) 3. The sample was then cooled, centrifuged and the supernatant transferred into a 50 ml volumetric flask. The mixture was microfiltered and injected into the HPLC (Shimadzu CBM 20A plus, Japan) which was fitted with a C-18 (µm) column that had an oven temperature of 30 °C. A solution of 0.005N sodium acetate in distilled water was used in the mobile phase at a flow rate of 1µl/min. Inositol hexaphosphoric acid (sodium phytate) was used to make the standard solution.
Determination of Tannins
The tannin content was determined using the vanillin-hydrochloric acid procedure10. Approximately 0.5 g grounded bean flour was extracted for 20 minutes in 10 ml 1% HCl in methanol at 30 °C in a water bath. The mixture was centrifuged at 4500 rpm for 4 min and the supernatant filtered for further testing. Approximately 1ml of the aliquot of each bean extract was dispensed in test tubes and then incubated in a 30 °C water bath for 5 mins. The vanillin-HCL reagent was prepared by mixing vanillin and HCL acid at a ratio of 1:8. The reagent was added to the bean extracts and incubated at 30 °C for 20 min. The absorbance was then measured at 500 nm using a UV-visible spectrophotometer (Shimadzu, UV mini-1240, Japan). Final absorbance was used to develop standard curves using catechin at concentrations that range from 0-1µg/ml except for blank and the tannin content reported as mg of catechin equivalent (CE) per gram of the sample (mgCE/g).
Data Analysis
The data obtained were analyzed statistically using the STATA for Windows version 12.0. 2011. The results were presented as mean ± the standard deviation (SD). The independent t-test for two-mean comparison was used to determine the statistical significance at p<0.05.
Results and Discussion
Proximate Composition of Bio-fortified bean varieties
Table 1 shows the proximate composition of both the Nyota and Angaza bean varieties. The moisture, protein, crude fat, crude fiber, carbohydrates, and ash values were reported using the percentage of dry weight.
Table 1: Proximate composition (% dry weight) of raw Nyota and Angaza bean varieties
|
Variety |
Moisture (%) |
Protein (%) |
Fat (%) |
Fiber (%) |
Ash (%) |
CHO (%) |
|
Nyota |
8.33± 0.07* |
19.97 ± 0.05* |
1.55± 0.03* |
3.65 ± 0.01* |
3.29 ± 0.16 |
63.21 ± 0.68 |
|
Angaza |
8.09 ± 0.05* |
18.88 ± 0.35* |
3.23 ± 0.18* |
4.78 ± 0.10* |
3.35 ± 0.24 |
61.67 ± 1.48 |
*Statistically significant at (P<0.05)
The moisture content of Nyota beans (8.33 %) and Angaza beans (8.09 %) exhibited a statistically significant difference (P < 0.05). These findings are consistent with the results of previous studies conducted on various common bean varieties 12. However, the moisture content observed in the current study was lower compared to the values reported in a study conducted in Brazil on biofortified beans, which ranged between 13.89 % and 15.62 % 8. It is important to note that the significant difference in moisture content persisted even after subjecting the beans to conditioning in an incubator at 25 °C and 75 % relative humidity. The low moisture content falls within the safe range (8-9 %) for long-term preservation or below 12 % for short-term storage. Furthermore, low moisture content contributes to extended shelf life and facilitates ease of transportation 13. It should be emphasized that moisture content exceeding 13 % can negatively impact the quality of the beans in terms of flavor and texture, thus requiring consumption within six months 10.
The protein analysis revealed that Nyota beans exhibited a significantly (p<0.05) higher crude protein content (19.97 %) compared to Angaza beans (18.43 %). The protein content of Nyota beans fell within the range reported for common beans grown in Ethiopia, which varied between 17.96 % and 25.73 % 14, as well as improved bean varieties in Ethiopia (17.96 % – 22.07 %) 15. However, these values were slightly lower than the protein range of 25.3 % – 30.2 % reported in a study on the characteristics of common beans in Kenya 16. Furthermore, the protein content was also lower than the range of 23.38 % to 31.59 % reported for biofortified beans grown in Brazil 7. Despite beans not possessing a comprehensive range of amino acids and having anti-nutrients that may affect digestibility and absorption, being plant-based protein sources offer advantageous alternatives to animal-based proteins 17. Foods rich in protein play a crucial role in supporting the growth and development of children and are beneficial additions to the diets of pregnant and lactating mothers. The Nyota beans reported a carbohydrate content of 63.21 %, while the Angaza beans had a slightly lower content of 61.67 %, showing no significant difference (P > 0.05) between the two varieties. These values were higher compared to the carbohydrate content reported, with ranges from 54.34 % to 60.04 % in improved beans grown in Kenya 18. Furthermore, they were higher than the carbohydrate content reported for common beans grown in Ethiopia (56.53 % to 61.56 %) 15, and 27.80 % to 34.78 % reported by Brigide et al. for biofortified beans in Brazil 7. However, the values were comparable to the carbohydrate content range of 58.21 % to 66.36 % observed in improved bean varieties grown in Ethiopia 19. The high carbohydrate content of the biofortified beans (Angaza and Nyota) indicates that they serve as a significant source of energy.
The crude fiber content showed a statistically significant difference (P<0.05) between Angaza beans (4.78 %) and Nyota beans (3.65 %). These findings align with previous studies, which reported a fiber content range of 3.31 % to 4.31 % for other improved beans cultivated in Kenya 18. Comparatively, the fiber content of the Nyota and Angaza beans was slightly lower than that of improved beans grown in Ethiopia, which ranged between 4.66% and 5.95 % 20. Another study conducted on common beans in Ethiopia reported a fiber range of 4.07% – 7.33 % 14. However, contrasting results were observed in studies by 7, conducted in Brazil, where fiber content ranged from 16.81 % to 40.63 % 7. Although the crude fiber content in the studied beans was lower than that of common beans grown in Kenya (5 % – 7 %) 21, it still holds significance in terms of improving metabolic risk factors, such as blood pressure control and food glycemic index. Additionally, it plays a crucial role in promoting a healthy gut-bacterial environment.
The Nyota beans demonstrated a crude fat content of 1.55 %, whereas the Angaza beans had a slightly higher content of 3.23 %. These values fall within the range of crude fat content commonly observed in beans, which typically ranges between 2and 3 % 21. They are also comparable to reports on improved beans grown in Ethiopia, where the crude fat content ranged from 1.27 % to 3.02 % 15. In a study conducted by 20, common beans were found to have a lipid content of 2.20 % to 5.03 % 20. Relatively speaking, these values may be considered low when compared to other macronutrients in beans. However, it is important to note that beans still serve as an excellent source of energy, and the fat content plays a role in facilitating the transport of fat-soluble vitamins, acting as an insulator, and protecting internal tissues.
Upon ashing, the Nyota bean variety had an ash content of 3.28 %, while Angaza beans demonstrated 3.35 %. However, there was no statistically significant difference observed between the two samples (P>0.05). Notably, these ash content values fell within the range reported for common beans in a study conducted by 21, where the ash content was found to be 4-5 % 21. Furthermore, the ash content of the biofortified beans showed comparability to the improved beans analyzed in a study by 18, which reported an ash content range of 3.98 % to 4.12 % 18. Remarkably, these values also fell within the ash content range of common beans, as reported by Celmeli et al. in 2018, which was found to be 3.8 % to 4.5 % 20. The ash content analysis indicated the presence of valuable mineral elements that are essential in our diet.
Mineral Content of Angaza and Nyota
Table 2 shows the mineral composition of Nyota and Angaza Bean Varieties. From the analysis, the Nyota bean variety had a higher iron content of 5.36 mg/100g which was statistically higher (P>0.05) than that of the Angaza bean variety which had an iron content of 5.07 mg/100g. These were comparable to common beans with an iron content ranging between 1.88 –and 8.24mg/100g 22. These findings exhibit similarity to the iron content reported by 15, 4 – 10 mg/100g 15. Additionally, they fall within the range of iron content observed in common beans studied by 14, which ranged from 0.02 to 36.6 mg/100g 14. However, it should be noted that these iron content values are lower than those found in common bean varieties grown in Kisii, Kenya, which ranged from 6.99 to 10.71 mg/100g 26. They are also slightly lower than the Iron content of common beans analyzed in Brazil, which ranged from 5.31 to 7.47 mg/100g 20. Glahn et al. in 2020 reported a range of 5.5-9.4 mg/100g iron content for 18 East African biofortified bean varieties recently released 23.
Table 2: Mineral composition of Angaza and Nyota bean varieties (mg/100g)
|
Varieties |
Fe (mg/100g) |
Zn (mg/100g) |
|
Raw Angaza |
5.07± 0.49* |
2.30 ± 0.28 |
|
Raw Nyota |
5.36 ± 0.17* |
2.79 ± 0.66 |
Biofortification breeding strategies typically aim to enhance iron content by 50-100 % from the existing baseline of 5.0-5.5 mg/100g for most common beans 9. Based on the aforementioned studies, there is still potential for further improvement in iron content. It is important to note that factors such as agronomic practices, genotype, and environmental conditions can also impact iron content 9.
The zinc content of Angaza and Nyota beans was 2.30 mg/100g and 2.77 mg/100g respectively (P>0.05). These findings showed similarity to the zinc content observed in common beans grown in the Kisii district, Kenya, which ranged from 1.74 to 9.47 mg/100g 26. Another study focusing on biofortified beans reported a zinc content range of 2.13 to 2.68 mg/100g 18. However, these values were lower than the zinc content found in improved beans in Brazil, which ranged from 3.38 to 4.31 mg/100g 22. The prevalence of deficiency in both iron and zinc is a growing concern in the field of human nutrition, especially among vulnerable populations like preschool children, pregnant and lactating mothers, and the elderly. Biofortification of common beans aims to address this concern by enhancing the Zinc concentration by 50% from a baseline value of 1.7 mg/100g 8.
Antinutrient Content of Angaza and Nyota
Table 3 shows the Phytic acid and tannin content of Nyota and Angaza bean varieties. The phytic acid content of the bean varieties, specifically 2.70 mg/g for Angaza and 2.53 mg/g for Nyota and Angaza beans, did not show a significant difference (P > 0.05). These values align with the findings reported for phytic acid levels ranging from 2.23 mg/g to 2.74 mg/g in Kenyan bean varieties 21. However, these values were lower than those reported by 18, who observed a wider range of 7.60 mg/g to 11.70 mg/g 18. Phytic acid is a major inhibitor of mineral bioavailability in beans, second only to polyphenols 5. It strongly interferes with iron absorption and can contribute to iron deficiency. Research indicates that phytic acid serves as the primary storage form of phosphorus in bean seeds, and interestingly, reducing its levels does not have any negative impact on plant yield or overall health 5. Hence, it is crucial for breeding programs to prioritize the development of bean varieties with low levels of phytic acid. By doing so, the potential benefits of biofortification can be maximized, leading to improved nutritional outcomes.
Table 3: Anti-nutrient content of Angaza and Nyota bean varieties
|
Varieties |
Phytic acid (mg/g) |
Tannin (mg CE /g) |
|
Angaza |
2.70 ± 0.11 |
2.81 ± 0.16 |
|
Nyota |
2.53 ± 0.01 |
3.21 ± 0.23 |
There was no significant difference (P > 0.05) in the tannin concentration between the two bean varieties, with Angaza exhibiting a concentration of 2.81 mg/g and Nyota having a concentration of 3.21 mg/g. These results align with the tannin levels found ini33 mg CE/g to 3.30 mg CE/g. However, the tannin concentrations in the studied varieties were lower than those observed in biofortified beans analyzed by 18, which ranged from 4.08 mg CE/g to 4.36 mg CE/g 18. On the other hand, the tannin levels were slightly higher than those in non-biofortified common beans, which typically have a tannin content of 0.0 % to 2.0 % 24. Tannins are antinutrients that function as enzyme inhibitors, reducing the bioavailability and nutritional quality of proteins. Therefore, it is important to diversify the diet to ensure an adequate intake of bioavailable proteins 25. The low levels of phytic acid and tannins in the studied bean varieties indicate that there will be no significant impact on protein digestibility and mineral bioavailability making it a better alternative source of proteins.
In the context of nutrient content classification for common beans, limited information is available regarding the nutrient labeling of Kenyan bean varieties. However, it is crucial to classify the mineral content of these beans based on the baseline mineral content of the common bean varieties from which they were developed. Considering that the baseline iron content in common beans, is generally reported to be around 5.0 to 5.5 mg/100g 9 and the zinc content, is typically around 1.7 mg/100g 8, Angaza and Nyota beans can only be classified as high-zinc bean varieties as their iron content still lies within the common bean iron content.
Conclusion
In conclusion, the analysis revealed no significant difference in the nutritional composition between Angaza and Nyota beans. The proximate composition of both beans remained well within the nutrient composition of other common beans studied in the literature. On mineral analysis, the iron content, exhibited a slight but significant variation, with Nyota beans demonstrating a higher concentration compared to Angaza beans. However, based on the aforementioned studies in the discussion, there is still potential for further improvement in iron content. Both bean varieties displayed similar levels of antinutrient levels. It is important to note that factors such as agronomic practices, genotype, and environmental conditions can also impact mineral content. These findings thus emphasize the need to explore and optimize other contributing factors that could potentially enhance the nutritional profile of these bean varieties. It is highly recommended that further research is undertaken to validate the efficacy of other improved bean varieties, fostering collaborative partnerships across multiple sectors for a comprehensive approach.
Acknowledgment
The authors acknowledge and thank the Department of Food Science and Technology at the Jomo Kenyatta University of Agriculture and Technology for providing materials for laboratory analysis. The authors gratefully acknowledge VLIR-UOS financial support through the Jomo Kenyatta University of Agriculture and Technology’s ‘Legume Centre of Excellence for Food and Nutrition Security (LCEFoNS).
Conflicts of Interest
The author declares no conflicts of interest and declares sole responsibility for the contents of the manuscript.
Funding Sources
The VLIR-UOS funded this project through the Jomo Kenyatta University of Agriculture and Technology’s ‘Legume Centre of Excellence for Food and Nutrition Security (LCEFoNS),’ grant number KE2017IUC037A101.
References
- Petry N, Boy E, Wirth JP, Hurrell RF. Review: The potential of the common bean (phaseolus vulgaris) as a vehicle for iron biofortification. Nutrients. 2015;7(2):1144-1173. doi:10.3390/nu7021144
CrossRef - Mohajan H, Mohajan HK. Cite This Article: Haradhan Kumar Mohajan. American Journal of Food and Nutrition. 2014;2(2):28-38. doi:10.12691/ajfn-2-2-3
CrossRef - Wagara IN, Kimani & PM. Resistance of Nutrient-Rich Bean Varieties to Major Biotic Constraints in Kenya. Vol 8.; 2007.
- Tako E, Glahn RP. White beans provide more bioavailable iron than red beans: Studies in poultry (Gallus gallus) and an in vitro digestion/Caco-2 model. International Journal for Vitamin and Nutrition Research. 2010;80(6):416-429. doi:10.1024/0300-9831/a000028
CrossRef - Hummel M, Talsma EF, Taleon V, et al. Iron, zinc and phytic acid retention of biofortified, low phytic acid, and conventional bean varieties when preparing common household recipes. Nutrients. 2020;12(3). doi:10.3390/nu12030658
CrossRef - Murray-Kolb LE, Wenger MJ, Scott SP, Rhoten SE, Lung’aho MG, Haas JD. Consumption of iron-biofortified beans positively affects cognitive performance in 18-to 27-Year-Old Rwandan female college students in an 18-week randomized controlled efficacy trial. Journal of Nutrition. 2017;147(11):2109-2117. doi:10.3945/jn.117.255356
CrossRef - Brigide P, Canniatt-Brazaca SG, Silva MO. Nutritional characteristics of biofortified common beans. Food Science and Technology (Campinas). 2014;34(3):493-500. doi:10.1590/1678-457x.6245
CrossRef - King JC, Brown KH, Gibson RS, et al. Biomarkers of nutrition for development (BOND)-Zinc Review. Journal of Nutrition. 2016;146(4):858S-885S. doi:10.3945/jn.115.220079
CrossRef - Stangoulis JCR, Knez M. Biofortification of major crop plants with iron and zinc – achievements and future directions. Plant Soil. 2022;474(1-2):57-76. doi:10.1007/s11104-022-05330-7
CrossRef - Herald TJ, Gadgil P, Perumal R, Bean SR, Wilson JD. High-throughput micro-plate HCl-vanillin assay for screening tannin content in sorghum grain. J Sci Food Agric. 2014;94(10):2133-2136. doi:10.1002/jsfa.6538
CrossRef - Camire AL, Clydesdale FM. Analysis of Phytic Acid in Foods by HPLC.
- KimatuetalAug201434-116-1-PB1.
- Kyomugasho C, Kamau PG, Aravindakshan S, Hendrickx ME. Evaluation of storage stability of low moisture whole common beans and their fractions through the use of state diagrams. Food Research International. 2021;140. doi:10.1016/j.foodres.2020.109794
CrossRef - Minuye M, Bajo W. Common beans variability on physical, canning quality, nutritional, mineral, and phytate contents. Cogent Food Agric. 2021;7(1). doi:10.1080/23311932.2021.1914376
CrossRef - Shimelis EA, Rakshit SK. Proximate composition and physicochemical properties of improved dry bean (Phaseolus vulgaris L.) varieties grown in Ethiopia. LWT. 2005;38(4):331-338. doi:10.1016/j.lwt.2004.07.002
CrossRef - Ojij N, Kimura T, KOAZEl H. 6 ( I ).; 2000.
- Hertzler SR, Lieblein-Boff JC, Weiler M, Allgeier C. Plant proteins: Assessing their nutritional quality and effects on health and physical function. Nutrients. 2020;12(12):1-27. doi:10.3390/nu12123704
CrossRef - Jepleting N, Sila DN, Orina IN. Nutritional Composition and Antinutrient to Mineral Molar Ratios of Selected Improved Common Beans Grown in Kenya. Current Research in Nutrition and Food Science. 2022;10(3):1230-1239. doi:10.12944/CRNFSJ.10.3.35
CrossRef - Abera Ketema D, Gebeyehu HR, Gebreyes BG. Evaluation of Proximate, Mineral and Anti-Nutritional Composition of Improved and Released Common Bean Varieties in Ethiopia. Vol 6. www.noveltyjournals.com
- Celmeli T, Sari H, Canci H, et al. The nutritional content of common bean (phaseolus vulgaris l.) landraces in comparison to modern varieties. Agronomy. 2018;8(9). doi:10.3390/agronomy8090166
CrossRef - Anino C, Onyango AN, Imathiu S, Maina J, Onyangore F. Chemical composition of the seed and ‘milk’ of three common bean (Phaseolus vulgaris L) varieties. Journal of Food Measurement and Characterization. 2019;13(2):1242-1249. doi:10.1007/s11694-019-00039-1
CrossRef - Carvalho LMJ, Corrêa MM, Pereira EJ, et al. Iron and zinc retention in common beans (Phaseolus vulgaris L.) after home cooking. Food Nutr Res. 2012;56:1-6. doi:10.3402/fnr.v56i0.15618
CrossRef - Glahn R, Wiesinger J, Lung’aho M. Iron Biofortification of the Common Bean: Assessment of Bean Iron Concentration and Iron Bioavailability from Markets and Breeder Collections in East Africa.
https://academic.oup.com/cdn/article/4/Supplement_2/1803/5845327
CrossRef - Kilonzi SM, Makokha AO, Kenji GM. Physical characteristics, proximate composition and anti-nutritional factors in grains of lablab bean (Lablab purpureus) genotypes from Kenya. J Appl Biosci. 2017;114(1):11289. doi:10.4314/jab.v114i1.2
CrossRef - Reddy NR, Pierson MD, Sathe SK, Salunkhe DK. &Dry Bean Tannins: A Review of Nutritional Implications t.
- Lunjalu J O. Variability of Iron, Zinc and protein concentration in common bean genotypes. erepository.uonbi.ac.ke. Published 2007. Accessed May 5, 2023. http://erepository.uonbi.ac.ke/handle/11295/ 19748
Accepted on: 11 Jul 2023
Second Review by: Chan Sook Wah
Final Approval by: Dr. Norazmir Md Nor


Web of Science Coverage
Emerging Sources Citation Index (ESCI)
2024 Journal Impact Factor: 1.1
Scopus Journal Metrics
CiteScore 2025: 2.6
CiteScore Details
Sustainable Nutrition: Food Systems, Nutrient Retention, and Public Health Impact
![]()
This journal is a member of, and subscribes to the principles of, the Committee on Publication Ethics (COPE)


