Intelligent and Active Packaging System Application in Evaluating and Maintaining the Tuna (Thunnus Sp.) Fillets’ Quality at Cold Temperature
Rindam Latief*
, Muspirah Djalal, Indah S. Ramadhani and Andi H. Julyaningsih Department of Agricultural Technology, Faculty of Agriculture, Hasanuddin University, Makassar, Indonesia.
Corresponding Author E-mail: rindam_latief@unhas.ac.id
DOI : http://dx.doi.org/10.12944/CRNFSJ.11.2.14
Download this article as:
![]()
This study developed intelligent and active packaging combined for tuna fillets. The purposes of this study were to determine the colour change of packaging indicator labels and the effectiveness of edible coatings (citronella oil concentrations of 0%, 0.5%, and 1%), as well as to establish a correlation between the colour analysis values of intelligent indicator and observed spoilage criteria of tuna stored at refrigerated temperatures (4±1°C). The parameters tested included the determination of Total Volatile Bases Nitrogen, Total Plate Count, pH, and sensory analysis. The test was carried out every three days for 18 days, with two replications. The findings indicated that the intelligent indicator label (Bromothymol blue + Methyl Red (1:1)) changed colour from deep red to yellow and then green. Edible coating with 0.5% citronella oil gave the best result in this study. The correlation between the colour analysis of the intelligent indicators and the parameters of the fish spoilage test is positive, suggesting a consistent trend pattern in determining the degree of decay in tuna fillets. Correlation coefficient values vary from 0.98 to 0.99, showing a significant correlation. The combination of intelligent and active packaging in a single packaging system allows for monitoring tuna's quality while increasing its shelf life.
KEYWORDS:Active Packaging; Edible Coatings; Intelligent Packaging; Tuna Fillets
Introduction
Fish is an excellent source of protein, omega-3 long-chain unsaturated fatty acids, and micronutrients such as vitamins A, D, and B, as well as iron, zinc, selenium, and iodine 1,2. Fish with a variety of nutritional qualities are an essential source of food for humans since they can meet the body’s dietary needs. According to the Food Agriculture Organization (FAO), fish provides 17% of the animal protein consumed by the world’s population 3,4. However, fish is a highly susceptible commodity to deterioration 5. Freshly caught fish undergo quality changes due to autolysis, bacterial activity, and lipid oxidation6,7. This makes good handling necessary to maintain the quality of fishery products and prolong its shelf life. Thus, the nutritional value of fish is preserved until the product reaches the consumer. In general, changes in fish quality can be detected through changes in sensory attributes such as aroma, texture, and colour. However, this is limited by the ability of consumers to identify quality attributes related to the level of freshness of fish.
One technology that is able to evaluate the quality of fish during storage and make it easier for consumers to determine the level of freshness of fish is intelligent packaging. Intelligent packaging is a type of packaging technology designed to provide information about the quality level of food ingredients or products 5. Intelligent packaging with food quality indicators (FQI) is able to monitor the occurrence of quality degradation or product damage through colour changes that occur due to chemical or biological reactions in packaged food products. The indicator’s colour change is caused by pH changes as a result of the production of volatile amine molecules 8. This intelligent packaging can assist reduce the risk of product damage-related loss and provide a more precise evaluation of the product’s condition 9.10.
Applications of intelligent packaging can be integrated with active packaging that further called smart packaging. Active component in packaging might extend the food shelf life and improve food safety as well as maintain the packaged item’s quality 6,11. Active packaging technology is created by including certain components that can control the release or absorption of certain substances and control the environmental conditions of the packaged food or food ingredients into the packaging system 12. Manufacturing active packaging can be done in a variety of methods, including through the extrusion process, by dissolving the active component into the solvent, by adding the active component to edible coatings, or by mixing the active component with fillers in paper manufacturing 13-18. The active ingredients used could be chemicals capable of absorbing oxygen, ethylene, moisture, carbon dioxide, taste/odor, or substances capable of releasing carbon dioxide, as well as antimicrobials, antioxidants, and flavors 5,19.
Active packaging and intelligent packaging play an important role as technology enables novel solutions for preserving and extending the shelf life of food products 12. Research on intelligent packaging and active packaging separately has been applied extensively to fishery products. However, research on the application of intelligent and active packaging combined in one system is still limited, particularly for fisheries commodities with low temperatures for marketing purposes. Riyanto et al. (2014) utilized an intelligent indicator to determine the freshness of Double whip threadfin bream fillet (Nemipterus nematophorus) 20. Hakim et al. (2016) applied acetic acid and edible coating as active packaging on red tilapia fillets stored in cold temperatures (4±1°C) 21. Yolanda et al. (2020) combined active and intelligent packaging on Tuna fillet stored at room temperature. Yolanda et al. (2020) found that with 15 % of garlic extract addition to the packaging system, the Tuna fillet can only last up to 10 hours 18. Thus, in this research, we tried to extend the shelf life of tuna fillet by applying different kinds of active compound and also with cool storage.
Based on the explanation above, this study was conducted to investigate the feasibility of combining intelligent and active packaging in a single packaging device for fisheries commodities, particularly tuna. In this study, an edible coating containing citronella oil was used as an active packaging material capable of inhibiting microbial growth and providing a selective barrier to gas and water vapor transfer. This study aimed to determine the colour change profile of intelligent indicators and the effectiveness of edible coatings as active packaging applied on tuna fish fillets, as well as to establish the correlation between the colour analysis measurements of the intelligent indicators and various parameters of the tuna fish spoilage test when stored under refrigeration at cold temperatures (4±1°C).
Materials and Methods
Materials
Fresh tuna was obtained from the Paotere fish auction in Makassar City. Other materials used were filter paper (Whatman No. 1), bromothymol blue (BTB, Arkitos), methyl red (MR, Arkitos), nutrient agar (NA, Merck), ethanol (95%), glacial acetic acid, commercial sago starch (Alini), pure essential citronella oil (food-grade, M&H FARM), food-grade CMC (Foodchem, E466), glycerol (Merck, CAS No: 56-81-5), and aquadest.
Indicator solutions production
The indicator solution was made in a 1:1 ratio using methyl red (MR) and bromothymol blue (BTB) at a concentration of 0.1 % (w/v). After that, the indicator solution pH was adjusted to 2.55 using glacial acetic acid 22.
The production of the label of intelligent indicator
Uniformly, the Whatman paper no. 1 was cut to a size of 2 × 4 cm square and then immersed in 10 ml of the MR + BTB solution (1:1) pH 2.55 at room temperature (28 ± 2°C) for 12 hours. Following that, the label was then dried using an electric dryer and stored in a sealed container 22.
Edible coating production as active packaging
The edible coating is made by homogenizing sago starch with demineralized water at a 1:10 ratio. Following that, a filter cloth was used to filter the starch solution. After heating the starch solution to 55°C, 10% glycerol and citronella oil were added (with different ratios based on the treatment applied). Following that, it is swirled and heated to a temperature of 70°C. When the temperature was consistent at 70°C, the starch solution was then added with 1% CMC to create an edible coating.
Intelligent and active packaging application on tuna fish fillet
Fresh tuna fish was prepared in a sterile environment to obtain tuna fillets with a size of ±60g/package. Tuna fish fillets were submerged for 1 minute in the coating solution before being dried with a hairdryer. A coated tuna fish fillet was placed in a Styrofoam container. Following that, the label was placed in a plastic wrap then the plastic wrap was applied as the Styrofoam cover.
Colour quantification of indicator label
The colour of the indicator label was quantified with a chromameter (Minolta CR-300); the indicator’s colour is determined by attaching the chromameter to the indicator label that is placed in the package. After that, the tool will display the values of L* (brightness), a* (chromatic colour red green), and b* (blue-yellow chromatic colour). Then, the colour value of the intelligent indicator label is obtained by calculating the hue value with the formula:
pH measurement
Prior to pH measurements, the pH meter (HORIBA LAQUAtwin) was calibrated. The pH of the sample was determined by dissolving 2 g of refined tuna fish fillet in 18 ml of demineralized water. Following homogenization, the sample’s pH was determined by dropping it on the flat sensor. The pH meter will interpret the pH value of the sample, which is marked with the test complete indicator symbol on the monitor.
Total Volatile Bases Nitrogen (TVBN) measurement
TVBN test was carried out based on SNI 2354.8:2009. 1 g of fine tuna fish was placed in a container along with 3 ml of a 7% TCA solution. The sample was homogenized for approximately 10 minutes and then filtered to obtain the filtrate. Following that, 2 ml of boric acid (H3BO3 2%) was added to the inner side of the Conway cup, and 1 ml of the sample filtrate was added to the outer side. Add 1 ml of saturated K2CO3 solution to the outside half of the Conway dish prior to sealing. Circularly move the Conway cup until the two liquids in the outer Conway cup are combined. After 24 hours at room temperature, the colour indicator produced from a combination of methyl red and bromothymol blue (2:1) was applied in a concentration of up to 2 drops to the inner cup of Conway and then titrated with 0.02 N HCl until a pink hue developed. As with the blank, 1 ml of 7% TCA solution was substituted for the filtrate. The TVBN value was calculated using the equation 23:
Explanation
Vsample = HCl titration volume on the sample (ml)
Vblank = HCl titration volume on blank (ml)
N HCl = Normality of HCl
14.007 = atomic weight of nitrogen
Sample mass = mass of analyzed sample
The total bacterial count of tuna fish (TPC method)
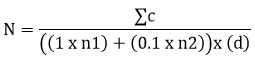
The TPC analysis on fish fillet samples was performed based on SNI 2331.3: 2015. 10 g mashed tuna was added to an Erlenmeyer holding 90 ml sterile physiological solution and homogenized using a vortex. The procedure was represented as the initial dilution (10-1). Serial dilution was performed until 10-6. A total of 1 ml of suspension was obtained from dilutions 10-2 to 10-6 using a sterile pipette and then placed on duplicate sterile petri dishes. Then it was added with 15 ml of warm Nutrient Agar (NA) medium and incubated for 2 x 24 hours at a temperature of 34-36°C. A petri dish containing between 30-300 colonies were counted. Additionally, the number of colonies per cup was determined using the TPC technique in accordance with equation 24:
Explanation:
N = Number of colonies formed, colony per ml or colony per gram
Σc = Number of colonies on all petri dishes counted
n1 = Number of petri dishes on the first dilution counted
n2 = Number of petri dishes on the second dilution counted
d = The First dilution counted
Sensory analysis of Quality Index Method (QIM)
Sensory analysis of tuna fish fillets during storage with edible coating treatment and different concentrations of citronella oil was carried out by twenty untrained panelists. Attributes assessed include general appearance, texture, slime, and aroma. The rating scale for each parameter is 0-3, with the criteria of 0 being excellent quality and 3 being low quality (Table 1). The value of each attribute is the sum of the values of all its parameters. The sum of all attribute values is the total score of the Quality Index (QI) 25.
Table 1: Description of the fish quality attribute values.
|
Rated attributes |
Value Description |
||||
|
0 |
1 |
2 |
3 |
||
|
Slimy |
Not slimy |
Slightly slimy |
Slimy |
Very slimy |
|
|
Texture |
Compact/elastic |
Slightly soft |
Soft |
Very soft |
|
|
Colour |
Dark red |
Red |
Brown |
Dark Brown/Grey |
|
|
Aroma |
Neutral |
Slightly fishy |
Fishy |
Rotten fish smell |
|
|
General acceptance |
Like |
Slightly like |
Unlike |
Very unlike |
|
Data analysis
Each data obtained from this study was examined using analysis of variance (ANOVA) with two replications, and the differences between treatments were further evaluated using Duncan’s test. The software used to calculate is Microsoft Excel 2010 and SPSS version 16. The correlation between the intelligent indicator label parameters is compared with the data for each tuna fillet decay parameter through the Pearson Correlation test using SPSS version 16 software and displayed in a graph with the Sigma Plot software version 12.0.
Results and Discussion
Response to colour change indicator label
During storage of packaged tuna fish fillets at cold temperatures, there is a change in the colour of the indicator label in response to changes in the quality of packaged fish fillets. The indicator label is dark red when the tuna fillet is still fresh and continues to change colour until it turns yellow, which indicates the tuna fish fillet has started to deteriorate.
Intelligent indicator labels are expected to be able to evaluate the condition of the product through a significant change in colour (hue value) during storage. In this study, the colour change from red to green was obtained. The freshness of fish fillets can be seen from the colour on the intelligent indicator label. The red colour indicates that the fish is in its fresh condition. Fish should be consumed immediately when the label is orange to yellow, while green indicates that the fish is rotten and no more fit for consumption.
The graph of the colour change profile of the intelligent indicator label for various edible coating treatments can be seen in Figures 1, 2, 3, and 4.
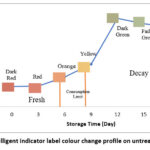 |
Figure 1: Intelligent indicator label colour change profile on untreated samples. |
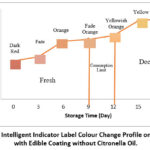 |
Figure 2: Intelligent Indicator Label Colour Change Profile on Samples with Edible Coating without Citronella Oil. |
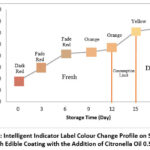 |
Figure 3: Intelligent Indicator Label Colour Change Profile on Samples with Edible Coating with the Addition of Citronella Oil 0.5%. |
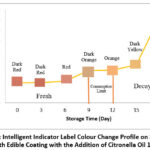 |
Figure 4: Intelligent Indicator Label Colour Change Profile on Samples with Edible Coating with the Addition of Citronella Oil 1%. |
Colour measurement in this study uses a chromameter tool that is able to express colour in numerical form. The resulting data is expressed as the value of L, a, and b*. These three values are international standards for colour measurement26. According to the results obtained, the values of L, a, and b will be converted to hue values. Hue value is a hue that could be captured by the human senses so that it gives a difference from one colour to another. The hue value is a figure of the 360° axis, which is divided into four quadrants. Each quadrant represents a colour division consisting of red-yellow in quadrant I, yellow-green in quadrant II, blue-green in quadrant III, and blue-purple in quadrant IV 27. The Hue value of the intelligent indicator label is presented in Table 2.
Table 2: Hue Value (°) of Intelligent Indicator Label.
|
Storage time (day) |
Treatment |
Average |
|||
|
Untreated |
Edible coating without citronella oil |
Edible coating + citronella oil 0.5% |
Edible coating + citronella oil 1% |
||
|
0 |
38.20 ± 0.28 |
38.20 ± 0.28 |
38.20 ± 0.28 |
38.20 ± 0.28 |
38.20 ± 0.00a |
|
3 |
38.70 ± 0.04 |
42.20 ± 0.15 |
49.30 ± 0.04 |
39.00 ± 1.00 |
42.30 ± 4.95b |
|
6 |
55.60 ± 0.08 |
57.80 ± 0.03 |
62.00 ± 0.03 |
41.70 ± 0.10 |
54.27 ± 9.10c |
|
9 |
80.00 ± 0.03 |
59.70 ± 0.10 |
63.10 ± 0.16 |
62.20 ± 0.06 |
66.25 ± 9.14d |
|
12 |
166.30 ± 0.42 |
63.30 ± 0.04 |
65.80 ± 0.04 |
62.80 ± 0.08 |
89.55 ± 51.18e |
|
15 |
156.00 ± 0.64 |
78.50 ± 0.71 |
81.10 ± 1.41 |
73.80 ± 0.01 |
97.36 ± 39.24f |
|
18 |
150.60 ± 0.42 |
80.60 ± 0.28 |
84.00 ± 5.66 |
168.60 ± 0.08 |
120.95 ± 45.06g |
|
Average |
97.91 ± 57.77D |
60.04 ± 16.20A |
63.35 ± 16.22B |
69.47 ± 45.73C |
|
The mean value with different superscript letters indicated a significant difference based on Duncan’s test at the 5% level (p < 0.05).
The intelligent indicator label Hue rises during storage, as seen in Table 2. On day 0 of the experiment, the Hue value of intelligent indicator on average is 38.20°, which is in the red colour spectrum. After 18 days of storage, there was a noticeable changing colour in the intelligent indicator with an average hue value of 120.95°. From table 2, it can be noticed that after 18 days of storage, the change in the intelligent indicator with the application of edible coating without the adding of citronella oil and sample with adding of 0.5% citronella oil is lower with Hue values of 80.6° and 84°, respectively which were in the yellow colour range, compared to the intelligent indicator without edible coating (150.60°) and with 1 % citronella oil (168.60°), which were in the green colour range. In the average it can be seen that the administration of different treatments showed a significant difference in the Hue level of the fish.
Changes in hue value of intelligent indicator labels during the storage period of tuna fish fillets were caused by changes in environmental conditions in the packaging with increased volatile base compounds produced by microbes and enzymes that decompose fish protein. The volatile base compounds formed will accumulate in the packaging and cause the pH in the packaging to increase that further affecting the colour of intelligent indicator. This is in accordance with the statement of Alasalvar (2002) 28, which states that the results of protein decomposition by bacterial and enzyme activities produce up to 95% ammonia and CO2. The compounds formed from the protein degradation contain nitrogen and are basic and volatile (volatile bases) which are stated as Total Volatile Bases Nitrogen (TVBN). The colour changes that occurs after 18 days of storage indicated that sample treated without the addition of citronella oil and with 0.5% of citronella oil deteriorated less than other two samples (untreated and treated with 1% citronella oil). Based on the explanation, it can be suggested that edible coating without citronella oil and with 0.5% of citronella oil gives the best effect in slowing the decay rate of the product.
pH
The tuna fish fillets pH is one of the indicators applied to determine tuna quality. The changes in the pH value of tuna fish fillets during storage are presented in Table 3.
Table 3: pH Value of Tuna Fillet.
|
Storage time (day) |
Treatment |
Average |
|||
|
Untreated |
Edible coating without citronella oil |
Edible coating + citronella oil 0.5% |
Edible coating + citronella oil 1% |
||
|
0 |
5.84 ± 0.20 |
5.84 ± 0.20 |
5.84 ± 0.20 |
5.84 ± 0.20 |
5.84 ± 0.00a |
|
3 |
6.38 ± 0.11 |
6.36 ± 0.06 |
6.38 ± 0.01 |
6.35 ± 0.07 |
6.37 ± 0.01b |
|
6 |
6.73 ± 0.04 |
6.77 ± 0.05 |
6.29 ± 0.01 |
6.28 ± 0.11 |
6.52 ± 0.27c |
|
9 |
7.99 ± 0.39 |
7.07 ± 0.10 |
7.01 ± 0.05 |
6.71 ± 0.02 |
7.20 ± 0.55d |
|
12 |
8.04 ± 0.04 |
7.29 ± 0.01 |
6.98 ± 0.06 |
7.74 ± 0.07 |
7.51 ± 0.49e |
|
15 |
8.17 ± 0.01 |
7.70 ± 0.99 |
7.33 ± 0.04 |
7.96 ± 0.03 |
7.79 ± 0.36f |
|
18 |
8.41 ± 0.01 |
8.05 ± 0.05 |
7.74 ± 0.04 |
8.11 ± 0.16 |
8.08 ± 0.27g |
|
Average |
7.37 ± 1.02C |
7.01 ± 0.76B |
6.80 ± 0.66A |
7.00 ± 0.92B |
|
The mean value with different superscript letters indicated a significant difference based on Duncan’s test at the 5% level (p < 0.05).
As can be seen in table 3, the pH value of tuna fish fillets rises along with the storage duration. In average, it started with 5.84 in day 0 and continue to rise to 8.08 in day 18 of storage. Furthermore, it was observed that an increase occurred in all the applied treatments. After 18 days of storage, it can be depicted that the pH in the sample treated with the addition of 0.5% citronella oil (7.74) and edible coating without the addition of citronella oil (8.05) was lower than that of the treatment without the use of edible coating (8.41), and with the addition of 1% citronella oil (8.11).
The difference in elevating the pH of fish fillets in various treatments with varying quantities of citronella oil on edible coatings is due to citronella oil antimicrobials inhibiting microbial development at varying concentrations. Because the pH value is proportional to the total number of bacteria present in fish, the antimicrobial activity of citronella oil applied to edible coatings might indirectly slow the rate of pH increase in tuna fish during storage. It was expected the pH would increase in positive correlation with the increase of citronella oil applied in packaging. However, the pH value obtained in this study indicated that adding 0.5 % citronella oil was more effective at slowing the rate of pH increase compared to adding 1% citronella oil. The inadequate suppression of 1 % citronella oil in edible coatings compared to 0.5 % and 0 % citronella oil is assumed to be due to the essential oil’s ability to boost the growth of other undesirable bacteria. This is consistent with the statement of Davidson et al. (2005) 29 that although essential oils can eliminate certain bacterial populations, they can also create a favorable environment and encourage the growth of other undesirable microorganisms due to changes in microbial ecology. Besides that, according to Bagamboula et al. (2004) 30 the use of essential oils as antimicrobials in foodstuffs can potentially eliminate the antimicrobial effect due to their volatile and lipophilic properties. The data from table 3 also suggests that the treatment of edible coating without citronella oil and with 0.5% of citronella oil give the best effect in slowing the decay rate of the product. It can be concluded that the treatment with the application of 0.5% citronella oil keep the pH lower significantly compared to the other treatments.
Total Bacterial Count in Tuna Fish (TPC Method)
The TPC value of tuna fillet is one of the quality indicators used to evaluate the total bacteria contained in the seafood. Table 4 depicts the change in the TPC value of tuna fish fillets during storage.
Table 4: Total Bacterial Count (TPC, log CFU/mL) of Tuna Fish.
|
Storage time (day) |
Treatment |
Average |
|||
|
Untreated |
Edible coating without citronella oil |
Edible coating + citronella oil 0.5% |
Edible coating + citronella oil 1% |
||
|
0 |
3.31 ± 0.04 |
3.31 ± 0.04 |
3.31 ± 0.04 |
3.31 ± 0.04 |
3.31 ± 0.00a |
|
3 |
3.89 ± 0.24 |
3.52 ± 0.71 |
3.41 ± 0.11 |
3.40 ± 0.18 |
3.56 ± 0.24b |
|
6 |
5.47 ± 0.64 |
4.82 ± 0.42 |
4.15 ± 0.14 |
4.61 ± 0.28 |
4.76 ± 0.50c |
|
9 |
5.87 ± 0.03 |
4.98 ± 0.03 |
4.25 ± 0.28 |
4.72 ± 0.14 |
4.96 ± 0.67d |
|
12 |
6.66 ± 0.08 |
5.71 ± 0.08 |
5.10 ± 0.71 |
6.48 ± 0.03 |
5.99 ± 0.72e |
|
15 |
7.96 ± 0.18 |
7.76 ± 0.09 |
6.42 ± 0.04 |
7.96 ± 0.02 |
7.53 ± 0.74f |
|
18 |
8.20 ± 0.28 |
8.07 ± 0.12 |
7.48 ± 0.07 |
8.12 ± 0.08 |
7.97 ± 0.34g |
|
Average |
5.91 ± 1.87D |
5.45 ± 1.88B |
4.87 ± 1.57A |
5.51 ± 2.04C |
|
The mean value with different superscript letters indicated a significant difference based on Duncan’s test at the 5% level (p < 0.05).
The addition of citronella oil at various doses has an effect on increasing the TPC value during storage, as demonstrated by quantitative data on TPC changes during storage. As can be seen on day 0, tuna fish fillets had a TPC value of log 3.31 (2.1 x 10³ CFU/ml) that made it categorized as fresh product (SNI 2729:2013 set that the limit for the number of TPC microbes in fish is 5 x 10⁵ CFU/g or log 5.70 31). Referred to the standard set by SNI, it can be seen that the fish product in average remained fresh until the 9 days of storage. However, individually, the results of this data indicates that tuna fish fillets no longer meet the feasibility of consumption on the 9th day for untreated sample, 12th day storage for sample with treatment of edible coating without the addition of citronella and 15 days with the application of 0.5% citronella oil and 12 days with the application of 1% citronella oil.
The variation in the increase in TPC number of fish fillets in various treatments with varying concentrations of citronella oil on the edible coating was due to the variable suppression of microbial growth by citronella oil antimicrobials at various concentrations. Various studies on the antibacterial activity of citronella oil against various microorganisms have been reported. Silveira et al. (2012) said that citronella oil was more active than other essential oils against 12 types of microorganisms 32. Some of them are microbes that cause spoilage in fish, such as Escherichia coli, Bacillus cereus, Pseudomonas aeruginosa and Enterobacter aerogenes. Naik et al. (2010) also reported that citronella oil was effective against gram-negative and gram-positive bacteria 33. The mechanism of antibacterial action in citronella oil is the breakdown of the phospholipid bilayer, which results in the loss of cellular components enzymes and the destruction of genetic material 34. According to Moore-Niebel et al. (2012) 35, Citronella oil acts as an antibacterial agent by limiting the production of biofilms, eliminating existing biofilms, and specifically targeting bacterial cells.
The explanation in previous pharaghraph lead to expectation that the concentration of the citronella oil applied should have shown positive correlation with the length of the product remain fresh and is expected to be inversely proportional to the TPC value. However, the data shows that administration of 0.5% citronella oil kept the product fresh longer than the application of 1% of citronella oil. This is suspected as the effect of essential oil that stimulates the growth of other undesired microorganisms. This is consistent with the statement of Davidson et al. (2005) 29 that although essential oils can eliminate certain bacterial populations, they can also create a favorable environment and encourage the growth of other undesirable microorganisms due to changes in microbial ecology. This explanation indicated that varying amounts of citronella oil have an influence on the TPC value of tuna fish fillets during storage and that the 0.5% keep the fish fresh longer compared to other treatments.
Total Volatile Bases Nitrogen (TVBN)
The Total Volatile Basic Nitrogen value of tuna fillet is used to determine the quality of tuna by evaluating the amount of volatile compounds generated by microorganisms. Table 5 illustrates the change in the TVBN value of tuna fish fillets during storage.
Table 5: Total Volatile Bases Nitrogen (TVBN, mg N/100 gram) Value of Tuna Fillet.
|
Storage time (day) |
Treatment |
Average |
|||
|
Untreated |
Edible coating without citronella oil |
Edible coating + citronella oil 0.5% |
Edible coating + citronella oil 1% |
||
|
0 |
2.71 ± 0.14 |
2.71 ± 0.14 |
2.71 ± 0.14 |
2.71 ± 0.14 |
2.71 ± 0.00a |
|
3 |
5.32 ± 0.03 |
4.76 ± 0.40 |
5.32 ± 0.01 |
3.64 ± 0.06 |
4.76 ± 0.79a |
|
6 |
6.16 ± 0.08 |
5.32 ± 0.40 |
6.44 ± 0.40 |
4.62 ± 0.59 |
5.64 ± 0.83a |
|
9 |
18.55 ± 5.44 |
16.45 ± 0.49 |
14.35 ± 1.48 |
12.95 ± 5.44 |
15.58 ± 2.45b |
|
12 |
77.35 ± 12.37 |
35.00 ± 0.99 |
19.60 ± 14.85 |
42.35 ± 2.47 |
43.58 ± 24.43c |
|
15 |
90.16 ± 10.37 |
40.04 ± 9.50 |
33.04 ± 3.17 |
47.18 ± 0.59 |
52.61 ± 25.69d |
|
18 |
124.88 ± 5.94 |
77.84 ± 4.75 |
62.72 ± 0.79 |
76.72 ± 2.38 |
85.54 ± 27.11e |
|
Average |
46.45 ± 50.4C |
26.02 ± 27.32B |
20.60 ± 21.30A |
27.17 ± 28.72B |
|
The mean value with different superscript letters indicated a significant difference based on Duncan’s test at the 5% level (p < 0.05).
Based on table 4, the TVBN value of tuna fish fillets increased along with storage time. The TVBN value of tuna fish fillet on day 0 was 2.71 mg N/100g in average which was included in the very fresh category (Fish freshness quality standard; TVBN value under 10 mg N/100g categorized as very fresh, TVBN value of 10-20 mg N/100g included as fresh, TVBN value of 20-30 mg N/100g categorized in the limit for consumption, and TVBN value above 30 mg N/100g categorized as rotten 36). The TVBN analysis results indicated that the fish was deteriorated on the 12th day of storage for untreated sample as well as for sample with the application of 0 and 1% citronella oil in the packaging system, and on the 15th day when 0.5 % citronella oil was applied.
The variation in the rise in TVBN of fish fillets following the addition of citronella oil at varying concentrations to the edible coating was attributed to the antimicrobial citronella oil inhibiting microbial development at varying concentrations. It was expected that the value of TVBN would show an inverse correlation with the citronella oil concentration applied in packaging. The higher quantity of citronella oil, the less volatile molecules are likely to be recognized. However, the TVBN value obtained in this study after 15 days of storage showed that the addition of 0.5% citronella oil was more effective in slowing the rate of increase in TVBN compared to the addition of 1% citronella oil. The TVBN value was linearly correlated with the increase in TPC in the same treatment. This is because the increase of TPC value is correlated to the increase in volatile components (TVBN) due to damage of nutrients in fish during storage. According to Whittle and Howgate (2002), the results of the decomposition of fish nutrients produce volatile components of trimethylamine, ammonia, and dimethylamine, which are incorporated in volatile base nitrogen components (TVBN) 37. However, the use of essential oils in products with high fat and protein content, such as meat and fish, is thought to cause the antimicrobial effectiveness of essential oils to be inhibited. Preedy (2016), in his book “Essential Oil in Food Preservation, Flavor and Safety”, says that high fat and protein content in meat protects bacteria from the action of essential oils 38. Excessive application of essential oils is also able to encourage the growth of other unwanted microorganisms due to changes in microbial ecology 29. In addition, proper use of essential oils is required for meat preservation to be more effective The results indicated that the treatment involving the application of 0.5% citronella oil resulted in significantly lower TVBN (Total Volatile Basic Nitrogen) values compared to the other treatments on average.
Sensory analysis using Quality Index Method (QIM)
The purpose of this sensory analysis is to investigate the impact of adding citronella oil at various concentrations on the sensory qualities of tuna fish fillets during storage. The findings reveal a rise in the score for sensory qualities, indicating a decline in the quality of tuna fillets stored. Assessment of sensory attributes consisting of slimy, texture, aroma, colour, and general acceptance attributes are stated in the Quality Index (QI).
The QI value is the sum of the scores of all sensory parameters of each attribute that has high or low relevance to the panelist’s assessment. The criteria for the fish that were rejected by the panelists were very slimy, very soft texture, foul-smelling, and very disliked by the panelists. Table 6 illustrates the change in the QI value over time during storage.
Table 6: Quality Index (QI) Value of Tuna Fillet.
|
Storage time (day) |
Treatment |
Average |
|||
|
Untreated |
Edible coating without citronella oil |
Edible coating + citronella oil 0.5% |
Edible coating + citronella oil 1% |
||
|
0 |
5.10 ± 0.64 |
5.10 ± 0.64 |
5.10 ± 0.64 |
5.10 ± 0.64 |
5.10 ± 0.00a |
|
3 |
5.21 ± 0.44 |
6.21 ± 0.10 |
4.71 ± 0.67 |
4.45 ± 1.11 |
5.15 ± 0.78a |
|
6 |
7.23 ± 0.32 |
4.98 ± 1.66 |
6.75 ± 0.07 |
5.65 ± 0.42 |
6.15 ± 1.02b |
|
9 |
7.23 ± 0.32 |
7.58 ± 0.60 |
7.18 ± 0.67 |
5.23 ± 0.53 |
6.80 ± 1.06b |
|
12 |
15.00 ± 0.00 |
7.91 ± 0.39 |
6.41 ± 0.42 |
7.07 ± 1.63 |
9.10 ± 3.99c |
|
15 |
15.00 ± 0.00 |
5.03 ± 0.11 |
9.20 ± 0.21 |
7.55 ± 0.92 |
9.19 ± 4.23c |
|
18 |
15.00 ± 0.00 |
15.00 ± 0.00 |
15.00 ± 0.00 |
15.00 ± 0.00 |
15.00 ± 0.00d |
|
Average |
9.97 ± 4.78C |
7.40 ± 3.57AB |
7.76 ± 3.52B |
7.15 ± 3.63A |
|
The mean value with different superscript letters indicated a significant difference based on Duncan’s test at the 5% level (p < 0.05).
According to the table 6, the treatment without edible coating resulted in a rise in total QI, while the treatment with different doses of citronella oil had varying outcomes but tended to increase. According to quantitative data, tuna fillets treated without the addition of edible coating were rejected by panelists on the 12th day of storage, but samples with the addition of citronella oil were rejected by the panelists on the 18th day of storage with the criteria of very slimy, very soft texture, foul-smelling, and generally very disliked by the panelists (score 15). The ANOVA test was used to assess if there was a significant difference between the addition of citronella oil at various concentrations and changes in the sensory analysis value (QI value) of tuna fish fillet during storage.
The variation in the rise in QI value was due to the addition of citronella oil in various quantities is because citronella oil and an edible coating added to tuna fillets have antibacterial properties 39. The sensory quality attributes tested are related to the TPC value of tuna fish fillets. The greater the TPC value of the tuna fillet, the worse the fish’s quality, which has an influence on the sensory characteristics evaluated. The findings of this study indicate that the addition of 1% citronella oil treatment received better sensory ratings compared to other treatments based on the panelist’s assessment. This suggests that citronella oil has a positive effect on the sensory value of tuna fillets as stated by Preedy (2016), that essential oils added to edible films can improve the sensory properties of food 38. However, it was observed that the TPC values were higher in the addition of 1% citronella compared to the 0.5% citronella oil treatment; thus this study suggested addition of 0.5% citronella oil is recommended for meat preservation.
Correlation between the value of the intelligent indicator’s colour analysis and several parameters of tuna fish spoilage
The correlation between changes colour measurement of the indicator and the decay parameter of tuna fish fillet quality is presented in Figures 5, 6, 7, and 8.
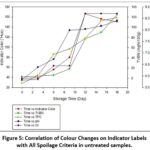 |
Figure 5: Correlation of Colour Changes on Indicator Labels with All Spoilage Criteria in untreated samples. |
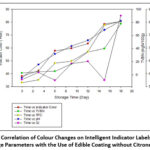 |
Figure 6: Correlation of Colour Changes on Intelligent Indicator Labels with All Spoilage Parameters with the Use of Edible Coating without Citronella Oil. |
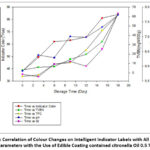 |
Figure 7: Correlation of Colour Changes on Intelligent Indicator Labels with All Spoilage Parameters with the Use of Edible Coating contained citronella Oil 0.5 %. |
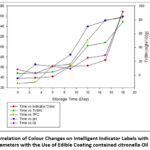 |
Figure 8: Correlation of Colour Changes on Intelligent Indicator Labels with All Spoilage Parameters with the Use of Edible Coating contained citronella Oil 1%. |
Based on the figure 8 the pattern of the relationship between changes in the colour of the intelligent indicator label and all parameters of tuna fillet spoilage on average experienced the same pattern of improvement in detecting changes in tuna fillet spoilage. The correlation value between colour change and fish spoilage parameters (TPC, TVBN, pH, and sensory analysis) was analyzed through multiple correlation tests to determine the level of strength and direction of the linear relationship of two or more independent variables to the dependent variable. Significance of the correlation it is based on the value of the correlation coefficient including 0.00-0.20 (negligible), 0.21-0.40 (low), 0.41-0.70 (moderate), 0.71-0.90 (high), 0.91-0.99 (very high), and 1.00 (perfect) 40. The results of the multiple correlations between indicator colour changes and tuna spoilage parameters can be seen in table 7.
Table 7: The correlation coefficient between the colour change and fish spoilage parameters.
|
Treatments |
Correlation coefficient |
Significance value |
|
Untreated |
0.999 |
0.003 |
|
Edible coating without Citronella oil |
0.998 |
0.007 |
|
Edible coating contained 0.5% Citronella oil |
0.992 |
0.032 |
|
Edible coating contained 1% |
0.986 |
0.056 |
The significance value < 0.05 indicates a significant relationship, the significance value > 0.05 indicates that there is no significant relationship, so there is a strong (very high) relationship or correlation between indicator colour changes and tuna fillet spoilage parameters.
Conclusions
Through this research, it can be concluded that the smart packaging system employing intelligent packaging indicator label of Metyl Red + Bromothymol blue (1:1) can be applied to evaluate the tuna fish fillets quality marked by a change in colour from dark red to yellow, then green. And a 0.5% concentration of citronella oil addition to edible coating maintains the quality of tuna fish fillets best among other concentrations applied with a maximum storage period of 15 days as it is more effective in inhibiting microbial growth, which is the main parameter causing spoilage of fishery products. The level of correlation between the colour analysis value of the intelligent indicator and the effectiveness of edible coating on various fish spoilage test parameters shows a positive correlation which shows the linear trend pattern in detecting the level of the spoilage of tuna fish fillets. The correlation coefficient value ranges from 0.98-0.99, which indicates a strong relationship.
Acknowledgment
All authors would like to express gratitude to Food Science and Technology Study Program of Hasanuddin University for facilitating this study.
Conflicts of Interest
The authors declare no conflict of interest.
Funding Sources
This research received no external funding.
References
- Hostenkamp G, Sorensen J. Are fish eaters healthier and do they consume less health-care resources? Public Health Nutr. 2009;13(4):453-460. doi:10.1017/S1368980009991327
CrossRef - McManus A, Hunt W, Storey J, McManus J, Hilhorst S. Perceptions and preference for fresh seafood in an Australian context. Int J Consum Stud. 2014;38(2):146-152. doi:10.1111/ijcs.12076
CrossRef - FAO. The State of World Fisheries and Aquaculture 2020: Sustainability in Action. FAO; 2020.
- Ambrosio RL, Gogliettino M, Agrillo B, et al. An Active Peptide-Based Packaging System to Improve the Freshness and Safety of Fish Products: A Case Study. Foods. 2022;11(3):1-21. doi:10.3390/foods 11030338
CrossRef - Mohan CO, Ravishankar CN. Active and intelligent packaging systems-Application in seafood. World J Aquac Res Dev. 2019;1:10-16.
- Nagarajarao RC. Recent Advances in Processing and Packaging of Fishery Products : A Review. Aquat Procedia. 2016;7:201-213. doi:10.1016/j.aqpro.2016.07.028
CrossRef - Kontominas MG, Badeka A V, Kosma IS, Nathanailides CI. Recent Developments in Seafood Packaging Technologies. Foods. 2021;10(5):1-45. doi:10.3390/foods10050940
CrossRef - Pacquit A, Crowley K, Diamond D. Intelligent Packaging Technologies for Fish and Seafood Products. In: Kerry J, ed. Intelligent Packaging Technologies for Fast Moving Consumer Goods. John Wiley & Sons, Ltd.; 2008:75-98. doi:10.1002/9780470753699.ch5
CrossRef - Kuswandi B, Jayus, Larasati TS, Abdullah A, Heng LY. Real-Time Monitoring of Shrimp Spoilage Using On-Package Sticker Sensor Based on Natural Dye of Curcumin. Food Anal Methods. 2012;5(4):881-889. doi:10.1007/s12161-011-9326-x
CrossRef - Yam K, Takhistov P, Miltz J. Concise Reviews / Hypotheses in Food Science Intelligent Packaging : Package devices. J Food Sci. 2005;70(1):1-10. doi:10.1111/j.1365-2621.2001.tb16112.x
CrossRef - Ozdemir M, Floros JD. Active food packaging technologies. Crit Rev Food Sci Nutr. 2004;44(3):185-193. doi:10.1080/10408690490441578
CrossRef - Dobrucka R, Cierpiszewski R. Active and intelligent packaging food-Research and development-A Review. Polish J Food Nutr Sci. 2014;64(1).
CrossRef - Rodrigues ET, Han JH. Antimicrobial whey protein films against spoilage and pathogenic bacteria. In: Book Of Abstract IFT Annual Meeting. Institute Of Food Technologist; 2000:191.
- Han JH. Antimicrobial food packaging. Food Technol. 2000;54:56-65.
- Han JH, Floros JD. Casting antimicrobial packaging films and measuring their physical properties and antimicrobial activity. J Plast Film Sheet. 1997;13:287-298.
CrossRef - Nam S, Scanlon MG, Han JH, Izydorczyk MS. Extrusion of pea starch containing lysozyme and determination of antimicrobial activity. J Food Sci. 2007;72:477-484.
CrossRef - An D, Kim Y, Lee S, Paik H, D L. Antimicrobial low density polyethylene film coated with bacteriocins in binder medium. Food Sci Biotechnol. 2000;9(1):14-20.
- Yolanda DS, Dirpan A, Rahman ANF, Djalal M, Hidayat SH. The potential combination of intelligent and active packaging in one packaging system in improving and maintaining the quality of fish. Canrea J Food Technol Nutr Culin J. Published online 2020:74-86.
CrossRef - Drago E, Campardelli R, Pettinato M, Perego P. Innovations in Intelligent Packaging Concepts for Food: An Extensive Review. Foods. 2020;9(11):1-42. doi:10.3390/foods9111628
CrossRef - Riyanto R, Hermana I, Wibowo S. Characteristics of Plastic Indicator for Early Warning Indicator of Fish Freshness in a Plastic Packaging. JPB Perikan. 2014;9(2):153-163.
CrossRef - Hakim ML Al, Hartanto R, Nurhartadi E. Pengaruh Penggunaan Asam Asetat dan Edible Coating Ekstrak Bawang Putih Terhadap Kualitas Fillet Ikan Nila Merah (Oreochromis niloticus) selama Penyimpanan Suhu Dingin. J Teknol Has Pertan. 2016;IX(1).
CrossRef - Kuswandi B, Maryska C, Jayus, Abdullah A, Heng LY. Real time on-package freshness indicator for guavas packaging. J Food Meas Charact. 2013;7(1):29-39. doi:10.1007/s11694-013-9136-5
CrossRef - National Standardization Agency of Indonesia (BSN). SNI 2354.8:2009 Chemical test method-Part 8: Determination of Total Volatile Base Nitrogen (TVB-N) and Trimethyl Amin Nitrogen (TMA-N) levels in fishery products. Published online 2009.
- National Standardization Agency of Indonesia (BSN). SNI 2331.3: 2015 How to Test Microbiology – Part 3 : Determination of Total Plate Count (TPC) Analysis on Fishery Products. National Standardization Agency of Indonesia; 2015.
- Hyldig G, Green-Petersen DMB. Quality Index Method—an objective tool for determination of sensory quality. J Aquat food Prod Technol. 2005;13(4):71-80.
CrossRef - Hunterlab. Colorimeters Versus Spectrophotometers. Technical Service Departement Hunter Associates Laboratory, Inc.; 2008.
- MacDougall D. Colour in Food: Improving Quality. Woodhead Publishing; 2002.
CrossRef - Alasalvar C. Seafoods: Quality, technology and nutraceutical applications—An overview. Seafoods—Quality, Technol Nutraceutical Appl. Published online 2002:1-5.
CrossRef - Davidson PM, Sofos JN, Branen AL. Antimicrobials in Food. CRC press; 2005.
CrossRef - Bagamboula CF, Uyttendaele M, Debevere J. Inhibitory effect of thyme and basil essential oils, carvacrol, thymol, estragol, linalool and p-cymene towards Shigella sonnei and S. flexneri. Food Microbiol. 2004;21(1):33-42. doi:10.1016/S0740-0020(03)00046-7
CrossRef - National Standardization Agency of Indonesia (BSN). SNI 2729:2013 Fresh Fish. National Standardization Agency of Indonesia; 2013.
- Silveira SM da, Cunha Júnior A, Scheuermann GN, Secchi FL, Vieira CRW. Chemical composition and antimicrobial activity of essential oils from selected herbs cultivated in the South of Brazil against food spoilage and foodborne pathogens. Ciência Rural. 2012;42(7):1300-1306.
CrossRef - Naik MI, Fomda BA, Jaykumar E, Bhat JA. Antibacterial activity of lemongrass (Cymbopogon citratus) oil against some selected pathogenic bacterias. Asian Pac J Trop Med. 2010;3(7):535-538.
CrossRef - Kotzekidou P, Giannakidis P, Boulamatsis A. Antimicrobial activity of some plant extracts and essential oils against foodborne pathogens in vitro and on the fate of inoculated pathogens in chocolate. LWT-Food Sci Technol. 2008;41(1):119-127.
CrossRef - Moore‐Neibel K, Gerber C, Patel J, Friedman M, Ravishankar S. Antimicrobial activity of lemongrass oil against Salmonella enterica on organic leafy greens. J Appl Microbiol. 2012;112(3):485-492.
CrossRef - Farber L. Freshness Test. In: G B, ed. Fish As Food. Academic Press; 1965.
CrossRef - Whittle KJ, Howgate P. Glossary of fish technology terms. Rome Food Agric Organ United Nations. 2002;63.
- Preedy VR. Essential Oil in Food Preservastion, Flavor and Savety. Academic Press Imprint Elsevier; 2016.
- Punia Bangar S, Chaudhary V, Thakur N, Kajla P, Kumar M, Trif M. Natural Antimicrobials as Additives for Edible Food Packaging Applications: A Review. Foods. 2021;10(10):1-24. doi:10.3390/foods10102282
CrossRef - Ligaya M, Rapatalo T. Personality Types and Conflict Management Styles. J World Englishes Educ Pract. 2020;2(2):117-128.
Scopus Citation(s): 5
Accepted on: 24 Jul 2023
Second Review by: Monika Thakur
Final Approval by: Dr. Prasad S. Variyar


Web of Science Coverage
Emerging Sources Citation Index (ESCI)
2024 Journal Impact Factor: 1.1
Scopus Journal Metrics
CiteScore 2025: 2.6
CiteScore Details
Sustainable Nutrition: Food Systems, Nutrient Retention, and Public Health Impact
![]()
This journal is a member of, and subscribes to the principles of, the Committee on Publication Ethics (COPE)


