Enrichment of Taboun Bread with Quinoa Seeds as a Functional Ingredient
Ahmad AlMaayta1
and Khaled Abu-Alruz1 1Department of Nutrition and Food Technology, Faculty of Agriculture, Mutah University, Al-Karak, Jordan.
2Department of Allied Medical Sciences, Nutrition and Food Science, Zarqa University College, Al-Balqa' Applied University, Jordan.
Corresponding Author E-mail: olaalmaseimi@bau.edu.jo
DOI : http://dx.doi.org/10.12944/CRNFSJ.11.2.33
Download this article as:
![]()
The objective of this study was to develop Taboun bread supplemented with quinoa flour and to select the best pretreatment that could be used to reduce saponin content without negatively affecting the quality of bread. In this study, three types of composite flour containing wheat flour with different levels of substitution of wheat flour ranging from 0% to 25% were used to prepare composite flour. The effects of incorporating of the different concentrations of extruded Quinoa seed flour with wheat flour and the storage days on the bread quality during three days of storage at room temperature for three days were studied. The results showed that the incorporation of the pre-processed seeds with a 20 and 25% substitution level (without pretreatment) had the highest effect in decreasing the values of peak viscosity compared to other types of pretreatments. The texture profile analysis (TPA) parameters (hardness, cohesiveness, resilience, and chewiness) were significantly affected by the storage time, the level of acceptance of sensory characteristics, and the interaction between them. The study recommends that studies be carried out to further verify the role of physical treatments of quinoa seeds in improving the characteristics of the finished product of Taboun bread.
KEYWORDS:Functional food; Quinoa seed; Sensory parameters; Taboun bread
Introduction
Functional foods are described as any ingredient or component of food that delivers health benefits, including illness prevention and treatment. The key functional components of food include fibers, proteins, polyunsaturated fatty acids, phenolic compounds, prebiotics, and probiotics6. A functional food can be a natural food, a food that has had a component added to it, a food that has had a component removed, or a food that has had one or more components modified, a food with modified bioavailability, or any combination of these 8. A food product becomes functional by removing a component that is known or suspected of creating a negative effect when consumes it. Increasing the concentration of a naturally occurring dietary component, including an element that isn’t usually found in food, Increasing the bioavailability or stability of a component known to provide a functional advantage or to reduce the disease-risk potential of a diet. 8.
Quinoa is a pseudo-cereal with high-quality protein, and this cereal has high fatty acid levels and strong oxidative stability7. Quinoa grains are covered by an epicarp that holds glycoside compounds called saponins showing a characteristic bitter or astringent taste 17. When consumed alone or combined with other cereal grains, quinoa’s well-balanced protein and amino acid composition may help maintain a healthy level of protein in the diet. Quinoa is becoming increasingly popular these days due to its high nutritional value, protein content and role as a beneficial source of micronutrients. Quinoa is a complete plant-based protein source for humans, as it contains a well-balanced combination of essential amino acids. Quinoa is also a great source of dietary fiber and phosphorus9. It contains significant amounts of magnesium, iron, and vitamins like vitamin E and group B. Quinoa is thought to be easily digestible6. Quinoa and quinoa products are high in polyphenols, which are bioactive secondary plant metabolites that contribute to a number of physiological properties such as antimicrobial, antioxidant, anti-inflammatory, anti-tumor and anti-carcinogenic effects. Polyphenols include phenolic acids, flavonoids and tannins16. Quinoa seeds’ compounds possess additional health benefits beyond the high nutritional value, especially the antioxidant and anti-inflammatory activities that are essential for reducing the risk of chronic diseases related to oxidative stress, including cancer, cardiovascular disease, diabetes and aging, also quinoa is generally safe for people with celiac disease17.
On the other hand, quinoa contains a variety of antinutritional compounds such as saponins. Before the seeds are consumed, saponins, which are thought to be an antinutritional component, must be removed 5. Most quinoa saponins are polar saponins soluble in water22 and tend to foam in aqueous solutions 19. Saponins are present in the outer layer of glycoside compounds. These compounds have pharmacological properties but impart a bitter taste to the grain, which must be reduced by grinding and/or washing before consumption. Quinoa seeds can be classified as sweet (0.11% saponins) or bitter (>0.11% saponins) depending on the saponin content of the variety 8. All of these nutritional and health properties will make quinoa a potential functional food that can be incorporated with different food products, and one of these products is Taboun bread.
Taboun bread is a flatbread type classified as a single-layer bread. Cereal flours, particularly wheat, are the world’s most popular fortified food. The purpose of fortifying wheat flour is to enhance the produced bread’s nutritional and sensory values14. One of the important challenges to consider was reducing the saponin contents of quinoa seeds before utilizing them in Taboun bread preparation. In particular, replacing part of the flour used in the preparation of Taboun bread with quinoa flour will improve its nutritional and health properties, although it will not negatively affect its sensory properties. To the best of our knowledge, no study has been conducted to investigate the effect of replacing wheat flour with different levels of quinoa flour on the quality of Taboun bread.
The main objectives of this study are to:
Develop Taboun bread enriched with quinoa flour.
Select the best pretreatment that could be used to reduce saponine content without negatively affecting Taboun bread quality.
Determine the optimal proportions of wheat flour to quinoa flour for production of Taboun bread with good quality.
Material and Methods
Material
In order to prepare Taboun bread the following ingredients were used: quinoa flour (Alsufara Bakery, Amman, Jordan), Baladi wheat flour (Aljwaideh mills, Amman, Jordan), and Zero wheat flour (Alghazal modern flour mills & Macaroni factories, Amman, Jordan).
Methods
In this study, two experiments were performed to answer the research questions:
Effects of quinoa seed physical modifications on pasting profile of composite flour containing wheat flour with different proportions of quinoa flour.
Pretreatment of quinoa seeds and preparation of quinoa flour
The following pretreatments were used to reduce saponin content: washing, roasting and extruding. Quinoa seeds portions of 200g were used with two replicates for each treatment. For washing quinoa seed were washed ten times using 10 L of water for each 1 Kg of quinoa seeds20. After that, quinoa seeds were dried at 55 ̊C for 6 hours using lab dehydrator (Excalibur, USA). In roasting, the quinoa seeds were milled using a hammer mill (Alsufara Bakery, Amman, Jordan). Then, the flour was roasted in a vacuum oven at 200 ̊C or 10 minutes. (JE IO TECH (OV12), Korea). For extrusion, the quinoa seeds were extruded in (Alsufara Bakery, Amman, Jordan) (Manual design) at 150 ̊C and 14% moisture content on wet basis using a locally designed extruder. After that, the extruded quinoa was milled using a hammer mill and stored tightly vacuum packed at room temperature. All samples were numbered and coded appropriately.
Preparation of the composite flour containing wheat flour and quinoa flour with different proportions
Pretreated Quinoa seeds flour was mixed with wheat flour in the following proportions: 0, 5, 10, 15, 20, and 25%. Composite flour was prepared just before testing and evaluation. The composite of flour was placed in large bags, and homogenized manually by shaking vigorously for a minute. After that, samples are taken from different areas for the purpose of verifying the stability of the moisture content, and when doing so it was found to be stable.
Evaluation of the composed flour: two methods were used to evaluate the different quinoa flour blends
Flour pasting profile
The general pasting method (AACC International Method 76-21.01) was used to determine the pasting profile of the composite. The process in brief: 25 ml of distilled water was filled into a canister. After that, 3.5 g of the composite flour at 14% moisture content was added to the canister. The blade was placed in the canister and vigorously moved ten times up and down to ensure no lumps remained. Then it was inserted into a Rapid Visco Analyser device (RVA) (Perten, Australia). The Rapid Visco Analyser (RVA) was programed using Thermocline software (Perten, Australia). The profile used to program the Rapid Visco Analyser (RVA) is summarized in Table (1).
Table 1: Rapid Visco Analyzer heating profile according to the general pasting method
|
Time (second) |
Type |
Value (oC) |
|
00:00:00 |
Temperature |
50 oC |
|
00:00:00 |
Speed |
960 rpm |
|
00:00:01 |
Speed |
160 rpm |
|
00:01:00 |
Temperature |
50 oC |
|
00:04:42 |
Temperature |
95 oC |
|
00:07:12 |
Temperature |
95 oC |
|
00:11:00 |
Temperature |
50 oC |
|
00:13:00 |
End |
|
|
Idle Temperature 50 ±1oc Time between readings 4 seconds |
||
The software drew the pasting curve as the program started. At the end of the program, the software calculates the following parameters: breakdown, trough, peak viscosity, final viscosity, setback, peak time, and pasting temperature. A typical pasting curve is shown in Figure (1). The calculation method used for each parameter is summarized in Table (2).
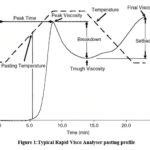 |
Figure 1: Typical Rapid Visco Analyser pasting profile |
Table 2: Pasting profile parameters definition
|
Parameter |
Definition |
|
Peak viscosity |
The maximum paste viscosity is reached during the heating stage of the profile. |
|
Trough |
The minimum paste viscosity was obtained during the holding stage at the highest temperature. |
|
Breakdown |
(Peak viscosity) – (trough viscosity) |
|
Final viscosity |
The viscosity at the end of the profile |
|
Set back |
(Final viscosity) – (trough viscosity) |
|
Peak time |
The time corresponded with the peak viscosity |
|
Pasting temperature |
The temperature at the onset of the rise in viscosity. |
Flour color
Composite flour color was evaluated using a non-contact spectrophotometer (VS-450, UK) according to the manufacturer’s recommendations. The CIE Lab values and color difference values were calculated using Oncolor software (CyberSoft, UK).
Statistical analysis
Completely randomized design-factorial design (4×6) with two replicates was used to analyze the data using Minitab system (version 19.20.20). The statistically significant effect of the parameters was determined by a two-way analysis of variance with Tukey’s test (P< 0.05).
Effects of using composite flour containing wheat and quinoa flour in different ratios on Taboun bread quality during three days of storage
A completely randomized design (CRD) was used to evaluate the quality of Taboun bread formulated from three types of composite flour containing wheat flour with different quinoa seed flour: 0, 10, and 20%.
Based on the first experiment’s results, the previous substitution ratio was selected.
Taboun bread preparation
Six composite flour recipes were used to prepare Taboun bread. In addition to composite flour, the recipes contain salt, sugar, yeast, sodium bicarbonate, and water (Table 3). An expert worker determined the required amount of water as the quantity of water needed to give the dough optimal viscosity. The straight-dough method was used to prepare the dough. Ingredients were weighed and mixed; water was gradually added to give the dough the required viscosity. The dough was mixed. Then divided and rounded the dough into balls weighting 185g and put them in wood boarding. The dough was allowed to ferment for 50 minutes at room temperature. After that, the dough was manually formed to the desired diameter and baked. After baking, the loaves were left to cool for 15 minutes. Finally, the loaves were packed in plastic bags and left for evaluation after three days of storage.
Table 3: Taboun bread formulas using different composite flour containing wheat flour with different proportions of quinoa seed flour.
|
Wheat flour% |
Quinoa flour% |
Baldi flour(g) |
Zero flour(g) |
Quinoa (g) |
Salt (g) |
Sugar (g) |
Sodium bicarbonate (g) |
Yeast (g) |
Water (ml) |
|
100% |
0% |
1000 |
500 |
0 |
15 |
30 |
10 |
100 |
1360 |
|
90% |
10% |
900 |
450 |
150 |
15 |
30 |
10 |
100 |
1305 |
|
80% |
20% |
800 |
400 |
300 |
15 |
30 |
10 |
100 |
1305 |
Taboun bread evaluation
Physical measurements
Baking loss
The baking loss is calculated using this equation:

Baking loss=(dough weight before proving-loaf weightafter cooling )/(dough weight before proving ) *100%
Color measurement
The bread upper surface and bottom surface color were measured at three different locations in the bread loaf and then averaging the values. The color was measured using a non-contact spectrophotometer (X-rite VS-450, UK) equipped with On color software (CyberSoft, UK). The CIE Lab color values and color difference were calculated where: L* represents the reflection of light; a* values represent the red/green colors (+ values for red color and – values for green color); b* values represent the yellow/blue colors (+ values for yellow color and – values for blue color).
Instrumental texture evaluation
Texture profile analysis (TPA)
TPA was measured using a texture analyzer (TVT6700, Perten, Sweden) using TVT methods (01-03.2). The texture analyzer was equipped with a 5 kg load cell and a stainless steel cylinder probe (45mm height and 25mm diameter). The test profile was: staring distance from sample=5mm, sample compression = 20%, pause between cycles=15 s, initial probe speed=1mm/s, probe test speed = 1mm/s, probe retract speed=1mm/s, and trigger force=5g. The program drew the distance/time and force curve from which the following parameters were calculated: firmness, cohesiveness, chewiness, resilience, and springiness. In Figure (3-2), a typical Texture Profile Analysis (TPA) curve is illustrated. The maximum peak force was calculated as firmness. The resilience was Area a2/Area a1. Cohesiveness was the total area of the second peak divided by the area of the first peak. The chewiness was calculated by multiplying firmness, cohesiveness and springiness.
 |
Figure 2: A typical texture profile analysis curve. |
Bread stretchability
Bread stretchability was tested using a texture analyzer (TVT6700, Perten, Sweden). 5 kg load cell was used, and stainless steel cylinder probe (3 mm diameter). The bread loaf was placed under the probe. The program records the measurement once the probe reaches the pre-set trigger force. The probe will then puncture the sample to a predefined distance. After puncture, the probe returns to its starting position (AIB method, 2017). The test profile used was: starting distance from the sample: 5mm, sample compression: 15 mm, initial probe speed: 2 mm/s, probe test speed: 1.7 mm/s, probe retract speed: 10 mm/s, and trigger force: 10 g. Three measurements were taken from each loaf and averaged for statistical analysis.
Sensory analysis
Untrained sensory analysis
The bread samples cut from each loaf look like a circular sector. Samples were placed on plates and displayed to my family member and friends. We instructed the panelists to evaluate the bread using a nine-point hedonic scale, where 1 denotes dislike very much, and nine denotes like very much. Twenty panelists evaluated the bread.
Statistical analysis
Completely Randomized Design- factorial design (CRD) with two replicates was used to analyze the data using the Minitab system (version 19.20.20). Tukey’s test determined the statistically significant difference effect of the parameters (P< 0.05).
Results
Effects of quinoa seed physical modifications on the pasting profile of composite flour containing wheat flour with different proportions of quinoa flour.
A 4×6 factorial experiment was applied to examine the main effects of the two factors and their interactions. The first factor was the pretreatment of Quinoa seeds which contained four levels: Quinoa seeds without pretreatment, washed Quinoa seeds, roasted Quinoa seeds, and extruded Quinoa seeds. The second factor was the levels of substitution of wheat flour with Quinoa seeds flour which contained six levels: 0, 5, 10, 15, 20, and 25%. When the interaction effect was significant, only the results of the interaction effects were presented. When the interaction effect was not significant, significant main effects were presented.
Pasting profile
Pasting temperature
Pasting temperatures of the composite flour were not significantly (P>0.05) affected by the pretreatment type of Quinoa seeds, levels of substitution of wheat flour, and interaction between them. The pasting temperatures for different composite flour ranged between 73.8 ̊C and 87.68 ̊C (Table 4).
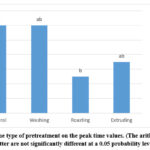 |
Figure 3: Effect of the type of pretreatment on the peak time values. |
Peak time
The values of peak time were significantly affected (P≤0.05) by the type of pretreatment and the levels of substitution of wheat flour, with no interaction between them. Only the roasting treatment was significantly (P≤0.05) lower than the control treatment (Figure 3). Regarding the effect of flour substitution level, above 5% substitution level the peak time values decreased significantly (Table 4).
Breakdown
The values of breakdown were significantly affected (P≤0.05) only by the pretreatment type and the substitution levels. No significant differences existed between the pretreatments used and the control (Figure 4). Only the 25% substitution level was not significantly different from the control, whereas other treatments were significantly higher than the control (Table 4).
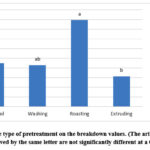 |
Figure 4: Effect of the type of pretreatment on the breakdown values. |
Peak viscosity
The peak viscosity values of the composite flour were significantly affected (P≤0.05) by the pretreatment type, the substitution levels, and the interaction between them. Composite flour with extruded Quinoa seeds and with increased substitution levels had the highest effect in decreasing the values of peak viscosity compared to other types of pretreatments. The composite flour with extruded quinoa seeds with levels above 5% significantly affected the peak viscosity compared to the wheat flour. The composite flour with washed quinoa seeds with levels up to 20% did not significantly affect the peak viscosity compared to the control. (Table (5) and Figure (5)).
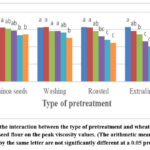 |
Figure 5: Effect of the interaction between the type of pretreatment and wheat flour substitution levels with quinoa seed flour on the peak viscosity values. |
Trough
There were main effects of pretreatment type and levels of substitution with a significant (P≤0.05) interaction between them on the trough values. Composite flour with washed Quinoa seeds had the lowest effect in decreasing the trough values compared to other types of pretreatments, and composite flour with extruded Quinoa seeds and with a 25% substitution level had the highest significant impact on the trough values compared to the control (Table (5) and Figure (6)).
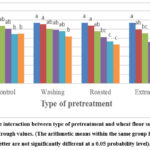 |
Figure 6: Effect of the interaction between type of pretreatment and wheat flour substitution levels with quinoa flour on the trough values. |
Setback
The type of pretreatment, the levels of substitution, and the interaction between them significantly (P≤0.05) affected the values of the setback. As shown in Table (4) and Figure (7), the roasting and extruding pretreatments did not significantly affect the setback values, as washing pretreatment and quinoa seeds without pretreatment had the highest effect in increasing the setback values. The composite flour with quinoa seeds without pretreatment with substitution level up to 15% did not significantly affect the setback values compared to control.
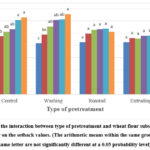 |
Figure 7: Effect of the interaction between type of pretreatment and wheat flour substitution levels with quinoa seeds flour on the setback values. |
Table 4: Effect of the substitution levels of wheat flour with quinoa seed flour on pasting profile parameter**
|
Pasting Profile Parameters |
|||||||
|
Substitution* Levels |
Pasting. Temp |
Peak Viscosity |
Time to peak (min) |
Breakdown |
Trough |
setback |
Final |
|
0% |
86.68± |
1568 |
6.54 |
229.13 |
1338.25 |
427.25 |
1766.13 |
|
5% |
84.013 |
1535.38 |
6.46 |
268 |
1267.38 |
479.62 |
1747 |
|
10% |
86.93 |
1449.13 |
6.33 |
266.89 |
1182.25 |
512.13 |
1694.38 |
|
15% |
86.69 |
1348 |
6.21 |
268.5 |
1079.5 |
537.5 |
1617 |
|
20% |
86.79 |
1243.5 |
6.07 |
262.75 |
1014.75 |
559.88 |
1541.38 |
|
25% |
83.71 |
1149.13 |
6 |
241.13 |
908 |
562 |
1470 |
*Data were expressed by Means±Standard Deviation(SD), ** The arithmetic means within the same column followed by the same letter are not significantly different at a 0.05 probability level.
Final viscosity
The final viscosity values were significantly affected by the pretreatment type, substitution levels, and the interaction between them. The composite flour with extruded Quinoa seeds with a 20 and 25% substitution level of wheat flour had the highest effect in decreasing the final viscosity values compared to other pretreatments. Only the washing pretreatments and the control (Quinoa without pretreatments) were not significantly affected the final viscosity values (Table (5) and Figure (8)).
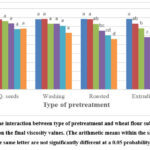 |
Figure 8: Effect of the interaction between type of pretreatment and wheat flour substitution levels with quinoa seeds flour on the final viscosity values. |
Table 5: The effect of the interaction between pretreatment type and substitution level with quinoa flour on pasting profile parameters*
|
Interaction effect |
Pasting. Temp |
Peak Viscosity |
Time to peak |
Breakdown |
Trough |
Setback |
Final Viscosity |
|
|
Pre. |
Sub. |
|||||||
|
Control |
0% |
86.48 |
1575.5 |
6.52 |
233 |
1342.5 |
436.5 |
1779 |
|
Control |
5% |
87.38 |
1557 |
6.5 |
256 |
1301 |
474.5 |
1775.5 |
|
Control |
10% |
87.05 |
1521 |
6.37 |
252 |
1269 |
513 |
1782 |
|
Control |
15% |
86.48 |
1466.5 |
6.3 |
259 |
1207.5 |
533 |
1740.5 |
|
Control |
20% |
86.53 |
1339.5 |
6.07 |
256.5 |
1086 |
608 |
1694 |
|
Control |
25% |
86.9 |
1355 |
6.07 |
258 |
1097 |
629 |
1726 |
|
Washing |
0% |
86.89 |
1560.5 |
6.57 |
225.5 |
1334.5 |
418.5 |
1753.5 |
|
Washing |
5% |
86.9 |
1564.5 |
6.44 |
262.5 |
1302 |
487.5 |
1789.5 |
|
Washing |
10% |
86.53 |
1461.5 |
6.27 |
255.5 |
1206 |
554 |
1760 |
|
Washing |
15% |
86.45 |
1459.5 |
6.27 |
275 |
1184.5 |
607.5 |
1792 |
|
Washing |
20% |
86.48 |
1415 |
6.2 |
266.5 |
1148.5 |
612 |
1760.5 |
|
Washing |
25% |
86.48 |
1255.5 |
6.04 |
223.5 |
1032 |
653.5 |
1685.5 |
|
Roasting |
0% |
86.68 |
1568 |
6.54 |
229 |
1338 |
427 |
1766 |
|
Roasting |
5% |
86.8 |
1561 |
6.44 |
284.5 |
1276.5 |
496.5 |
1773 |
|
Roasting |
10% |
86.48 |
1456 |
6.27 |
306 |
1150 |
527 |
1677 |
|
Roasting |
15% |
86.5 |
1304 |
6.12 |
287.5 |
1016.5 |
532 |
1548.5 |
|
Roasting |
20% |
86.88 |
1205.5 |
6 |
278.5 |
927 |
539± |
1466 |
|
Roasting |
25% |
87.68 |
1118.5 |
6±0.00 |
263 |
855.5 |
512 |
1367.5 |
|
Extruding |
0% |
86.68 |
1568 |
6.54 |
229 |
1338 |
427 |
1766 |
|
Extruding |
5% |
74.98 |
1459 |
6.47 |
269 |
1190 |
460 |
1650 |
|
Extruding |
10% |
87.65 |
1358 |
6.44 |
254 |
1104 |
454.5 |
1558.5 |
|
Extruding |
15% |
87.35 |
1162 |
6.17 |
252.5 |
909.5 |
477.5 |
1387 |
|
Extruding |
20% |
87.28 |
1014 |
6±0.00 |
249.5 |
897.5 |
480.5 |
1245 |
|
Extruding |
25% |
73.8 |
867.5 |
5.9 |
220 |
647.5 |
453.5 |
1101 |
*Data were expressed by Means±Standard Deviation (SD); values within the same column followed by the same letter are not significantly different at a 0.05 probability level.
CIE Lab color values
L*values
The L values of the composite flour were significantly affected by the pretreatment type and the substitution level of wheat flour, with a significant interaction between them. Figure (9) and Table (6) show that the control (quinoa seeds without pretreatment) and washing pretreatments did not significantly affect the L* values with all levels of substitution. In contrast, with roasting and extrusion pretreatments, the L* values decreased with increased substitution levels above 5%.
 |
Figure 9: Effect of different quinoa seeds pretreatment and wheat flour substitution levels with quinoa flour on composite flour L*values. |
a*values
a* values were significantly affected by the pretreatment type and the substitution levels, with a significant interaction between them. As seen in Figure (10) and Table (6), the roasting treatment had the highest effect in increasing the a* values with increasing substitution levels, followed by extrusion pretreatment. In contrast, the washing pretreatment and the control treatment (quinoa seeds without pretreatment) did not significantly affect the a* values with all substitution levels.
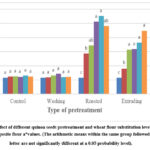 |
Figure 10: Effect of different quinoa seeds pretreatment and wheat flour substitution levels with quinoa flour on composite flour a*values. |
b*values
There were main effects by the pretreatment type and the substitution level of wheat flour, with a significant interaction between them on the b values. Figure (11) and Table (6) show that roasting and extrusion pretreatments significantly affect the b* values, where the b* values increased with increasing the substitution level. In contrast, control treatment (quinoa seeds without pretreatment) and washing pretreatment did not significantly affect the b* values with all levels of substitution used.
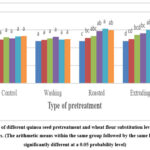 |
Figure 11: Effect of different quinoa seed pretreatment and wheat flour substitution levels on composite flour b*values. |
ΔEab* values
There were main effects by the pretreatment type and the substitution level of wheat flour, with a significant interaction between them on the ΔEab* values. Figure (12) and Table (6) show a significant interaction between the main effects of pretreatment type and wheat flour substitution level on the ΔEab* values, which ΔEab* values of composite flour with extruded and roasted Quinoa seeds significantly increased by increasing the substitution levels compared to other pretreatments. The ΔEab* values of composite flour with washed quinoa seeds and quinoa seeds without pretreatment did not significantly affect for all levels of substitution used.
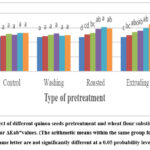 |
Figure 12: Effect of different quinoa seeds pretreatment and wheat flour substitution levels on composite flour ΔEab*values. |
Table 6: The effect of interaction between the type of pretreatment and levels of substitution on CIE lab color*
|
Interaction effect |
L* value |
a*value |
b*value |
ΔEab* value |
|
|
Pre. |
Sub. |
||||
|
Control |
0% |
91.86±0.48a |
0.58±0.03d |
11.86±0.37f |
0.19±0.58e |
|
Control |
5% |
91.04±0.48ab |
0.62±0.03d |
12.26±0.37ef |
0.8±0.58de |
|
Control |
10% |
90.16±0.48abc |
0.63±0.03d |
12.91±0.37cdef |
1.89±0.58cde |
|
Control |
15% |
90.57±0.48abc |
0.61±0.03d |
12.59±0.37ef |
1.39±0.58de |
|
Control |
20% |
89.43±0.48abcd |
0.66±0.03cd |
13.18±0.37cef |
2.64±0.58cde |
|
Control |
25% |
89.4±0.48abcd |
0.62±0.03d |
13.24±0.37bcdef |
2.69±0.58cde |
|
Washing |
0% |
91.86±0.48a |
0.58±0.03d |
11.86±0.37f |
0.19±0.58e |
|
Washing |
5% |
90.88±0.48abc |
0.59±0.03d |
12.2±0.37ef |
0.9±0.58de |
|
Washing |
10% |
89.96±0.48abc |
0.66±0.03cd |
12.58±0.37ef |
1.9±0.58cde |
|
Washing |
15% |
89.49±0.48abcd |
0.72±0.03cd |
12.99±0.37cdef |
2.56±0.58cde |
|
Washing |
20% |
89.84±0.48abc |
0.6±0.03d |
12.27±0.37ef |
1.92±0.58cde |
|
Washing |
25% |
89.36±0.48abcd |
0.61±0.03d |
12.4±0.37ef |
2.43±0.58cde |
|
Roasting |
0% |
91.86±0.48a |
0.58±0.03d |
11.86±0.37f |
0.19±0.58e |
|
Roasting |
5% |
90.19±0.48abc |
1.43±0.03b |
12.69±0.37cef |
1.96±0.58cde |
|
Roasting |
10% |
88.47±0.48bcde |
1.72±0.03ab |
13.25±0.37bcef |
3.71±0.58bcd |
|
Roasting |
15% |
86.25±0.48ef |
2.56±0.03a |
14.71±0.37abc |
6.47±0.58ab |
|
Roasting |
20% |
85.51±0.48f |
2.76±0.03a |
15.3±0.37ab |
7.44±0.58a |
|
Roasting |
25% |
86.32±0.48f |
2.4±0.03ab |
14.83±0.37abc |
6.46±0.58ab |
|
Extruding |
0% |
91.86±0.48a |
0.58±0.03d |
11.86±0.37f |
0.19±0.58e |
|
Extruding |
5% |
90.63±0.48abc |
0.9±0.03c |
12.43±0.37ef |
1.27±0.58de |
|
Extruding |
10% |
88.98±0.48bcde |
1.57±0.03ab |
13.6±0.37bcef |
3.41±0.58bcde |
|
Extruding |
15% |
88.59±0.48bcde |
1.59±0.03ab |
14.04±0.37bce |
3.98±0.58bcd |
|
Extruding |
20% |
88.23±0.48cdef |
1.82±0.03ab |
14.98±0.37abc |
4.86±0.58abc |
|
Extruding |
25% |
87.03±0.48def |
2.24±0.03ab |
16.26±0.37a |
6.66±0.58ab |
*Data were expressed by Means±Standard Deviation (SD); values within the same column followed by the same letter are not significantly different at a 0.05 probability level.
Effect of composite flour that contains wheat flour with different proportions of Quinoa seeds on bread quality
A Completely Randomized Design (CRD) factorial design was used to examine the effect of composite flour containing wheat flour with different proportions of 0, 10, and 20% of Quinoa seeds (without pretreatment) on the bread quality during storage at room temperature for three days.
CIE Lab color values for the top layer of bread
L* values, a* values, b* values, and ΔEab* values for the top layer of bread were not significantly affected by the storage time and levels of substitution, with no significant interaction between them. Values of CIE Lab color for the top layer of bread were presented in Appendix II.
CIE Lab color values for the bottom layer of bread
L* values, a* values, and b* values for the bottom layer of bread were not significantly affected by the storage time and levels of substitution, and interaction between them. Values of CIE Lab color for the bottom layer of bread are presented in Appendix II.
ΔEab* values
ΔEab* values of the bottom layer of bread were significantly affected only by the storage time with no significant interaction effect. Figure (13) shows ΔEab*value of the bottom of the bread significantly differed on the third day compared to the first and second day.
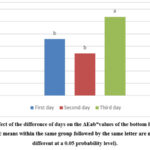 |
Figure 13: Effect of the difference of days on the ΔEab*values of the bottom layer of bread. |
Texture analysis
Double cycle compression (Texture Profile Analysis TPA)
Chewiness
The values of chewiness were significantly affected by the storage time, different levels of substitution, and interaction between them. As shown in Figure (14) and Table (7), the values of chewiness increased significantly by increasing the substitution levels with varying days, and the composite flour with a 20% substitution level had the highest value of chewiness on the third day (8234.2 g).
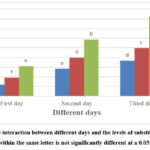 |
Figure 14: Effect of the interaction between different days and the levels of substitution on the chewiness values. |
The storage time, the different levels of substitution and the interaction between them had a significant impact on the values of hardness. The values of hardness significantly increased by increasing the substitution levels with varying days, and the composite flour with a substitution level of 20% had the highest value of hardness on the third day (Figure (15) and Table (7)).
Springiness
The values of Springiness were not significantly affected by the storage time, the different levels of substitution, and the interaction between them.
Resilience
The values of resilience were significantly affected by the storage time, different levels of substitution, and interaction between them. The values of resilience were not significantly different on the second day compared to the first day, and the composite flour with a 20% of substitution level had the highest value of resilience on the third day (Figure (15) and Table (7)).
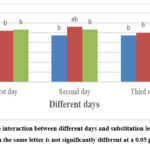 |
Figure 15: Effect of the interaction between different days and substitution levels on resilience values. |
Cohesiveness
The storage time, the different levels of substitution, and the interaction between them significantly affected the values of cohesiveness. The values of cohesiveness were not significantly affected by increasing the substitution levels on the first day, while the values of cohesiveness were most affected by an increase in the substitution level on the second and third days (Figure (16) and Table (7)).
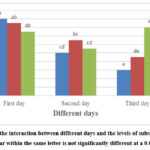 |
Figure 16: Effect of the interaction between different days and the levels of substitution on values of cohesiveness. |
Bread Stretchability
The storage time, the different levels of substitution, and the interaction between them significantly impacted the values of stretchability. The values of stretchability with increasing concentrations of quinoa seeds flour were significantly affected on the second and third days compared to the first days (Figure (17) and Table (7)).
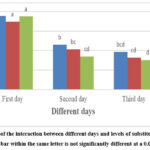 |
Figure 17: Effect of the interaction between different days and levels of substitution on values of stretchability. |
Breakpoint
The breakpoint values were significantly affected by the storage time, different levels of substitution, and the interaction between them. The values of the breakpoint significantly decreased on the second and third day, and the highest value of the breakpoint was for composite flour with a 20% on the first day (Figure (18) and Table (7)).
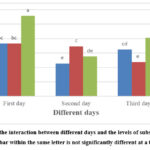 |
Figure 18: Effect of the interaction between different days and the levels of substitution on values of the breakpoint. |
Table 7: The effect of the interaction between storage days and the substitution levels on Texture Profile Analysis (TPA) parameters*
|
Interaction effect |
Chewiness (g) |
Hardness |
Springiness |
Resilience |
Cohesiveness |
Stretch Ability |
Breakpoint |
|
|
Day |
Sub. |
|||||||
|
1 |
0% |
1212 |
1377 |
0.99 |
0.51 |
0.84 |
18.85 |
731.2 |
|
1 |
10% |
1901.5 |
2253 |
0.99 |
0.52 |
0.83 |
17.39 |
730.6 |
|
1 |
20% |
3107 |
4322 |
0.96 |
0.53 |
0.81 |
18.74 |
1116.4 |
|
2 |
0% |
2830.1 |
3515 |
0.97 |
0.47 |
0.76 |
11.48 |
455.1 |
|
2 |
10% |
3977.4 |
4994 |
0.99 |
0.56 |
0.79 |
10.36 |
693.2 |
|
2 |
20% |
5856.9 |
6633 |
0.99 |
0.53 |
0.77 |
8.48 |
552.3 |
|
3 |
0% |
3658.1 |
4929 |
0.97 |
0.47 |
0.72 |
9.63 |
648.7 |
|
3 |
10% |
4969 |
6092 |
0.99 |
0.5 |
0.75 |
8.21 |
475.1 |
|
3 |
20% |
8234.2 |
9363 |
0.99 |
0.64 |
0.82 |
7.57 |
809 |
*Data were expressed by Means±Standard Deviation (SD); The values within the same column followed by the same letter are not significantly different at a 0.05 probability level.
Sensory analysis
The effect of the storage time and substitution level of wheat flour on the sensory scores of the final product of bread was studied.
Color
The sensory scores of the color of bread pieces were significantly affected only by the storage time and substitution levels of wheat flour, with no interaction between them (Figure (19) and Table (8)). The highest score of sensory evaluation for the color of bread was on the first day compared to the third day (Figure 19). There was a significant decrease in color score with increased substitution level regarding substitution level.
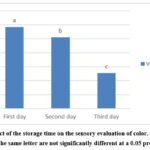 |
Figure 19: Effect of the storage time on the sensory evaluation of color. |
Texture
The sensory scores of the texture of bread pieces were significantly affected by the storage time, substitution levels of wheat flour, and the interaction between them (Figure (20) and Table (9)). The final product of bread containing composite flour with 20% quinoa seeds flour on the third day had the lowest texture evaluation scores. The texture of the bread was acceptable on the first day although substitution levels of wheat flour differed.
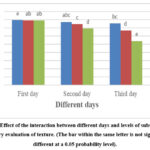 |
Figure 20: Effect of the interaction between different days and levels of substitution on |
Taste
There were main effects by the different days and substitution levels with significant interaction between them on the sensory scores of the taste of bread pieces (Figure (21) and Table (9)). Even after 24 hours, the final product of bread was acceptable up to 20% of quinoa seeds flour in the composite flour with no significant differences with the control treatment. The bread taste acceptance score decreased on the third day when the proportion of quinoa seeds flour reached 10% or more compared to the previous days.
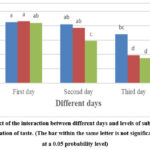 |
Figure 21: Effect of the interaction between different days and levels of substitution on the |
Overall quality
The sensory scores of the overall quality of bread pieces were significantly affected by the different days and substitution levels of wheat flour with the interaction between them (Figure (22) and Table (9)). The final product of bread had the highest score of sensory evaluation of overall quality on the first day, regardless of substitution level. The composite flour with 10% and 20% of quinoa flour on the third day differed from the control treatment.
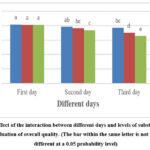 |
Figure 22: Effect of the interaction between different days and levels of substitution on the |
Table 8: Effect the substitution levels on sensory analysis scores of the Taboun bread*
|
Substitution level |
Color |
Texture |
Taste |
Overall quality |
|
0% |
8.07±0.a |
7.74±0.a |
7.96±0.a |
7.89±0.a |
|
10% |
7.90±0.b |
7.34±0.b |
7.68±0.b |
7.57±0.b |
|
20% |
7.73±0.c |
6.74±0.c |
7.48±0.c |
7.35±0.c |
*Data were expressed by Means±Standard Deviation (SD); values within the same column followed by the same letter are not significantly different at a 0.05 probability level
Table 9: Effect of storage days and substitution levels on sensory analysis scores of the Taboun bread*
|
Interaction Effect |
Color |
Texture |
Taste |
Overall quality |
|
|
Day |
Substitution level |
||||
|
1 |
0% |
8.2750± |
7.9500±0.a |
8.1250±0.a |
8.1500±0.a |
|
1 |
10% |
8.2000± |
7.9250±0.ab |
8.1500±0.a |
8.1000±0.a |
|
1 |
20% |
8.0500± |
7.9000±0.ab |
8.1000±0.ab |
8.1000±0.a |
|
2 |
0% |
8.2000± |
7.7250±0.abc |
8.0500±0.ab |
7.8500±0.ab |
|
2 |
10% |
8.0500± |
7.4500±0.c |
7.9250±0.ab |
7.6250±0.bc |
|
2 |
20% |
7.8250± |
6.9250±0.d |
7.4750±0.c |
7.3750±0.c |
|
3 |
0% |
7.7500± |
7.5500±0.bc |
7.7000±0.bc |
7.6750±0.bc |
|
3 |
10% |
7.4500± |
6.6500±0.d |
6.9750±0.d |
7.0000±0.d |
|
3 |
20% |
7.3250± |
5.4000±0.e |
6.8750±0.d |
6.5750±0.e |
Discussion
Effects of quinoa seed physical modifications on the pasting profile of composite flour containing wheat flour with different proportions of quinoa flour.
Due to its poor baking quality, which is caused by the absence of gluten, quinoa flour can only partially replace wheat flour in bread making, so the possibility of using quinoa flour inclusion in baked products up to 20-30% was mentioned15. In this experiment, there were three types of pretreatments for quinoa seeds and three levels of substitution. Quinoa seeds had bitter-tasting and toxic compounds (chiefly saponins) in the hull, this can be removed by dehulling/polishing and washing in most cases 9. Three pretreatments of quinoa seeds flour were used with different levels of substitution of wheat flour ranging from 0% to 25% to prepare composite flour. The process of roasting and extrusion can be able to lessen the bitter flavor imparted by saponins, and nutraceutical properties can be reduced by extrusion and roasting processes1. Quinoa seeds must be polished and washed before applying the process method to increase the acceptability of the finished product13. It was difficult to prepare and evaluate bread from each composite flour due to cost, time, and effort. Rapid evaluation techniques of pasting profiles using.
Rapid Visco Analyser (RVA) and color evaluation using a spectrophotometer were applied. The Rapid Visco Analyser (RVA) was widely used to assess the pasting characteristics of flour or starch10. The pasting parameters include pasting temperature, peak viscosity, trough, breakdown, set back, peak time, and final viscosity. The gelatinization of the starch granule occurs by an increase in viscosity and the variation in the composition of the starch and protein in the flour leads to a difference in the peak viscosity 12.
The significant effect of the interaction between pretreatment type and levels of substitution was observed, as increasing the levels of substitution for the different pretreatments decreased the Lparameter and increased the a, b, and ΔEab parameters. A decrease in NaOH and temperature lead to a reduction in lightness (L), resulting in a quinoa co-product with a lower starch content and a higher protein content11. These results are very close to the investigation of wheat-quinoa flour by Coţovanu, Ungureanu & Mironeasa (2021)3, in which the L* values significantly decreased and the a* values significantly increased in all composite flour when the level of quinoa flour increased.
Effect of composite flour that contains wheat flour with different proportions of Quinoa seeds on the bread quality
There were many studies investigating the impact of substitution levels of quinoa flour on the quality of bread. A study by stikic (2012)15 investigated the impact of the substitution of quinoa flour on the nutritional and functional properties of resulting products and it showed the addition 20% of quinoa flour increased the contents of protein, essential amino acids lysine, methionine, and histidine in the resulting bread compared to wheat flour. In this experiment, the effect of incorporating of the different concentrations of quinoa seeds flour with wheat flour and the storage days on the quality of Taboun bread was studied.
Instrumental color analysis
Instrumental color analysis of the top layer of taboun bread showed that the substitution of wheat flour with quinoa flour was not affected significantly the total color. ΔEab* values of the bottom layer of Taboun bread were significantly affected only by the passage of days, and the ΔEab* values of the bottom layer of taboon bread were significantly higher on the third day compared to the first and second days.
Instrumental texture analysis
Increasing levels of substitution of wheat flour and differing days resulted in significantly increased Texture Profile Analysis (TPA) parameters including resilience, hardness, and chewiness, and the values of cohesiveness were significantly decreased. A study by Wang et al., (2015)21 showed the same results, which increased the levels of quinoa flour to various certain extents and caused a change in texture profiles (hardness, cohesiveness, and chewiness) of the bakery products.
Sensory Analysis
The results showed that the level of acceptance of sensory characteristics was good up to 20% of quinoa seeds flour in the composite flour. Stikic et al. (2012)15 reported sensory characteristics of evaluated bread were excellent up to 20% substitution level of wheat flour. According to Calderelli et al2, quinoa bread was well accepted as evaluated by sensory panelists. Additionally, the results of the current study showed that composite flour containing 20% quinoa flour had the lowest significant taste compared to other treatments. The proportion of 20-30% quinoa seed flour is possible in baked products, and the bitter taste recorded at high levels of quinoa flour is likely due to a lack of processing of the seeds leaving some of the hull15.
Conclusions
The use of pre-processed quinoa seeds with wheat flour substitution significantly impacted pasting and color parameters. Rapid Visco Analyser (RVA) evaluated composite flour with different levels of quinoa flour. The washing treatment was the best formula. The Texture Profile Analysis (TPA) parameters were significantly affected by the substitution levels. Up to 10% substitution had no significant effect on TPA parameters. CIE Lab color values for top and bottom layers were not significantly affected by storage days or quinoa seed concentrations.
Recommendation
Further studies to understand the qualities of quinoa may help to make the desired nutritious foods of quinoa that meet consumers’ needs.
Further studies to investigate chemical parameters of wheat-quinoa flour such as protein content, ash, fat, and dietary fibers.
The study recommends that studies be carried out to further verify the role of physical treatments of quinoa seeds in improving the characteristics of the finished product of Taboun bread.
Conflict of Interest
The authors declare that there is no actual or potential conflict of interest.
Funding Sources
There are no funding sources.
References
- Brady K, Ho CT, Rosen RT, Sang S, Karwe MV. Effects of processing on the nutraceutical profile of quinoa. Food Chemistry. 2007; 100(3):1209-1216. doi:https://doi.org/10.1016/j.foodchem.2005.12.001
CrossRef - Calderelli VAS, Benassi M de T, Visentainer JV, Matioli G. Quinoa and flaxseed: potential ingredients in the production of bread with functional quality. Brazilian Archives of Biology and Technology. 2010; 53(4):981-986. doi:https://doi.org/10.1590/s1516-89132010000400029
CrossRef - Coţovanu I, Ungureanu-Iuga M, Mironeasa S. Investigation of quinoa seeds fractions and their application in wheat bread production. Plants. 2021;10 (10):2150. doi:https://doi.org/10.3390/ plants10102150
CrossRef - El Hazzam K, Hafsa J, Sobeh M, et al. An Insight into Saponins from quinoa (chenopodium quinoa willd): A Review. Molecules. 2020;25(5):1059. doi:https://doi.org/10.3390/molecules25051059
CrossRef - El-Sohaimy SA, Shehata MG, Mehany T, Zeitoun MA. Nutritional, physicochemical, and sensorial evaluation of flat bread supplemented with quinoa flour. International Journal of Food Science. 2019;2019:1-15. doi:https://doi.org/10.1155/2019/4686727
CrossRef - Henry CJ. Functional foods. European Journal of Clinical Nutrition. 2010;64(7):657-659. doi:https://doi.org/10.1038/ejcn.2010.101
CrossRef - Ng SC, Anderson A, Coker J, Ondrus M. Characterization of lipid oxidation products in quinoa (Chenopodium quinoa). Food Chemistry. 2007; 101(1):185-192. doi:https://doi.org/10.1016/j. foodchem.2006. 01.016
CrossRef - Nickel J, Spanier LP, Botelho FT, Gularte MA, Helbig E. Effect of different types of processing on the total phenolic compound content, antioxidant capacity, and saponin content of Chenopodium quinoa Willd grains. Food Chemistry. 2016; 209:139-143. doi:https://doi.org/10.1016/j.foodchem.2016.04.031
CrossRef - Nowak V, Du J, Charrondière UR. Assessment of the nutritional composition of quinoa (Chenopodium quinoa Willd.). Food Chemistry. 2016; 193:47-54. doi:https://doi.org/10.1016/j.foodchem.2015.02.111
CrossRef - Martínez, M. M. (2015). Applications of the Rapid Visco Analyser (RVA) in the Food Industry: A broader view. Perten Science World.
- Ortiz-Gómez V, Fernández-Quintero A, Fernando D, José Javier Bravo-Gómez, José Fernando Solanilla-Duque. Physicochemical Characterization of Quinoa (Chenopodium quinoa cv. Nariño) Co-products Obtained by Wet Milling. Frontiers in sustainable food systems. 2022;6. doi:https://doi.org/10.3389/fsufs.2022.851433
CrossRef - Roa-Acosta DF, Bravo-Gómez JE, García-Parra MA, Rodríguez-Herrera R, Solanilla-Duque JF. Hyper-protein quinoa flour (Chenopodium Quinoa Wild): Monitoring and study of structural and rheological properties. LWT. 2020; 121:108952. doi:https://doi.org/10.1016/ j.lwt.2019.108952
CrossRef - Ruales J, Nair BM. Content of fat, vitamins and minerals in quinoa (Chenopodium quinoa, Willd) seeds. Food Chemistry. 1993; 48(2):131-136. doi:https://doi.org/10.1016/0308-8146(93)90047-j
CrossRef - Sayed-Ahmad B, Talou T, Straumite E, et al. Evaluation of Nutritional and Technological Attributes of Whole Wheat Based Bread Fortified with Chia Flour. Foods. 2018;7(9):135. doi:https://doi.org/ 10.3390/foods7090135
CrossRef - Stikic R, Glamoclija D, Demin M, et al. Agronomical and nutritional evaluation of quinoa seeds (Chenopodium quinoa Willd.) as an ingredient in bread formulations. Journal of Cereal Science. 2012; 55(2):132-138. doi:https://doi.org/10.1016/j.jcs.2011.10.010
CrossRef - Tang Y, Li X, Zhang B, Chen PX, Liu R, Tsao R. Characterisation of phenolics, betanins and antioxidant activities in seeds of three Chenopodium quinoa Willd. genotypes. Food Chemistry. 2015;166:380-388. doi:https://doi.org/10.1016/j.foodchem.2014.06.018
CrossRef - Tang Y, Tsao R. Phytochemicals in quinoa and amaranth grains and their antioxidant, anti-inflammatory, and potential health beneficial effects: a review. Molecular Nutrition & Food Research. 2017;61(7):1600767. doi:https://doi.org/10.1002/mnfr.201600767
CrossRef - Tarade KM, Singhal RS, Jayram RV, Pandit AB. Kinetics of degradation of saponins in soybean flour (Glycine max.) during food processing. Journal of Food Engineering. 2006;76(3):440-445. doi:https://doi.org/10.1016/j.jfoodeng.2005.05.044
CrossRef - Vilche C, Gely M, Santalla E. Physical Properties of Quinoa Seeds. Biosystems Engineering. 2003;86(1):59-65. doi:https://doi.org/ 10.1016/s1537-5110(03)00114-4
CrossRef - Vega-Gálvez A, Miranda M, Vergara J, Uribe E, Puente L, Martínez EA. Nutrition facts and functional potential of quinoa (Chenopodium quinoa willd.), an ancient Andean grain: a review. Journal of the Science of Food and Agriculture. 2010;90(15):2541-2547. doi:https://doi.org/10.1002/jsfa.4158
CrossRef - Wang S, Opassathavorn A, Zhu F. Influence of quinoa flour on quality characteristics of cookie, bread and Chinese steamed bread: Quinoa bakery products. J Texture Stud. 2015;46(4):281-292. doi:10.1111/jtxs.12128
CrossRef - Xue P, Zhao L, Wang Y, Hou Z, Zhang F, Yang X. Reducing the damage of quinoa saponins on human gastric mucosal cells by a heating process. Food Science & Nutrition. 2019;8(1):500-510. doi:https://doi.org/10.1002/fsn3.1332
CrossRef
Appendix I
Calculated F. values for different effects in the first and second experiment
Table 10: Calculated F values for the main and interaction effects in the first experiment
|
Parameters |
F. value |
P>F |
|
|
Pasting temperature |
|
|
|
|
|
Effect of pretreatments |
1.56 |
0.2253 |
|
|
Effect of substitution level |
0.56 |
0.6612 |
|
|
Effect of the interaction |
0.56 |
0.6177 |
|
Peak Time |
|
|
|
|
|
Effect of pretreatments |
3.44 |
0.0328 |
|
|
Effect of substitution level |
80.77 |
<0.001 |
|
|
Effect of the interaction |
1.88 |
0.0805 |
|
Peak viscosity |
|
|
|
|
|
Effect of pretreatments |
59.21 |
<0.001 |
|
|
Effect of substitution level |
97.08 |
<0.001 |
|
|
Effect of the interaction |
6.51 |
<0.001 |
|
Trough |
|
|
|
|
|
Effect of pretreatments |
36.49 |
<0.0001 |
|
|
Effect of substitution level |
69.48 |
<0.0001 |
|
|
Effect of the interaction |
3.83 |
0.0017 |
|
Breakdown |
|
|
|
|
|
Effect of pretreatments |
3.57 |
0.0290 |
|
|
Effect of substitution level |
4.08 |
0.0080 |
|
|
Effect of the interaction |
0.56 |
0.8773 |
|
Setback |
|
|
|
|
|
Effect of pretreatments |
21.58 |
<0.0001 |
|
|
Effect of substitution level |
22.82 |
<0.0001 |
|
|
Effect of the interaction |
3.15 |
0.0060 |
|
Final viscosity |
|
|
|
|
|
Effect of pretreatments |
202.82 |
<0.0001 |
|
|
Effect of substitution level |
89.61 |
<0.0001 |
|
|
Effect of the interaction |
20.79 |
<0.0001 |
|
L*value |
|
|
|
|
|
Effect of pretreatments |
29.05 |
<0.0001 |
|
|
Effect of substitution level |
38.61 |
<0.0001 |
|
|
Effect of the interaction |
3.15 |
0.006 |
|
a*value |
|
|
|
|
|
Effect of pretreatments |
302.49 |
<0.0001 |
|
|
Effect of substitution level |
63.80 |
<0.0001 |
|
|
Effect of the interaction
|
16.07 |
<0.0001 |
|
b*value |
|
|
|
|
|
Effect of pretreatments |
25.34 |
<0.0001 |
|
|
Effect of substitution level |
24.28 |
<0.0001 |
|
|
Effect of the interaction |
4.14 |
0.001 |
|
ΔEab*value |
|
|
|
|
|
Effect of pretreatments |
33.31 |
<0.0001 |
|
|
Effect of substitution level |
35.89 |
<0.0001 |
|
|
Effect of the interaction |
3.81 |
0.002 |
|
Chewiness |
|
|
|
|
|
Effect of days |
1639.05 |
<0.0001 |
|
|
Effect of substitution level |
1335.49 |
<0.0001 |
|
|
Effect of the interaction |
86.10 |
<0.0001 |
|
Hardness |
|
|
|
|
|
Effect of days |
1011.48 |
<0.0001 |
|
|
Effect of substitution level |
741.22 |
<0.0001 |
|
|
Effect of the interaction |
19.08 |
<0.0001 |
|
Resilience |
|
|
|
|
|
Effect of days |
1.32 |
<0.313 |
|
|
Effect of substitution level |
16.85 |
<0.001 |
|
|
Effect of the interaction |
8.99 |
<0.003 |
|
Cohesiveness |
|
|
|
|
|
Effect of days |
62.12 |
<0.0001 |
|
|
Effect of substitution level |
10.65 |
0.004 |
|
|
Effect of the interaction |
24.12 |
<0.0001 |
|
Stretchability |
|
|
|
|
|
Effect of days |
374.87 |
<0.0001 |
|
|
Effect of substitution level |
11.01 |
0.004 |
|
|
Effect of the interaction |
3.63 |
0.050 |
|
Breakpoint |
|
|
|
|
|
Effect of days |
168.96 |
<0.0001 |
|
|
Effect of substitution level |
102.40 |
<0.0001 |
|
|
Effect of the interaction |
61.24 |
<0.0001 |
Appendix 2: Effect the storage time, substitution levels, and interaction between them on the CIE Lab color for top and bottom layers of bread
Table 11: Effect the storage time, substitution levels, and interaction between them on the CIE Lab color for the bottom layer of bread
|
|
L*values |
a*values |
b*values |
Eab* values |
|
Factor |
|
|
|
|
|
Days |
||||
|
First day |
38.05±2.81 |
4.157±0.334 |
16.23±1.02 |
9.14b±1.30 |
|
Second day |
38.25±2.81 |
3.972±0.334 |
15.94±1.02 |
6.83b±1.30 |
|
Third day |
35.47±2.81 |
3.373±0.334 |
14.75±1.02 |
12.76a±1.30 |
|
Substitution level |
|
|
|
|
|
0% |
38.19±2.81 |
3.974±0.334 |
16.33±1.02 |
7.95±1.30 |
|
10% |
35.53±2.81 |
3.644±0.334 |
15.04±1.02 |
11.00±1.30 |
|
20% |
38.04±2.81 |
3.883±0.334 |
15.55±1.02 |
9.78±1.30 |
|
Day*substitution level |
|
|
|
|
|
1*0% |
37.56±4.86 |
4.627±0.578 |
17.04±1.76 |
7.71±2.25 |
|
1*10% |
38.59±4.86 |
3.472±0.578 |
15.71±1.76 |
10.51±2.25 |
|
1*20% |
37.99±4.86 |
4.373±0.578 |
15.95±1.76 |
9.22±2.25 |
|
2*0% |
40.03±4.86 |
3.698±0.578 |
16.48±1.76 |
5.11±2.25 |
|
2*10% |
33.88±4.86 |
3.895±0.578 |
14.34±1.76 |
8.77±2.25 |
|
2*20% |
40.84±4.86 |
4.322±0.578 |
16.99±1.76 |
6.61±2.25 |
|
3*0% |
36.98±4.86 |
3.598±0.578 |
15.46±1.76 |
11.04±2.25 |
|
3*10% |
34.13±4.86 |
3.567±0.578 |
15.06±1.76 |
13.71±2.25 |
|
3*20% |
35.29±4.86 |
2.955±0.578 |
13.71±1.76 |
13.52±2.25 |
Accepted on: 09 Aug 2023
Second Review by: Abida Jabeen and Anamika Das
Final Approval by: Dr. Rajesh Jeewon


Web of Science Coverage
Emerging Sources Citation Index (ESCI)
2024 Journal Impact Factor: 1.1
Scopus Journal Metrics
CiteScore 2025: 2.6
CiteScore Details
Sustainable Nutrition: Food Systems, Nutrient Retention, and Public Health Impact
![]()
This journal is a member of, and subscribes to the principles of, the Committee on Publication Ethics (COPE)


