Study on Tea Consumption Behavior during the Covid-19 Pandemic and the Analysis of the Antioxidant Activity and Bioactive Compounds of Flavoring Ingredients of Tea
 , Farhana Easmin1, Sakirul Islam Bhuiyan1, Md. Abdul Alim1, Shamoli Akter1, Md. Jahangir Alam1*, Md. Nannur Rahman1 and Md. Azizul Haque1
 1Department of Food Technology and Nutritional Science (FTNS), Mawlana Bhashani Science and Technology University (MBSTU), Santosh, Tangai, Bangladesh.
2Food Science, Department of Life Technology, University of Turku, Turun yliopisto, Finland.
Corresponding Author E-mail: jahangir@mbatu.ac.bd
DOI : http://dx.doi.org/10.12944/CRNFSJ.11.1.33
Download this article as:
![]()
Tea is one of the most popular and oldest beverages available in many varieties and the use of different flavoring ingredients is becoming more common. The present study aimed to examine tea consumption behavior during the COVID-19 pandemic and analyzed the bioactive compounds of tea flavoring ingredients. At first, a cross-sectional study was carried out with 140 randomly selected participants to determine tea consumption patterns and data was collected through face-to-face interviews. Then 2,2-diphenyl-1-picrylhydrazyl (DPPH) test, the Folin-Ciocalteu technique, and the quercetin method were used to assess antioxidant activity, total phenolic content (TPC), and total flavonoid content (TFC) of tea flavoring ingredients. The study found that 57.86% of the participants increased their tea consumption during the COVID-19 pandemic, whereas 22.80% increased their tea consumption by at least one more cup per day. It was also found that ginger was the most popular (29.5%) among fifteen tea flavoring agents. By analyzing tea flavoring ingredients, the maximum antioxidant activity found in cinnamon was 87%, and lemon leaves had the lowest, which was 60%. On a dry weight basis, the TPC of the tea flavoring components ranged from 36.52 mg GAE/g for cloves to 9.62 mg GAE/g for ginger. The maximum TFC was also found in clove with 13.68 mg QE/g, and moringa was the second highest with 12.26 mg GAE/g. The antioxidant activity of flavoring compounds has a significant correlation with TPC and TFC. Overall, tea consumption behavior with tea flavoring ingredients increased during the COVID-19 pandemic situation. Tea with flavoring ingredients may be one of the best dietary sources of antioxidants, TPC, and TFC which are important for strengthening the immune system and controlling different physiological and metabolic disorders.
KEYWORDS:Antioxidant activity; Bioactive compound; COVID-19; Immunity; Tea
Introduction
Tea is one of the most consumed non-alcoholic beverages and two-thirds of the world’s population drinks tea every morning.1 The active ingredient in tea, especially black and green tea, is catechin, which can act as a powerful antioxidant that prevents toxic effects and diseases in the body2,3 and play a crucial role in most biological activities.4 Green tea, in particular, has a higher antioxidant potential due to the presence of epicatechin gallate and epigallocatechin gallate contents that boost human health by protecting against antibacterial activities.5 In Bangladesh, tea is very popular among all ages of people, especially in the morning and afternoon time.6 People mostly drink tea with different flavoring ingredients like ginger, lemon leaves, orange peel, herbs, and spices to get an intrinsic flavor.7 Since the dawn of civilization, spices and herbs have been utilized to improve flavor and color in food. In addition, spices and herbs contain antioxidants and health-promoting phytochemicals that reduce free radicals and protect against oxidative stress.8 Apart from that, coronavirus, is an infectious disease that spread worldwide caused by the SARS-CoV-2 virus.9 The virus increases illness in the lungs and affects the respiratory system.10 One of the ways to fight this virus is to strengthen the body’s immune system. Bioactive compounds found in various herbs and spices have antiviral properties.11 Tea is recognized for its antioxidant effects, but adding herbs, spices, and other flavorful elements to tea may be a viable strategy to combat viruses and enhance the immune system.12 However, research on bioactive compounds of locally consumed tea flavorings is scarce. In Bangladesh, the consumption of tea with herbal ingredients is increasing daily, especially COVID-19 pandemic. Therefore, the goal of this research was to investigate more about tea consumption behavior during the COVID-19 pandemic and evaluate the antioxidant activity and bioactive compounds of flavoring substances in tea.
Methodology
Design of the Study
This study was designed to examine the tea-drinking behavior during the COVID-19 pandemic and evaluate the antioxidant activity, TPC, and TFC of regionally used tea flavorings.
Study Population and Study Area
The research was carried out in Tangail Sadar Upazila as a descriptive population-based analysis. Data were collected from Powro Uddan, the New Bus Stand, the Old Bus Stand, the Baby Stand, and Santosh Charabari of Tangail district, in Bangladesh. A stratified random sampling technique was used to collect 140 samples during the COVID-19 pandemic. Fifteen distinct flavorings were tested in the research lab of the Department of Food Technology and Nutritional Science (FTNS) at Mawlana Bhashani Science and Technology University (MBSTU), Bangladesh.
Questionnaire Development and Data Collection
A questionnaire with closed and open questions was developed to collect crucial demographic, socioeconomic, nutritional, and tea intake data. To make it as simple as possible to gather and collect information, all questions have been developed, updated, and rearranged. All the participants were given a statement and requested to sign a consent form before starting the interviews.
Antioxidant Activity Determination
The antioxidant activity of the extract samples was measured using the 2,2-diphenyl-1-picrylhydrazyl (DPPH) radical scavenging technique.13 In methanol, oxidized DPPH has taken on a deep purple color. The absorbance was measured at 515 nm and the percent inhibition of the substance was calculated. In shortly, two grams of the sample were weighed and placed in a 10 mL methanol beaker. The substance was subsequently extracted for 4 h using a magnetic stirrer. After that, the extracts were filtered through number 42 What-Man filter paper. After that, the extract (50 µL) was mixed with the DPPH solution (3 mL) and stored in a dark place for 15 minutes. In a spectrophotometer at 515 nm, the absorbance of a freshly produced 0.002% DPPH solution in methanol and sample extract with DPPH solution was measured. The extract’s % inhibition of DPPH was estimated using the formula below:
![]()
Total Phenolic Content (TPC) Determination
To assess the TPC of all herbs and spices, the Folin-Ciocalteu (FCC) method was utilized.14 10% gallic acid solution (10 mg/mL), was prepared by liquefying gallic acid (1 g) in methanol (100 mL). A standard gallic acid curve (Figure 1) was generated by diluting a standard gallic acid solution (0.1, 0.5, 1.0, 2.5, and 5 mg/mL) in methanol. The diluted gallic acid solution (100 µL) was then combined with 500 µL of water before being mixed with 100 µL of FCC reagent. After 6 minutes of standing time, the mixture was diluted using 500 µL of purified water and 1 mL of 7% sodium carbonate. After 90 min, using a spectrophotometer, the absorbance was measured at 760 nm. All samples were subjected to the same technique and the same procedure in triplicates. Gallic acid equivalents (mg GAE/g) were used to quantify the TPC of herbs and spices.
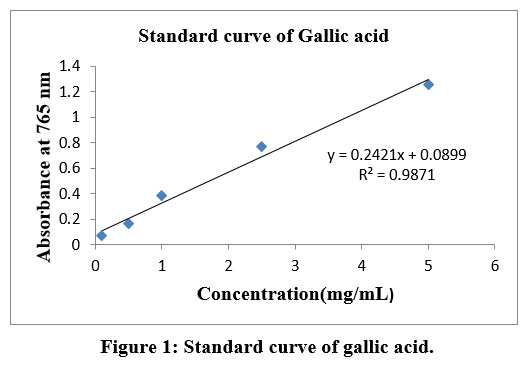 |
Figure 1: Standard curve of gallic acid. |
Total Flavonoid Content (TFC) Determination
Following an aluminum chloride complexing assay, the TFC of the sample was measured.15 At first, the standard solution (1% quercetin solution) was prepared by dissolving 1 g of quercetin in 100 mL of methanol. To generate a quercetin calibration curve (Figure 2) dilutions of the standard quercetin solution were produced in methanol at concentrations of 0.1, 0.5, 1.0, 2.5, and 5 mg/mL. Each quercetin dilution was prepared by mixing 500 µL distilled water and 100 µL sodium nitrate and then treated with a 10% strength aluminum chloride (150 µL) solution. After 5 minutes, 200 µL of a 1 M NaOH solution was added to the mixture and measured the absorbance at 510 nm. The same procedure was used on all samples. TFC was measured using quercetin equivalents (mg QE/g).
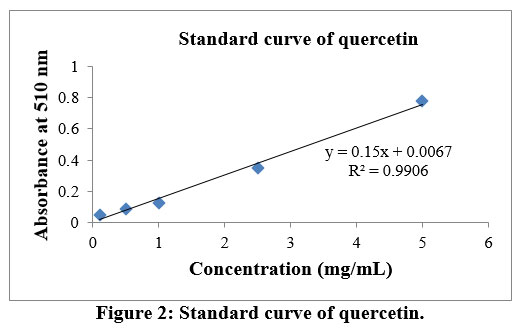 |
Figure 2: Standard curve of quercetin. |
Statistical Analysis
The data was collected, encoded, and uploaded to a computer for analysis using the SPSS program version 18.0. (SPSS 18.0, Chicago, IL, USA). Both category and numerical variables were described using descriptive statistics. Duncan Multiple Range Test (DMRT) of One-Way ANOVA at the significance level of 5% (p<0.05) was used to determine significant differences among the samples. Differences were considered to be significant at p< 0.05.
Results
Socio-Demographic and Anthropometric Assessment of the Participants
Demographic and socioeconomic information revealed that the majority of participants (68.60%) were male, with 53.57% being students (Table 1). The rest of the participants were from a variety of occupations, like job holders (17.86%), businesspersons (9.28%), and some from other professions (6.43%). Based on body mass index (BMI) measurement, the highest number of respondents were in the normal-weight group category (77.86%), and the second highest number of respondents (13.57%) were in the pre-obesity category. In the obese category, 2.14% of respondents were in the obesity class I group, and less than one percent were in class II obese group.
Table 1: Socio-demographic characteristics and anthropometric assessment of the respondents.
| Characteristics | Frequency | Percentage (%) | |
| Gender | Male | 96 | 68.60 |
| Female | 44 | 31.40 | |
| Total | 140 | 100 | |
| Occupation | Day labor | 18 | 12.86 |
| Job holder | 25 | 17.86 | |
| Businessperson | 13 | 9.28 | |
| Student | 75 | 53.57 | |
| Others | 9 | 6.43 | |
| Total | 140 | 100 | |
| Body Mass Index (BMI) | Underweight | 8 | 5.72 |
| Normal weight | 109 | 77.86 | |
| Pre-obesity | 19 | 13.57 | |
| Obese class I | 3 | 2.14 | |
| Obese class II | 1 | 0.71 | |
| Obese class III | 0 | 0 | |
| Total | 140 |
100 |
|
Tea Consumption Behavior of the Participants
Tea consumption patterns of the participants during the COVID-19 situation are given in Table 2. Among 140 participants, 70% consumed 1-3 cups of tea per day and 9.3% consumed more than 6 cups of tea per day. Most of the participants (63%) preferred to drink tea at the tea shops, and 26.40% preferred to drink tea at home. Besides, most of them (63.60%) preferred to consume black tea which is popularly known as “Rong chaa” in Bangladesh, and only 4.30% preferred flavored tea (Table 2).
Table 2: Tea consumption behaviors of the participants.
| Characteristics | Frequency | Percentage (%) | |||
| 1-3 | 98 | 70.00 | |||
| 4-5 | 29 | 20.70 | |||
| 6 or more | 13 | 9.30 | |||
| Total | 140 | 100 | |||
| Tea shops | 88 | 62.90 | |||
| Home | 37 | 26.40 | |||
| Workplace | 14 | 10.00 | |||
| Restaurants | 1 | 0.70 | |||
| Total | 140 | 100 | |||
| Black tea (Rong chaa) | 89 | 63.60 | |||
| Green tea | 10 | 7.10 | |||
| Milk tea | 33 | 23.60 | |||
| Flavored tea | 6 | 4.30 | |||
| Others | 2 | 1.40 | |||
| Total | 140 | 100 | |||
The Choice of Tea Flavoring Ingredients
Table 3 represented that ginger was the most preferred flavoring ingredient (29.5%) followed by lemon leaf (11%), bay leaf (11%), clove (10.7%), lemon peel (7.6%), cinnamon (6.6%), cardamon (5.9%), and basil leaf (5.1%), etc.
Table 3: Preference for tea flavoring ingredients
| Flavoring Ingredients | Frequency | Percentage | Percentage of case |
| Ginger | 121 | 29.50 | 91.70 |
| Clove | 44 | 10.70 | 33.30 |
| Orange-peel | 7 | 1.70 | 5.30 |
| Black cumin | 11 | 2.70 | 8.30 |
| Basil leaf | 21 | 5.10 | 15.90 |
| Lemon leaf | 45 | 11.00 | 34.10 |
| Mint | 12 | 2.90 | 9.10 |
| Cardamom | 24 | 5.90 | 18.20 |
| Lemon peel | 31 | 7.60 | 23.50 |
| Black pepper | 10 | 2.40 | 7.60 |
| Cinnamon | 27 | 6.60 | 20.50 |
| Guava leaf | 6 | 1.50 | 4.50 |
| Bay leaf | 45 | 11.00 | 34.10 |
| Moringa leaf | 2 | 0.50 | 1.50 |
| Amla | 4 | 1.00 | 3.00 |
| Total | 410 | 100.0 |
310.60 |
Reasons behind the Consumption of Flavoring Ingredients in Tea
Most of the participants (54.80%) believed that flavoring ingredients used in tea increase immunity, while 18.50% took flavoring ingredients in tea as stress releasers, 16.10% as a habit, and 15.30% as taste enhancers (Table 4).
Table 4: Reasons behind the consumption of flavoring ingredients in tea.
| Reasons | Frequency | Percentage | Percentage of cases |
| Increase immunity | 86 | 54.80 | 69.40 |
| Taste | 19 | 12.10 | 15.30 |
| Availability | 2 | 1.30 | 1.60 |
| Habitual | 20 | 12.70 | 16.10 |
| Stress-releaser | 23 | 14.60 | 18.50 |
| Other reasons | 7 | 4.50 | 5.60 |
| Total | 167 | 100.00 | 126.60 |
Increasing Tea Consumption during the COVID-19 Pandemic
About 57.86% of the participants have increased their tea consumption by at least 1 to more than 4 cups since the non-covid-19 period. Among them, 18.60% have increased consumption by 2 cups more during the pandemic and 22.80% have increased consumption by at least one cup more throughout the pandemic.
Table 5: Increasing tea consumption during the COVID-19 pandemic
| Number of increased tea consumption | Frequency | Percentage |
| 1 more | 32 | 22.80 |
| 2 more | 26 | 18.60 |
| 3 more | 12 | 8.50 |
| 4 more | 4 | 2.90 |
| >4 | 7 | 5.00 |
| Total | 81 | 57.86 |
| No change in consumption | 59 | 42.14 |
| Total | 140 | 100 |
Antioxidant Activity, TPC, and TFC
A significant variation in the antioxidant activity of the samples was found in this study (Table 6). The highest antioxidant activity (87%) was found in cinnamon whereas the lowest antioxidant activity (60%) was found in lemon. TPC in various flavoring ingredients extracts was found to be fairly high. Among all the extracts analyzed, clove extract contained the highest TPC of 36.52 mg GAE/g on a dry weight basis (dwb), whereas ginger had the lowest value of 9.62 mg GAE/g (dwb). The highest TFC was found in clove with 13.68 mg QE/g and moringa with 12.26 mg GAE/g. Other samples also showed a considerable amount of TFC. Table 6 also showed that antioxidant activity, TPC, and TFC of all tea flavoring agents were significantly (p<0.05) different from each other.
Table 6: Antioxidant activity, TPC, and TFC of flavoring ingredients
| Tea flavoring ingredients | Antioxidant activity (%) | TPC (mg GAE/g) | TFC (mg QE/g) |
| Ginger | 68±1.234a | 9.62±0.433b | 2.34±0.184c |
| Clove | 84±1.055a | 36.52 ±1.299b | 13.78±0.103c |
| Orange peel | 83±3.462a | 32.53±0.726b | 6.48±0.228c |
| Black cumin | 81±2.765a | 27.00±1.036b | 9.42±0.243c |
| Basil leaves | 75±1.325a | 21.62±1.514b | 9.17±0.369c |
| Lemon leaf | 60±0.786a | 12.87±0.781b | 1.45±0.224c |
| Mint | 66±3.655a | 14.84±0.568b | 2.88±0.509c |
| Cardamom | 72±2.423a | 10.89±1.327b | 3.67±0.115c |
| Lemon peel | 85±2.643a | 21.66±0.482b | 7.47±0.222c |
| Black pepper | 61±1.634a | 16.32±0.733b | 2.36±0. 272c |
| Cinnamon | 87±2.543a | 26.93±0.918b | 9.96±0.063c |
| Guava leaf | 69±1.753a | 13.65±1.010b | 4.64±0.219c |
| Bay leaf | 82±2.684a | 29.36±1.020b | 8.64±0.129c |
| Moringa | 82±1.794a | 32.70±0.835b | 12.26±0.321c |
| Amla | 73±2.468a | 24.88±0.953b | 9.80±0.048c |
Data expressed as Mean±SEM. Values in the same row with different superscripts are statistically significant from each other (p < 0.05).
Correlation Among Antioxidant Activity, TPC, and TFC
Figure 3 and Table 7 depict the relationship among the sample’s TPC, TFC, and antioxidant activities. At a 95% confidence level, the correlation coefficient values for TPC (R2=0.7316) and TFC (R2=0.6662) were observed.
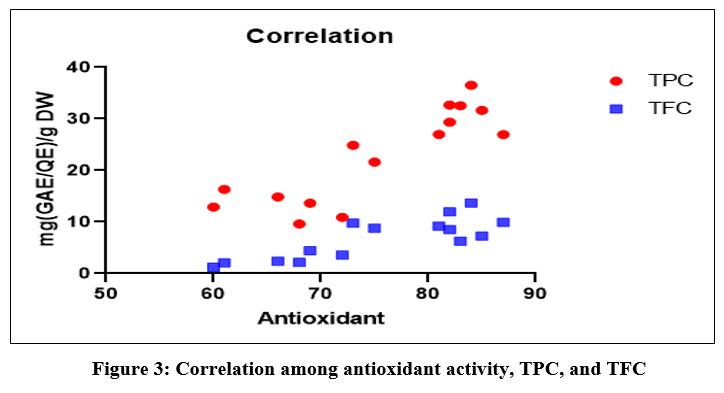 |
Figure 3: Correlation among antioxidant activity, TPC, and TFC |
Table 7: Correlation significance among antioxidant, TPC and TFC
| Criteria | Antioxidant vs TPC | Antioxidant vs TFC |
| r | 0.8553 | 0.8162 |
| R squared | 0.7316 | 0.6662 |
| P (two-tailed) | 0.0001 | 0.0002 |
| Significant (p<0.05) | Yes | Yes |
| Number of XY Pairs | 15 | 15 |
When the antioxidant activity of the sample was compared to the TPC of the sample, a significant connection (p<0.05) was found. When comparing the antioxidant activity and TFC, a comparable result was obtained (p<0.05).
Discussion
The purpose of this study was to observe the tea consumption behavior during the COVID-19 pandemic and after that, the antioxidant activity of ingredients used in tea as a flavoring ingredient was analyzed. According to the findings, the majority of the respondents were male students who preferred to drink one to three cups of tea while sitting in a tea stall. During the pandemic, most people stayed at home due to the lockdown; however, young people and students sometimes spend their time in the tea stall. The preference of tea flavoring diverges from one respondent to another, but typically ginger was the top choice of tea flavoring among clove, orange peel, black cumin, basil leaf, lemon leaf, mint, cardamom, lemon peel, black pepper, cinnamon, guava leaf, bay leaf, and moringa leaf. In the Indian subcontinent, most people like different types of herbs and spices in tea, and the present study showed that the choice of flavoring ingredients used in tea varied from one respondent to another; however, ginger, bay leaf, lemon leaf, clove were the top choices in their tea which is similar to the previous study.16 The majority of the respondents believed that tea flavoring ingredients were immune-boosting ingredients, and others have taken them due to taste preference. The immune system protects against different types of viruses and diseases.17 That is why more than half of the participants have increased their tea consumption throughout the COVID-19 pandemic, and a quarter of the participants increased drinking at least one more cup of tea during the pandemic. The present finding supports other research that, in the COVID-19 lockdown, tea intake went up at least one cup higher than in the non-COVID-19 situation.18 A similar result was found in another study, where 70% of tea consumption has increased during the COVID-19 pandemic.19 Tea consumption may have increased because most people had free time during the pandemic, and tea is a source of social gatherings, and they believe it will improve their mood.20 This study also showed a substantial difference in the antioxidant activity of the samples. It is well known that different types of herbs and spices contain a significant amount of bioactive compounds and can act as antioxidants against free radicals. These herbs and spices are utilized as tea flavoring ingredients which can boost the immune system during the COVID-19 pandemic. Although different types of ingredients have contained different levels of bioactive compounds, overall tea consumption ultimately helps in absorbing these phytochemicals. Among them, the cinnamon leaf had the most antioxidant activity, whereas the lemon leaf had the least. In the case of the antioxidant activity of fifteen flavoring ingredients, the highest value was found in the cinnamon leaf (87%) which was similar to the previous study (87.45%).21 However, other researchers also found a lower antioxidant activity value of 67.67% in cinnamon.22 This study also found the lowest antioxidant activity in the lemon leaf (60%). However, a lower value was also found (11.10%) in another research.23 The antioxidant activity of the different herbs depends on various factors like processing conditions (time, temperature), storage condition, production location, variety, etc. So, it is obvious that the antioxidant activity, as well as the bioactive compounds of these flavoring agents, vary from one to another.24 The TPC of several flavoring agent extracts was shown to be rather high. Clove extract had the greatest TPC of all the extracts tested, whereas ginger had the lowest. Clove is widely used in tea as a flavoring ingredient that has important properties in terms of bioactive compounds.25 It is clear that TPC varied from one herb to another, but when these herbs are combined and used in tea, they have the potential to have benefits for human health. A previous study found that, on a dry weight basis, clove had the greatest TFC, whereas lemon leaf had the lowest.25 Among all the extracts analyzed, it was found that clove extract contained the highest TPC of 36.52 mg GAE/g (dwb). However, some of the other researchers found a higher value of 170.90 mg GAE/g26 and also a lower value of 14.38 mg GAE/g (dwb) than the current findings.27, 28 The variation of results of TPC in the different studies may be due to the use of various methods as well as a variety of spices, production processes, and storage conditions.29 It was also found that ginger had the lowest value of TPC at 9.62 mg GAE/g (dwb) but another study found a lower value of 0.63 mg GAE/g (dwb).27 The highest TFC was found in clove (13.68 mg QE/g). A higher value of 75.97 mg QE/g30 and a lower value of 1.39 mg QE/g of clove were also documented.22 The lowest TFC content was found in lemon leaf (1.45 mg QE/g) on a dry weight basis. However, a higher value was documented by another research with 22.43 mg QE/g.31 The current study and previous studies showed that different flavoring ingredients contain different amounts of TPC and TFC and the antioxidant activity, TPC, and TFC of all tea flavoring agents are significantly (p<0.05) different from each other.
The variation in TFC may be because most of the herbs were generally derived from various plant sources and also from different plant species, extraction methods, processing methods, and growing conditions.24 The variation of TPC and TFC content in different ingredients also varies with cooking temperature and other factors. So, tea preparation at high temperatures may reduce these phytochemicals.32 Furthermore, correlation coefficients were discovered with TPC (R2=0.7316) and TFC (R2=0.6662) content at a 95% confidence level. This loosely correlated relationship could be a result of the unidentified phytochemicals in the compound. Elsewhere, other researchers reported on the linear relationship among TPC, TFC, and antioxidant capacity.33, 34 Besides, when the sample’s antioxidant activity was compared to its TPC, a noteworthy relationship (p<0.05) was discovered. On the other hand, when the antioxidant activity was compared to TFC, a similar result was found in some study findings (p<0.05).21, 27 Finally, tea is not only a drink for social enjoyment, but it also contains a lot of potential immune-boosting ingredients that are directly beneficial to human health. Tea consumption during the COVID-19 pandemic has increased due to its positive effect on our health and mind. Although a significant variation of TPC, TFC, and antioxidant activity, has been observed in different herbs, the combined use of these herbs in tea can be a potential source of these phytochemicals.
Conclusion
It is concluded that people increased their tea consumption during the COVID-19 pandemic compared to the non-COVID situation. It is believed that the ingredients in tea help to boost the immune system. Tea flavoring ingredients contained a fairly good amount of TPC, TFC, and antioxidant activity, and a correlation was found among them. It signifies that there is a lot of potential in using ordinary herbs and spices as flavoring agents to improve COVID-19 immunity. Finally, tea usage surged during the COVID-19 pandemic, and tea flavoring components had significant antioxidant activity, TPC, and TFC, all of which protect against many illnesses and enhance the immune system.
Conflict of Interest
The authors state that they have no financial or other conflicts of interest.
Acknowledgment
The researchers would like to express their gratitude to the research subjects who took part in this study. We are grateful to the Department of FTNS, MBSTU, Tangail, Bangladesh for providing laboratory space for this study.
References
- Nasir T. and Shamsuddoha M. Tea productions, consumptions and exports: Bangladesh perspective. Int J Edu Res Technol. 2011; 2(1): 68-73.
- Nakatani N. Phenolic antioxidants from herbs and spices. Biofactors. 2000; 13(1-4): 141-146.
- Chan E. W., Soh E. Y., Tie P. P. and Law Y. P. Antioxidant and antibacterial properties of green, black, and herbal teas of Camellia sinensis. Pharmacogn Res. 2011; 3(4): 266.
- Zhao C., Li C., Liu S. and Yang L. The galloyl catechins contributing to main antioxidant capacity of tea made from Camellia sinensis in China. Sci World J. 2014; 2014:
- Hossain M. S., Nibir, Y. M., Zerin S. and Ahsan N. Antibacterial activities of the Methanolic extract of Bangladeshi Black tea against various human pathogens. Dhaka Univ J Pharm Sci. 2014; 13(1): 97-103.
- Saha J. K., Adnan K. M., Sarker S. A. and Bunerjee S. Analysis of growth trends in area, production and yield of tea in Bangladesh. J Agric Food Res. 2021; 4: 100136.
- Alam K. M., Huda M. K. and Chowdhury M. A. M. Comparative evaluation for minerals and nutritional, elements in seventeen marketed brands of black tea of Bangladesh. Food Sci Technol. 2020; 8(1): 10-22.
- El-Sayed S. M., and Youssef A. M. Potential application of herbs and spices and their effects in functional dairy products. Heliyon. 2019; 5(6): 1-7.
- Zhao Z., Li Y., Zhou L., Zhou X., Xie B., Zhang W. and Sun J. Prevention and treatment of COVID-19 using traditional chinese medicine: a review. Phytomedicine. 2021; 85: 153308.
- Shahrajabian M. H., Sun W. and Cheng Q. Traditional herbal medicine for the prevention and treatment of cold and flu in the autumn of 2020, overlapped with COVID-19. Nat Prod Commun. 2020; 15(8): 1934578X20951431.
- Mhatre S., Srivastava T., Naik S. and Patravale V. Antiviral activity of green tea and black tea polyphenols in prophylaxis and treatment of COVID-19: A review. Phytomedicine. 2021; 85: 153286.
- Zyzelewicz D., Kulbat-Warycha K., Oracz J. and Zyelewicz K. Polyphenols and other bioactive compounds of sideritis plants and their potential biological activity. 2020; 25(16): 3763.
- Ullah Shirazi O., Khattak M. A. K., Shukri N. A. M, Nasyriq M. N., Shirazi, O. and Nasyriq M. A. Determination of total phenolic, flavonoid content and free radical scavenging activities of common herbs and spices. J Pharmacogn Phytochem. 2014; 104(33): 104-108.
- Odabasoglu F., Aslan A., Cakir A., Suleyman H., Karagoz Y., Halici M. and Bayir Y. Comparison of antioxidant activity and phenolic content of three lichen species. Phytother Res. 2004; 18(11): 938-941.
- Chantiratikul P., Meechai P. and Nakbanpotec W. Antioxidant activities and phenolic contents of extracts from Salvinia molesta and Eichornia crassipes. Res J Biol Sci. 2009; 4(10): 1113-1117.
- Supartono W., Sukartiko A. C., Yuliando H. and Kristanti N. E. Possibility of some indigenous spices as flavor agent of green tea. Agric Agric Sci Procedia. 2015; 3: 62-66.
- Chowdhury M. A., Hossain N., Kashem M. A., Shahid M. A. and Alam A. Immune response in COVID-19: A review. J Infect Public Health. 2020; 13(11): 1619-1629.
- Sharangi A. B. Medicinal and therapeutic potentialities of tea (Camellia sinensis L.) A review. Food Res Int. 2009; 42(5-6): 529-535.
- Castellana F., Nucci S. D., Pergola G. D., Chito M. D., Lisco G., Triggiani V., Sardone R. and Zupo R. Trends in coffee and tea consumption during the COVID-19 Pandemic. 2021; 10(10): 2458.
- Costa B. M., Hayley A. and Miller P. Young adolescents’ perceptions, patterns, and contexts of energy drink use. A focus group study. 2014: 80: 183-189.
- Lu M., Yuan B., Zeng M. and Chen J. Antioxidant capacity and major phenolic compounds of spices commonly consumed in China. Food Res Int. 2011; 44(2): 530-536.
- Gupta D. Comparative analysis of spices for their phenolic content, flavonoid content and antioxidant capacity. 2013; 4(1): 38-42.
- Sepahpour S., Selamat J., Abdul Manap M. Y., Khatib A. and Abdull Razis A. F. Comparative analysis of chemical composition, antioxidant activity and quantitative characterization of some phenolic compounds in selected herbs and spices in different solvent extraction systems. Molecules. 2018; 23(2): 402.
- Wojdyło A., Oszmiański J. and Czemerys R. Antioxidant activity and phenolic compounds in 32 selected herbs. Food Chem. 2007; 105(3): 940-949.
- Ghadermazi R., Keramat J. and Goli S. A. H. Antioxidant activity of clove (Eugenia caryophyllata Thunb), oregano (Oringanum vulgare L) and sage (Salvia officinalis L) essential oils in various model systems. Int Food Res J. 2017; 24(4): 1628-1635.
- Adaramola B. and Onigbinde A. Effect of extraction solvent on the phenolic content, flavonoid content and antioxidant capacity of clove bud. IOSR J Pharm Biol Sci.2016; 11(3):33-38.
- Shan B., Cai Y. Z., Sun M. and Corke H. Antioxidant capacity of 26 spice extracts and characterization of their phenolic constituents. J Agric Food Chem. 2005; 53(20): 7749-7759.
- Denre M. The determination of vitamin C, total phenol and antioxidant activity of some commonly cooking spices crops used in West Bengal. Int J Plant Physiol Biochem. 2014; 6(6): 66-70.
- Zehiroglu C. and Ozturk S.B. The importance of antioxidants and place in today’s scientific and technological studies. J Food Sci Technol. 2019; 56(11): 4757-4774.
- Kim I. S., Yang M. R., Lee O. H. and Kang S. N. Antioxidant activities of hot water extracts from various spices. Int J Mol Sci. 2011; 12(6): 4120-4131.
- Derakhshani Z., Hassani A., Pirzad A., Abdollahi R. and Dalkani M. Evaluation of phenolic content and antioxidant capacity in some medicinal herbs cultivated in Iran. Bot Serb. 2012; 36(2): 117-122.
- Alide T., Wangila P. and Kiprop A. Effect of cooking temperature and time on total phenolic content, total flavonoid content and total in vitro antioxidant activity of garlic. BMC Res Notes. 2020; 13(1): 1-7.
- John B. I. J. U., Sulaiman C. T., George S. and Reddy V. R. K. Total phenolics and flavonoids in selected medicinal plants from Kerala. Int J Pharm Pharm Sci. 2014; 6(1): 406-408.
- Aryal S., Baniya M. K., Danekhu K., Kunwar, P., Gurung, R. and Koirala, N. Total phenolic content, flavonoid content and antioxidant potential of wild vegetables from Western Nepal. Plants (Basel). 2019; 8(4): 96.
Accepted on: 20 Apr 2023
Second Review by: Yuan Zhang China
Final Approval by: Dr. Dariusz Dziki


Web of Science Coverage
Emerging Sources Citation Index (ESCI)
2024 Journal Impact Factor: 1.1
Scopus Journal Metrics
CiteScore 2025: 2.6
CiteScore Details
Sustainable Nutrition: Food Systems, Nutrient Retention, and Public Health Impact
![]()
This journal is a member of, and subscribes to the principles of, the Committee on Publication Ethics (COPE)


