Study of the Physicochemical Characteristics of Different Strawberries Consumed in Morocco
Hasnaa Sadik1
, , 2, Azzeddine Er-Ramly2, Samira El Ghammarti1, Asmae Touzani1, 1Laboratory of Biochemistry and Molecular Biology, Faculty of Medicine and Pharmacy, Mohammed V University in Rabat, Morocco.
2Department of Fundamental Sciences, Laboratory of Research Odontological, Biomaterials and Nanotechnology, Faculty of Dental Medicine, Mohammed V University in Rabat, Morocco.
Corresponding Author E-mail: ouazcom@yahoo.fr
DOI : http://dx.doi.org/10.12944/CRNFSJ.11.1.25
Download this article as:
![]()
In Morocco, dietary habits are associated with excessive consumption of red meat and fatty foods, as well as foods that are high in sugar such as bread and cakes, while vegetables and fruits are consumed in insufficient quantities. However, fruits and vegetables are of great nutritional importance, as they are rich in vitamins, minerals, fiber, antioxidants, and help prevent several diseases such as diabetes, cardiovascular diseases, and tumors. Strawberries, known for their sweet and tangy taste, are consumed with a variety of products from different origins in Morocco. This present work consists of the study of the organoleptic, physicochemical characteristics, total phenolic, total flavonoid, Magnesium, Calcium, Chloride, Fluoride, Glucose and sucrose of nine.
KEYWORDS:Consumed; Morocco; Physicochemical; Polyphenol; Strawberries
Introduction
The cultivation of strawberries in Morocco has grown remarkably over the last 20 years, with a cultivated area of 3,050 hectares and 180,378,742 plants of different varieties such as Sabrina, San Andreas, Fortuna, Festival, Camarosa, Splendor, among other things, during the 2016-2017 crop year. Between 1990 and 2010, this crop recorded significant growth at an annual rate of 15.5%, stimulated mainly by the increase in global demand for strawberries and the climatic conditions conducive to the cultivation of this fruit in Morocco.1
Strawberry production has grown significantly since its introduction in the Loukkos basin.2 generating 23% of agricultural employment in the Tangier-Tetouan-Al Hoceima region. This sector has experienced impressive export growth, accounting for 65% of total strawberry production, 95% of blueberries and 90% of raspberries. Exports reach 30 countries, including 16 EU countries, the Gulf States, Australia, North Africa and Latin America. The Loukkos basin currently holds nearly 80% of the national production, favored by the geographical proximity with Europe, the favorable soil climate, the availability of water resources, the skilled workforce, the mastery of production, packaging, conservation and processing techniques, as well as the relocation of the production of certain European companies to Morocco.3
From a nutritional point of view Strawberries are a widely consumed fruit due to their nutritional value, very rich in water (90%), low in carbohydrates, low in calories, rich in vitamins such as vitamin C, B vitamins (B8, B9), rich in trace elements and macronutrients).4,5
The most essential phenolic compound group in strawberries is anthocyanins, responsible for the fruit’s bright red color. Therefore, the composition of anthocyanins is essential for the sensory quality of fruits and products. The hydrolyzable tannins, or ellagitannins, are found only in a few other berries. 6,7 Strawberries also have high levels of condensed tannins. i.e. Proanthocyanidins. 7–9 Flavonols are phenolic compounds found in lower concentrations in strawberries.7,10
Several studies have been put forward to explain the protective effect that the high consumption of strawberries would have in the prevention of certain diseases. The presence of phenolic compounds would be able to prevent certain diseases thanks to their antioxidant power.11
In Morocco, strawberries are not fully utilized due to limited knowledge of their potential and nutritional value, and few studies have been conducted to examine the nutritional characteristics of Moroccan strawberries. To the author’s knowledge, this is the first documented report on the fluoride content and electrical conductivity of strawberries in Morocco. The purpose of this study was to characterize the physicochemical and phenolic properties of strawberry samples. The specific objectives of the study were: i) to assess the quality of strawberries (water content, pH, titratable acidity, electrical conductivity, glucose, sucrose), ii) to evaluate the minerals in strawberries (Mg, Ca, Cl, and F) iii) quantifying phenolic and flavonoid compounds, and iv) determining correlations for each parameter in the samples.
Materials and Methods
Materials
Nine samples of strawberries grown in the Gharb region (eastern Morocco) were collected from street vendors in different markets. The origin and organoleptic qualities are presented in Table 1.
Table 1: Organoleptic parameters of the different strawberry samples studied
| Samples | Place of purchase | Aspect | Color | Taste | Size (cm) | Form |
| 1 | Larache | juicy | bright red | acidulous | 5.2 | medium, fine, elongated |
| 2 | Ben Slimane | juicy | light red | sweet and acidulous | 2.3 | elongated, ovoid |
| 3 | Moulay Bousselham | soft | dark red very bright | sweet | 5.1 | round |
| 4 | Rabat | soft | dark red | sweet | 2.5 | oblongues |
| 5 | Casablanca | juicy | dark red | sweet | 4.6 | elongated, oval |
| 6 | Souk El Arbaa du Gharb | juicy | light red | sweet and acidulous | 3 | round |
| 7 | Rabat | juicy | dark red | sweet | 4 | round |
| 8 | Agdal | juicy | light red | sweet and acidulous | 4 | ovoid |
| 9 | Rabat | soft | dark red very bright | sweet | 3.7 | round |
Methods
Preparation of Strawberry Juice
After washing, 10 grams of strawberries were weighed and added with a volume x 10 ml of distilled water. After grinding in a blender and filtration, the extracts obtained were stored at – 20°C.
Determination of moisture content
The moisture content was determined according to the protocol described by Doymaz.13After cutting into fragments, 5 grams of strawberries were weighed into glass capsules. After incubation in the oven at 105°C ± 2 for 3 hours, the capsules were weighed until the constant weight was obtained after cooling. The moisture content was calculated using a standard formula.
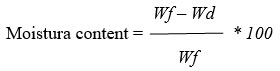
where
- wf = mass of the sample before drying (gram),
- wd= mass of the sample after drying (gram).
Determination of the acidity level
The titratable acidity was determined on strawberry juice preparations according to the method described by AFNOR.14 The acidity level is determined by the addition of 0,1 N NaOH solution until a pH of 8.1 is obtained. This pH value was chosen because it is high enough to neutralize the citric acid present in the strawberry juice. The percentage of citric acid was calculated using a standard formula.
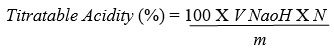
where:
Volume of NaOH: the volume of sodium hydroxide (NaOH) used for titration, in milliliters (ml)
Normality of NaOH: the normality of NaOH solution used for titration in (mol/l)
m: the weight of the sample, in grams (g)
Determination of the sucrose content
Sucrose was measured using the portable refractometer HI 96801 (Brix), which is a durable, portable digital food refractometer designed to measure the sugar concentration of aqueous solutions in % Brix. The device provides results with a precision of ±0.2% Brix and is easy to operate with just two buttons, one for calibration with distilled or deionized water, and the other for taking measurements.15
Determination of the magnesium level
Magnesium content was measured according to the Calmagite method used by Gindler et al. and Khayam et al.16,17 After incubation of the reaction medium for 5 minutes at room temperature, calmagite forms a complex with magnesium in alkaline media, which absorbs at a wavelength of 510–550 nm. The magnesium concentration in the samples is determined with reference to magnesium standards the concentration (20 mg/l).
Determination of the calcium level
Calcium levels in strawberry juice solutions were measured using the CPC method.18 Complexation of the reagent o- cresolphtalein in alkaline medium (1 ml) with calcium from the strawberry juice solutions results in the formation of a complex that absorbs at 570 nm. The absorbance of the strawberry juice samples is deduced from the control value. The calcium concentration in the samples is determined with reference to a calcium standard the concentration (100 mg/l).
Determination of the chloride level
Chloride levels were measured using the colorimetric approach defined by Florence et al. and Tietz.19,20 This method is based on the reaction of undissociated mercuric thiocyanate with chloride ions to form undissociated mercuric chloride and free thiocyanate ions. The thiocyanate ions react with ferric iron to form a red complex, whose absorbance is determined at 400–500 nm. The chloride concentration in the samples is determined with reference to a chloride standard the concentration (100 mEq/l).
Determination of fluoride levels
Fluoride levels in the samples were determined by the potentiometric technique, which is based on the use of a fluoride-specific electrode (HI-4110). The HI-4110 electrode allows the accurate detection of fluoride ions at room temperature in water, beverages, plants, and food products.21
Determination of conductivity
Conductivity is a parameter that indicates the capacity of an aqueous solution to conduct electricity and is directly linked to the existence of soluble salts in the solution.22 To determine the conductivity of the sample of strawberries under investigation, a conductivity meter is used, and the result is expressed in units of microsiemens per centimeter (µS/cm).23
Determination of glucose level
Glucose levels were measured using the enzymatic method24,25 which is based on the oxidation of glucose by glucose oxidase (GOD) to produce gluconic acid and hydrogen peroxide (H2O2). In the presence of peroxidase (POD), H2O2 oxidizes 4-chlorophenol and paraphenylenediamine (PAP) acid phosphate to form a complex that is measured at a wavelength of 500 nm after 10 minute incubation at room temperature. The amount of glucose in the samples is calculated relative to a glucose GOD-PAP standard the concentration 1g/l.
Polyphenol dosages
The method used to determine polyphenol levels in strawberry samples was described by Siddhuraju et al.26 200 μl of strawberry extract is added to 1.5 ml of 10-fold diluted Folin-Cioccalteu reagent and incubated for 5 min at room temperature. The addition of 1.5 ml of sodium carbonate (60 g/l) and incubation for 90 min in the dark results in the formation of the blue coloration, whose absorbance measured at 725 nm. The calibration curve (between 0 and 100 µg/ml of gallic acid) is used to the amount of polyphenols present in the strawberry juice.
Flavonoids content
The method of flavonoid determination is based on that described by Zhishen et al. and Kim et al.27,28 400 µl of extract were mixed with 120 µl of NaNO2 (5%). After incubation for 5 minutes, 120 µl of AlCl3 (10%) was added to the mixture. After incubation for 6 minutes, 800 µl of 1M NaOH was added. The absorbance of the reaction medium obtained is determined at 510 nm. The calibration curve (between 0 and 100 µg/ml of quercetin) is used to determine the flavonoid levels in the strawberry juices.
Statistical Analysis
The measurements were conducted in three replicates. And the data presented reflects the average of those three replicates. The results were expressed as mean ± standard error. Statistical analysis using One-way analysis of variance (ANOVA) was performed, and GraphPad Prism version 8.0.2 software was used to make statistical comparisons between strawberry sample. Tukey’s test was used to compare the means obtained, and any differences with a p-value less than 0.05 were considered statistically significant
Results and Discussion
Variation of organoleptic qualities of strawberries
In the present study, the strawberry samples of Moroccan origin varied in color from light to dark, bright red. The dark red and bright strawberry samples were soft and very sweet and the light red samples were low in sweetness and medium in tartness (Table 1)
Physicochemical parameters
Data on physicochemical parameters of three strawberry samples (1, 2, and 3) are presented in Table 2.
Table 2: Variation of physicochemical parameters of the strawberry samples studied
| StrawberrySample | Humidity (%) | pH | Titratableacidity (%) | Conductivity (mS/cm) |
| 1 | 58.00±0.10 a | 3.60±0.02 c | 0.32 ±0.00 a | 1.07±0.01a |
| 2 | 61.00±0.30 b | 3.06±0.05 b | 0.34 ±0.00 a | 0.98±0.01b |
| 3 | 67.00±0.20 c | 3.01±0.00 a | 0.67±0.01 c | 0.86±0.00 c |
Data shown are means ± standard error (n = 3); values with different letters are significantly (p < 0.05) different according to the Tukey test.
Moisture content is 58%, 61% and 67% respectively in sample strawberries (1), (2) and (3). The moisture content in strawberry sample (3) of Moulay Bousselham is higher than those of the region (1) and (2) of Larache and Benslimane origin .These moisture contents are lower than those reported by Raj et al 29 [87% to 94%] and comparable to the banana fruit [68.5% to 73.8%].30 Factors that influence the water content of plants include their age, the period of their vegetative cycle.31 genetic factors.32 as well as different environmental conditions, including exposure to various soil and climatic conditions and geographical distribution.33
According to Bretaudeau and Fauré, water plays an important role in the dissolution of minerals, sugars, enzymes, and other compounds in the fruit.
The pH values are respectively 3.01, 3.06 and 3.60 in samples (3), (2) and (1). sample (3) is more acidic compared to the original Benslimane and Larache. These values are comparable to those of Rahman et al (pH 3.7).34
Strawberries have a natural acidity due to the presence of organic acids such as citric acid, malic acid, and ascorbic acid .35 These organic acids are responsible for the characteristic acidic taste of strawberries and may have health benefits.
According to Rodas et al, physical and chemical properties of strawberry, such as external color, pH, sugar and citric acid content, are influenced by combined doses of nitrogen and potassium applied in fertilization.36
The measurement of titratable acidity allows the quantification of organic acids present in strawberry samples.37 These organic acids are metabolic intermediates that influence microbial growth and shelf life. They also play a role in the growth, ripening and senescence of the fruit .38 and can affect its sensory properties.39,40
The titratable acidity contents are respectively 0.32%, 0.34%, 0.67% in the samples (1), (2)
and (3). Samples (1) and (2) have lower acidity levels compared to sample (3). The acidity levels found are lower than those obtained by Lal et al.41 These results demonstrate that the relationship between strawberry pH and titratable acidity is linear (Table 2). This variation may be due to climatic conditions and the ripening process of the fruit.42
The conductivities are 1.07 mS/cm, 0.98 mS/cm and 0.86 mS/cm in strawberries (1) (2) and (3), respectively. sample (1) has a high conductivity compared to the other samples (2) and (3). These values are low compared to that characterized by Sarang et al 43. The electrical conductivity of strawberry is influenced by a variety of factors, including its water content, pH and the presence of certain acids and sugars. 44
Variation in mineral content
The results of mineral content variations for 3 strawberry samples (1), (2) and (3) are given in Table 3.
Table 3: Variation in mineral content
| Strawberry Samples | Mg (mg/100g) | Ca (mg/100g) | Cl (mg/100g) | F(mg/l) |
| 1 | 19.40±0.04 a | 13.50±0.20 a | 82.00±0.90 a | 0.045±0.00 c |
| 2 | 29.00±0.40 b | 43.20±0.05 b | 1442.00±0.20 b | 0.03±0.00 a |
| 3 | 34.000±0.30 c | 48.10±0.30 c | 1609.00±0.50 c | 0.03±0.00 b |
Data shown are means ± standard error (n = 3); values with different letters are significantly (p < 0.05) different according to the Tukey test.
Magnesium is a vital mineral for plants with various functions in their growth and development. Its primary role is as a component of chlorophyll, which is necessary for the process of photosynthesis in plants. Insufficient magnesium can lead to a lack of chlorophyll production, negatively impacting plant growth and health. Moreover, magnesium plays a crucial role in regulating the uptake of other essential nutrients, such as nitrogen and phosphorus. Additionally, magnesium helps enhance the color and brightness of fruits by regulating the production of other pigments in plants, including carotenoids and anthocyanins. It is, therefore, crucial to ensure that plants have sufficient magnesium to support their overall health and produce high-quality fruits.38
Magnesium contents ranged from 19.4 to 34 mg per 100 g fresh weight in the different s strawberry samples studied. sample (3) has higher magnesium content 34 mg/100g compared to samples (1) and (2) (Table 3). The magnesium content of strawberries is higher compared to that revealed by Prichko et al.45 citing values between (6.3 mg to 10.3mg) per 100 g , these results are comparable to other fruits such as banana by those reported Gutiérrez et al.46
Calcium is used to build up the cell walls and form the skeleton of the strawberry plant.38 Calcium contents ranged from 13.5 mg to 48.10 mg per 100 g fresh weight in the strawberry samples studied. Sample (3) has a high value 48 mg/100 g compared to the other samples (1) and (2) (table 3). These levels are comparable to those characterized by Prichko et al.45
Chloride levels ranged from 82 mg to 1609 mg per 100 g fresh weight in the strawberry samples studied. Sample (3) has a high value compared to the other Samples (1) and (2). Chloride is the most abundant mineral element in these studied strawberry samples. This mineral is the most widely used sanitizer in the food industry for post-harvest washing of fresh fruits and vegetables.47 Chloride fertilization can improve fruit yield and quality.48
The fluoride level is between 0.03 mg to 0.04 mg per liter in the studied samples. Sample (1) has a high fluoride value compared to samples (2) and (3). These results are consistent with the criteria established by the USDA National Fluoride Database (0.04 ppm equivalent to 0.04 mg/l).49
The results obtained in this study are similar to those reported in a previous study by Passos Farias et al .50 regarding the fluoride content of mango, which is estimated at 0.04 mg/l. Our concentrations are low as date and tea leaves.15, 51 Strawberries absorb little fluoride compared to other fruits due to their antioxidant properties.52
The results of the mineral composition analysis showed the high content of mineral elements such as calcium, magnesium and chloride in the various strawberry samples studied. However, the variation in mineral composition between samples can be attributed to storage conditions that influence the minerals in the strawberries. There are several reasons for this variation. First, the prolonged storage time of strawberries can lead to a loss of minerals due to exposure to oxygen and light, which can affect the mineral composition. In addition, storage conditions such as temperature, humidity and ventilation also play a key role in the variation of mineral composition. For example, high temperatures can lead to the loss of minerals such as calcium and magnesium, while excessive moisture can promote the growth of molds and bacteria that alter the mineral composition of strawberries.53 Finally, the mineral composition of strawberries can also be influenced by the nature of the soil and climatic conditions, as the minerals present in the soil are absorbed by the plants and can thus impact their mineral composition.54
Variation of glucose, sucrose and polyphenol contents
The results of the variations in glucose, sucrose and polyphenol contents for the three strawberry samples (1), (2) and (3) are given in Table 4.
Table 4: Variation of glucose, sucrose and polyphenol contents
| StrawberrySample | Glucose (g/100g) | Sucrose (g/100g) | Polyphenol (mg (GAE)/100g) |
| 1 | 1.35±0.01 b | 0.60±0.10 a | 61.00±0.10 a |
| 2 | 1.20±0.10 a | 0.70±0.10 a | 86.60±0.30 b |
| 3 | 2.45±0.04 c | 1.30±0.10 c | 151.00±0.90 c |
Data shown are means ± standard error (n = 3); values with different letters (a-e) are significantly (p < 0.05) different according to the Tukey test.
GAE mean gallic acid equivalent
Carbohydrates in strawberries are the major taste compounds and are considered one of the main quality parameters of the fruit preferred by growers and consumers.55
The glucose content is between 1.35 g/100g to 2.45 g/100g. Sample (3) has a higher glucose content compared to samples (1) and (2). These values are higher than those characterized by Lester et al 56 and comparable to the value highlighted by Sturm et al.57
The sucrose content varied from 0.8 g/100g to 1.3 g/100g in the different samples studied. Sample (3) has a higher sucrose content compared to samples (2) and (1). These results are comparable to those determined by Urün et al 55 and Sturm et al.57
Depending on the genotype and ripening stage of the strawberry, changes in sucrose and glucose content were closely related. Harvesting at the optimal fruiting time is crucial to obtain high quality strawberries, as individual sugar and acid content can change significantly during the later stages of ripening.57 The leaf to fruit ratio has been shown to be a good indicator to explain the difference in sugar content of strawberries between different varieties. The higher the available leaf area per fruit crop, the higher the sugar concentration.58
The results on glucose and sucrose content show that strawberries are less sweet than other fruits such as dates,45 grapes,59 and figs.60
The polyphenol dosages are 61 mg, 86.6 mg and 151 mg per 100 g for strawberry (1) (2) and (3) respectively (Table 4). The total polyphenol content of sample (3) is higher compared to samples (1) and (2). The polyphenol levels are comparable to those characterized by Urün et al.55
The results obtained show that the strawberry samples studied are rich in polyphenols, which are beneficial to human health due to their nutritional properties. Phenolic compounds are essential for health due to their antimicrobial, antiallergic and antihypertensive properties. These substances have been shown to detoxify free radicals by blocking their production and are factors in the prevention of cardiovascular disease, cancer, type 2 diabetes, and obesity. These results therefore underline the importance of regular consumption of strawberries to maintain good health.61
A study conducted by Paquette Martine et al determined the effect of a supplement enriched with strawberry and cranberry polyphenol extracts on the insulin sensitivity of overweight and obese men and women with insulin resistance. Regular consumption of polyphenols improves insulin sensitivity.62
Variation in flavonoid and sucrose content
Flavonoid and sucrose analyses were performed on strawberry samples harvested in different seasons, marketed and consumed in Morocco (Table 5).
Table 5: Sucrose and flavonoid content of the studied strawberry samples
| Strawberry Sample | Sucrose content (g/100g) | Flavonoid content (mg (QE) /100g) |
| 4 | 0.7±0.10 a | 151.00±0.20 e |
| 5 | 0.30±0.10 b | 55.00±0.30 a |
| 6 | 0.60±0.10a | 111.00±0.60 b |
| 7 | 0.40±0.10 a | 132.00±0.100 c |
| 8 | 0.70±0.10 a | 149.00±0.50 d |
| 9 | 0.70±0.10 a | 236.00±0.85 f |
Data shown are means ± standard error (n = 3); values with different letters are significantly (p < 0.05) different according to the Tukey test.
QE mean Quercetin equivalent.
Flavonoid contents ranged from (55mg-236mg) per 100g. Sample (9) is richer in flavonoids and sucrose than the other samples studied. The sample (5) has a lower flavonoid and sucrose content. Flavonoid levels are comparable to those characterized by Seleshe et al. (114.4mg/100g -260.9mg/100g).63
According to Adrian Franke, flavonoids vary depending on the species and variety, the place of cultivation, the time of harvest, storage and processing.64 Flavonoids in strawberries have a potential antioxidant power and contribute in reducing cardiovascular and cancer risk.65
Conclusion
The study demonstrated that strawberries are abundant in essential minerals like calcium, magnesium, and chloride, as well as sugars, polyphenols, and flavonoids that offer significant health benefits. As a result, strawberries are an ideal food choice for people aiming to maintain a healthy and balanced diet. Additionally, the results enabled the classification of various strawberry samples based on their nutritional qualities, providing selection criteria for consumers according to their taste and nutritional preferences.
Furthermore, these studies emphasized the value of consuming red fruits and understanding their nutritional qualities and technological applications. Lastly, the study findings could help farmers optimize their strawberry cultivation practices to maximize nutrient and bioactive content.
Conflict of Interest
The authors do not have any conflict of interest.
Funding Sources
The author(s) received no financial support for the research, authorship, and/or publication of this article.
References
- Ezziyyani M., Hamdache A., Ezziyyani M., Cherrat L. Predictable consequences of climate change for varieties of strawberry plants grown in Morocco. Int J Sustain Agric Manag Inform. August 2019. https://www.inderscienceonline.com/doi/ 10.1504/IJSAMI. 2019.101667. Accessed April 10, 2023.
CrossRef - Benicha M., Tanji A. Techniques de Production Du Fraisier : Résultats d’enquête Au Loukkos (Nord-Ouest Du Maroc). ; 2015. doi:10.13140/RG.2.1.1739.2087
- Arhazzal M. Filière des petits fruits rouges au Nord du Maroc. https://www.agrimaroc.ma/filiere-petits-fruits-rouges-nord-maroc/. Published March 7, 2018. Accessed March 5, 2023.
- FoodData Central. https://fdc.nal.usda.gov/fdc-app.html#/food-details/1102710/nutrients. Accessed March 5, 2023.
- Rapuru R., Bathula S., Kaliappan I., Rapuru R., Bathula S., Kaliappan I. Phytochemical Constituents and Pharmacological Activities of Strawberry. IntechOpen; 2022. doi:10.5772/intechopen.103973
CrossRef - Clifford M.N., Scalbert A. Ellagitannins – nature, occurrence and dietary burden. J Sci Food Agric. 2000;80(7):1118-1125. doi:10.1002/(SICI)1097-0010(20000515)80:7<1118::AID-JSFA570>3.0.CO;2-9
CrossRef - Aaby K., Mazur S., Nes A., Skrede G. Phenolic compounds in strawberry (Fragaria x ananassa Duch.) fruits: Composition in 27 cultivars and changes during ripening. Food Chem. 2012;132(1):86-97. doi:10.1016/j.foodchem.2011.10.037
CrossRef - Buendía B., Gil MI., Tudela J.A., et al. HPLC-MS analysis of proanthocyanidin oligomers and other phenolics in 15 strawberry cultivars. J Agric Food Chem. 2010;58(7):3916-3926. doi:10.1021/jf9030597
CrossRef - Gu L., Kelm M.A., Hammerstone J.F., et al. Screening of foods containing proanthocyanidins and their structural characterization using LC-MS/MS and thiolytic degradation. J Agric Food Chem. 2003;51(25):7513-7521. doi:10.1021/jf034815d
CrossRef - Aaby K., Skrede G., Wrolstad RE. Phenolic composition and antioxidant activities in flesh and achenes of strawberries (Fragaria ananassa). J Agric Food Chem. 2005;53(10):4032-4040. doi:10.1021/jf048001o
CrossRef - Olas B. Berry Phenolic Antioxidants – Implications for Human Health? Front Pharmacol. 2018;9:78. doi:10.3389/fphar.2018.00078
CrossRef - Hancock J.F., ed. Temperate Fruit Crop Breeding. Dordrecht: Springer Netherlands; 2008. doi:10.1007/978-1-4020-6907-9
CrossRef - Doymaz İ. Convective air drying characteristics of thin layer carrots. J Food Eng. 2004;61(3):359-364. doi:10.1016/S0260-8774(03)00142-0
CrossRef - NF V05-101. Afnor EDITIONS. https://www.boutique.afnor.org/fr-fr/norme/nf-v05101/produits-derives-des-fruits-et-legumes-determination-de-lacidite-titrable/fa009237/13940. Accessed March 5, 2023.
- Essebbahi I., Ouazzani C., Moustaghfir A., et al. Nutritional qualities and fluoride content of different date (Phoenix dactylifer) varieties consumed in Morocco. J Appl Nat Sci. 2023; 15:9-14. doi:10.31018/jans.v15i1.4015
CrossRef - Giluder E.M., Heth D.A. Calorimetric determination with bound” calmagite” of magnesium in human blood plasma. Clin Chem. 1971; 17:663-666.
- Khayam-Bashi H., Liu T.Z., Walter V. Measurement of serum magnesium with a centrifugal analyzer. Clin Chem. 1977;23(2):289-291.
CrossRef - Moorehead W.R., Biggs H.G. 2-Amino-2-methyl-1-propanol as the Alkalizing Agent in an Improved Continuous-Flow Cresolphthalein Complexone Procedure for Calcium in Serum. Clin Chem. 1974;20(11):1458-1460. doi:10.1093/clinchem/20.11.1458
CrossRef - Florence T.M., Farrar Y.J. Spectrophotometric determination of chloride at the parts-per-billion level by the mercury(II) thiocyanate method. Anal Chim Acta. 1971;54(2):373-377. doi:10.1016/S0003-2670(01)82142-5
CrossRef - Burtis C.A., Ashwood E.R., Tietz N.W. Tietz Textbook of Clinical Chemistry. 3rd ed. Philadelphia: W.B. Saunders; 1999.
- Essebbahi I., Ouazzani C., Moustaghfir A., et al. Analysis of the fluoride levels of well water and tea consumed by the Moroccan population in different rural areas. Mater Today Proc. 2022;72. doi:10.1016/j.matpr.2022.07.360
CrossRef - Laouar A., Benbelkhir A., Baida W., Rouissat L., Benyagoub E. Valorization of Algerian Semi-Soft Date and Traditional Preparation of Date Syrup: Physicochemical and Biochemical Properties. Indones Food Sci Technol J. 2021;4(2):32-36. doi:10.22437/ifstj.v4i2.12231
CrossRef - Petrović M. Conductivity EC. Hanna Instruments Africa. https://blog.hannaservice.eu/conductivity-ec/. Published May 31, 2022. Accessed April 10, 2023.
CrossRef - Trinder P. Determination of Glucose in Blood Using Glucose Oxidase with an Alternative Oxygen Acceptor. Ann Clin Biochem. 1969;6(1):24-27. doi:10.1177/000456326900600108
- Burrin J.M., Price C.P. Measurement of Blood Glucose. Ann Clin Biochem. 1985;22(4):327-342. doi:10.1177/000456328502200401
CrossRef - Siddhuraju P., Becker K. Antioxidant properties of various solvent extracts of total phenolic constituents from three different agroclimatic origins of drumstick tree (Moringa oleifera Lam.) leaves. J Agric Food Chem. 2003;51(8):2144-2155. doi:10.1021/jf020444+
CrossRef - Zhishen J., Mengcheng T., Jianming W. The determination of flavonoid contents in mulberry and their scavenging effects on superoxide radicals. Food Chem. March 1999. doi:10.1016/S0308-8146(98)00102-2
CrossRef - Kim D.O., Chun O.K., Kim Y.J., Moon H.Y., Lee C.Y. Quantification of Polyphenolics and Their Antioxidant Capacity in Fresh Plums. J Agric Food Chem. 2003;51(22):6509-6515. doi:10.1021/jf0343074
CrossRef - Raj R., Cosgun A., Kulić D. Strawberry Water Content Estimation and Ripeness Classification Using Hyperspectral Sensing. Agronomy. 2022;12(2):425. doi:10.3390/agronomy12020425
CrossRef - Wall M.M. Ascorbic acid, vitamin A, and mineral composition of banana (Musa sp.) and papaya (Carica papaya) cultivars grown in Hawaii. J Food Compos Anal. 2006 ;19(5):434-445. doi:10.1016/j.jfca.2006.01.002
CrossRef - Marsoul A., Ijjaali M., Elhajjaji F., et al. Phytochemical screening, total phenolic and flavonoid methanolic extract of pomegranate bark (Punica granatum L): Evaluation of the inhibitory effect in acidic medium 1 M HCl. Mater Today Proc. 2020 ;27 :3193-3198. doi:10.1016/j.matpr.2020.04.202
CrossRef - ATHAMENA S. ETUDE QUANTITATIVE DES FLAVONOIDES DES GRAINES DE Cuminum cyminum ET LES FEUILLES DE Rosmarinus officinalis ET L’EVALUATION DE L’ACTIVITE BIOLOGIQUE. 2009. http://eprints.univ-batna2.dz/552/. Accessed March 5, 2023.
- Ruiz-Rodríguez B.M., Morales P., Fernández-Ruiz V., et al. Valorization of wild strawberry-tree fruits (Arbutus unedo L.) through nutritional assessment and natural production data. Food Res Int. 2011;44(5):1244-1253. doi:10.1016/j.foodres.2010.11.015
CrossRef - Rahman H., Islam MdS., Akter D., et al. Shelf Stability with & Without Preservatives and Storage Conditions, Physico-Chemical Properties of Strawberry Juice Procured from Tangail District Bangladesh. 2018; Vol. 3:1-17.
- Kallio H., Hakala M., Pelkkikangas A.M., Lapveteläinen A. Sugars and acids of strawberry varieties. Eur Food Res Technol. 2000;212(1):81-85. doi:10.1007/s002170000244
CrossRef - Rodas C., Silva I., Coelho V., Ferreira D., Souza R.J., Carvalho J. Chemical properties and rates of external color of strawberry fruits grown using nitrogen and potassium fertigation. Idesia. 2013 ;31 :53-58.
CrossRef - Analyses physico chimiques de la propolis locale selon les étages bioclimatiques et les deux races d’abeille locales (apis mellifica intermissa et apis mellifica sahariensis) – Sécheresse info. http://www.secheresse.info/spip.php?article27130. Accessed March 5, 2023.
- Al-Farsi M., Alasalvar C., Morris A., Baron M., Shahidi F. Compositional and sensory characteristics of three native sun-dried date (Phoenix dactylifera L.) varieties grown in Oman. J Agric Food Chem. 2005;53(19):7586-7591. doi:10.1021/jf050578y
CrossRef - Jadhav S.J., Andrew WmT. Effects of Cultivars and Fertilizers on Nonvolatile Organic Acids in Potato Tubers. Can Inst Food Sci Technol J. 1977;10(1):13-18. doi:10.1016/S0315-5463(77)73428-5
CrossRef - Siebert K.J. Modeling the flavor thresholds of organic acids in beer as a function of their molecular properties. Food Qual Prefer. 1999;10(2):129-137. doi:10.1016/S0950-3293(98)00059-7
CrossRef - Lal S., Ahmed N., Singh S.R., Singh D.B., Sharma O.C., Kumar R. Variability of health and bioactive compounds in strawberry (Fragaria x ananassa Duch.) cultivars grown under an Indian temperate ecosystem. Fruits. 2013 ;68(5):423-434. doi:10.1051/fruits/2013086
CrossRef - Optimisation du processus d’immersion – réhydratation du système dattes sèches – jus d’orange – Sécheresse info. http://www.secheresse.info/spip.php?article27105. Accessed March 5, 2023.
- Sarang S., Sastry S.K., Knipe L. Electrical conductivity of fruits and meats during ohmic heating. J Food Eng. 2008;87(3):351-356. doi:10.1016/j.jfoodeng.2007.12.012
CrossRef - Castro I., Teixeira J.A., Salengke S., Sastry S.K., Vicente A.A. THE INFLUENCE of FIELD STRENGTH, SUGAR and SOLID CONTENT ON ELECTRICAL CONDUCTIVITY of STRAWBERRY PRODUCTS. J Food Process Eng. 2003;26(1):17-29. doi:10.1111/j.1745-4530.2003.tb00587.x
CrossRef - Prichko T.G., Germanova M.G., Podorozhniy V.N. Blochemical monitoring of genetic collections of strawberry in NCFSCHVW and CEBS. Knyazev S, Loretts O, Kukhar V, Panfilova O, Tsoy M, eds. E3S Web Conf. 2021;254:02008. doi:10.1051/e3sconf/202125402008
CrossRef - Gutiérrez A., Rubio C., Baez A., Martin M., Alvarez R., Diaz E. Mineral composition of the banana (Musa acuminata) from the island of Tenerife. Food Chem – FOOD CHEM. 2001; 73:153-161. doi:10.1016/S0308-8146(00)00252-1
CrossRef - Malka S.K., Park M.H. Fresh Produce Safety and Quality: Chlorine Dioxide’s Role. Front Plant Sci. 2022;12. https://www.frontiersin.org/articles/10.3389/fpls.2021.775629. Accessed March 5, 2023.
CrossRef - Bellof S., Schubert S. Chloride improves fruit yield and quality of strawberry (Fragaria × ananassa Duch.). March 2009. https://escholarship.org/uc/item/9ck8q8n2. Accessed March 5, 2023.
- None Available. USDA National Fluoride Database of Selected Beverages and Foods – Release 2 (2005). 2015. doi:10.15482/USDA.ADC/1178143
- Passos Farias I., Leite D., Silva F., Sampaio F., Duarte R. Concentração de flúor e potencial erosivo de sucos de frutas naturais concentrados. Rev Odonto Ciênc. 2015 ;29 :106. doi:10.15448/1980-6523.2014.4.13301
CrossRef - Essebbahi I., Ouazzani C., Moustaghfir A., Dami A., Balouch L. Analyses physicochimiques de différents thés commerciaux et risque de l’excès de fluor chez la population au Maroc. Int J Biol Chem Sci. 2020;14(4):1203-1213. doi:10.4314/ijbcs.v14i4.4
CrossRef - Inayat I., Kanwal M.A., Ahmad K.R., et al. AMELIORATIONS OF VITAMIN E, OLIVE OIL AND STRAWBERRY FRUIT EXTRACTS AGAINST NAF (SODIUM FLOURIDE) INDUCED HEPATO-HISTOPATHOLOGIES. PLANT CELL Biotechnol Mol Biol. September 2021:42-48. https://www.ikprress.org/index.php/PCBMB/article/view/7035. Accessed March 5, 2023.
- Błaszczyk J., Bieniasz M., Nawrocki J., et al. The Effect of Harvest Date and Storage Conditions on the Quality of Remontant Strawberry Cultivars Grown in a Gutter System under Covers. Agriculture. 2022;12(8):1193. doi:10.3390/agriculture12081193
CrossRef - Akhatou I., Fernández-Recamales Á. Influence Of Cultivar And Culture System On Nutritional And Organoleptic Quality Of Strawberry. J Sci Food Agric. 2014;94. doi:10.1002/jsfa.6313
CrossRef - Urün I., Attar S.H., Sönmez D.A., et al. Comparison of Polyphenol, Sugar, Organic Acid, Volatile Compounds, and Antioxidant Capacity of Commercially Grown Strawberry Cultivars in Turkey. Plants. 2021;10(8):1654. doi:10.3390/plants10081654
CrossRef - Lester G.E., Lewers K.S., Medina M.B., Saftner R.A. Comparative analysis of strawberry total phenolics via Fast Blue BB vs. Folin–Ciocalteu: Assay interference by ascorbic acid. J Food Compos Anal. 2012;27(1):102-107. doi:10.1016/j.jfca.2012.05.003
CrossRef - Sturm K., Koron D., Stampar F. The composition of fruit of different strawberry varities depending on maturity stage. Food Chem. 2003; 83:417-422. doi:10.1016/S0308-8146(03)00124-9
CrossRef - Carlen C., Potel A.M., Bellon C., Ancay A. Variation of the quality of strawberries: effects of cultivar, leaf/fruit ratio, harvest period and maturity stage. Rev Suisse Vitic Arboric Hortic. 2005; 2:87-93.
- Elkhorchani A., Mechlouch R., El‘mrabt A., Essid A., Lachehib B., Ferchichi A. . Etude de la composition en sucres totaux de deux cultivars de vigne avant et après séchage. Rev Régions Arid. 2010 ; Numéro spécial :358-360.
- Essid A., Mechlouch R., Chaira N., Radhouani A., Lachehib B., Ferchichi A. Evaluation de la composition en sucres totaux de trois cultivars locaux de figuier avant et après séchage. Rev Régions Arid. 2010 ; Numéro spécial :218-221.
- Giampieri F., Alvarez-Suarez J.M., Mazzoni L., et al. The potential impact of strawberry on human health. Nat Prod Res. 2013 ;27(4-5) :448-455. doi:10.1080/14786419.2012.706294
CrossRef - Paquette M., Medina Larqué A.S., Weisnagel S.J., et al. Strawberry and cranberry polyphenols improve insulin sensitivity in insulin-resistant, non-diabetic adults: a parallel, double-blind, controlled and randomised clinical trial. Br J Nutr. 2017;117(4):519-531. doi:10.1017/S0007114517000393
CrossRef - Seleshe S., Lee J.S., Lee S., et al. Evaluation of Antioxidant and Antimicrobial Activities of Ethanol Extracts of Three Kinds of Strawberries. Prev Nutr Food Sci. 2017;22(3):203-210. doi:10.3746/pnf.2017.22.3.203
- Franke A.A., Custer L.J., Arakaki C., Murphy S.P. Vitamin C and flavonoid levels of fruits and vegetables consumed in Hawaii. J Food Compos Anal. 2004;17(1):1-35. doi:10.1016/S0889-1575(03)00066-8
CrossRef - HANNUM S.M. Potential Impact of Strawberries on Human Health: A Review of the Science. Crit Rev Food Sci Nutr. 2004;44(1):1-17. doi:10.1080/10408690490263756
CrossRef
Accepted on: 12 Apr 2023
Second Review by: Rafaella de Paula Paseto Fernandes
Final Approval by: Dr. Prasad S. Variyar


Web of Science Coverage
Emerging Sources Citation Index (ESCI)
2024 Journal Impact Factor: 1.1
Scopus Journal Metrics
CiteScore 2025: 2.6
CiteScore Details
Sustainable Nutrition: Food Systems, Nutrient Retention, and Public Health Impact
![]()
This journal is a member of, and subscribes to the principles of, the Committee on Publication Ethics (COPE)


