Quality of White-Brined Nabulsi Cheese Made with Different Proportions of Sheep’s and Cows’ Milk
Khaled Abu-Alruz*
Department of Nutrition and Food Technology, Faculty of Agriculture, Mutah University-Alkarak-Jordan.
Corresponding Author E-mail: kabu_ruz@mutah.edu.jo
DOI : http://dx.doi.org/10.12944/CRNFSJ.11.1.6
Download this article as:
![]()
Nabulsi cheese is the dominant white-brined cheese in Jordan and neighboring countries. Although this cheese is typically prepared using sheep’s milk, achieving large-scale production or attaining a specific quality involves the use of cows’ milk. Nabulsi cheese is kept in >18% brine for up to 1 year at room temperature (25 °C) and then soaked in water for desalting before eating. In this study, the effects of the milk type/combination used for production (100% sheep’s milk; 100% cows’ milk; 1:1, 3:1, or 1:3 sheep’s:cows’ milk mixture), desalting (salted vs. desalted cheese), and storage time (0, 6, and 12 months) on the cheese’s chemical composition directly after processing (in the salted form), texture (according to texture profile analysis “TPA”), and color (according to CIE lab color space) were assessed. The type or the combination of milk used does not affect the chemical composition of Nabulsi cheese, which was 43.35% ± 1.50 for moisture, 20.24% ± 0.59 for protein, 24.70% ± 1.53 for fat, 11.52% ± 0.60 for ash, 9.96% ± 0.44 for salt, and pH 6.43 ± 0.16. However, cheeses prepared using 100% sheep’s and 100% cows’ milk, respectively showed the highest (26.85%) and lowest (14.77%) yields. Desalting and milk type had the highest effects on cheese texture and color, respectively. Considering all tested parameters, mixing equal proportions of sheep’s and cows’ milk ensures that the Nabulsi cheese produced is similar to that produced from 100% sheep’s milk, albeit with increased cohesiveness (0.52 ± 0.07for cheese made from sheep’s milk and 0.59 ± 0.05 for 1:1 sheep’s: cows’ milk mixture).
KEYWORDS:Chemical Composition; CIE Lab Color; Cows’ Milk; Different Types Of Milk; Nabulsi Cheese; Sheep’s Milk; Texture Profile Analysis; Yield
Introduction
White brined cheese is one of the main types of cheese consumed worldwide. Halloumi, Akkawi, Feta, and Nabulsi cheese (i.e., types of white brined cheese), are produced in different countries 1,2. Nabulsi is the most common type of white brined cheese produced in Jordan and many Middle Eastern countries 3. The market domination of Nabulsi cheese is related to the ease with which it can be processed by small producers and family businesses, notably in regions without adequate transportation or refrigeration for milk 4. Nabulsi cheese is classified as a semi hard cheese produced without a starter culture and has no holes and a range of colors (from white to yellow) according to the milk type used in production. Humeid and Tukan5 described the traditional method for the production of Nabulsi cheese; this process is traditional and typically applied on a medium or small scale. However, on a large scale, the milk is typically pasteurized before processing 1. Preservation of Nabulsi cheese depends on the boiling step and the high salt concentration 5.
Sheep’s and goats’ milk is traditionally used to produce Nabulsi cheese. However, when producing on a large scale, cows’ milk is predominantly used to meet the increased market demand 1,2. Furthermore, Nabulsi cheese may be produced with one or more types of milk based on milk availability 6 or the purpose of production, e.g., producing Nabulsi cheese with improved stretchability and meltability, such as mashmollah cheese prepared with a combination of sheep’s and cows’ milk 7. In the past several decades, Manufacturers focused on to the utilization of non cows’ milk (camel milk, sheep milk, goat milk, and buffalo milk) in the production of cheese because they are acknowledged to have more considerable potential for functional meals from a nutritional standpoint than cows’ milk 8. Among various quality aspects of cheese, texture 9,10 and color 11,12 were of primary interest to different researchers due to the importance of those properties to the consumer. These properties are affected by the type of milk and processing method 8. Several studies were performed to investigate the use of different types of milk in the production of white soft cheese (Jibna beida) 13, Caciocavallo cheeses 14, Panela cheese 15, Picante cheese16, Minas fresh cheese 17, Feta cheese 18, Coalho cheese 19, semi hard cheese 20, soft pickled cheese (i.e., Domiati)21, soft cheeses 22. However, the impact of using different types of milk on Nabulsi cheese quality requires further elucidation. Owing to its high salt content, Nabulsi cheese is usually completely or partially desalted before consumption by soaking the cheese in water overnight 7. When buying Nabulsi cheese, the customer evaluates its quality according to color, texture, and appearance in its salted form; however, information about the effects of desalting Nabulsi cheese on its quality is also lacking. The shelf life of Nabulsi cheese is approximately 1 year. Following production, the cheese’s physicochemical properties were reported to change with storage 23, 24, 25, and previous studies also reported changes in the quality of some types of white cheese. Several studies have evaluated the microbial and/or sensory properties of Nabulsi cheese; however, there is a need to elucidate how cheese color and texture are affected by storage time. Therefore, the present study sought to understand the effects of using different proportions of sheep’s and cows’ milk, desalting cheese, and storage time on the quality of Nabulsi cheese.
Materials and Methods
Materials
Cows’ milk (moisture, 88.35% ± 0.07%; dry matter, 11.65% ± 0.07%; protein, 3.68% ± 0.25%; fat, 3.35% ± 0.07%; ash, 0.77% ± 0.05%; specific gravity, 1.03 ± 0.00; pH, 6) and sheep’s milk (moisture, 83.07% ± 0.10%; dry matter, 16.93% ± 0.10%; protein, 5.93% ± 0.04%; fat, 5.15% ± 0.21%; ash, 0.9% ± 0.11%; specific gravity, 1.04 ± 0.00; pH, 6.5 ± 0.07) were obtained from a dairy plant (Faculty of Agriculture, Al-Karak, Jordan). Coagulant (Rennimax, Spain).
Experimental Design
A factorial experiment with two replicates was used to study the effect of three factors: milk type (100% sheep’s milk, 100% cows’ milk, 50% sheep’s and 50% cows’ milk, 25% cows’ and 75% sheep’s milk, and 25% sheep’s and 75% cows’ milk), storage time (0, 6, and 12 months storage), and desalting (salted vs. desalted cheese).
Nabulsi Cheese Production
The traditional method of Humeid and Tukan 5 was followed to produce Nabulsi cheese with some modifications to the boiling step and the cheese pieces’ dimensions (Figure 1).
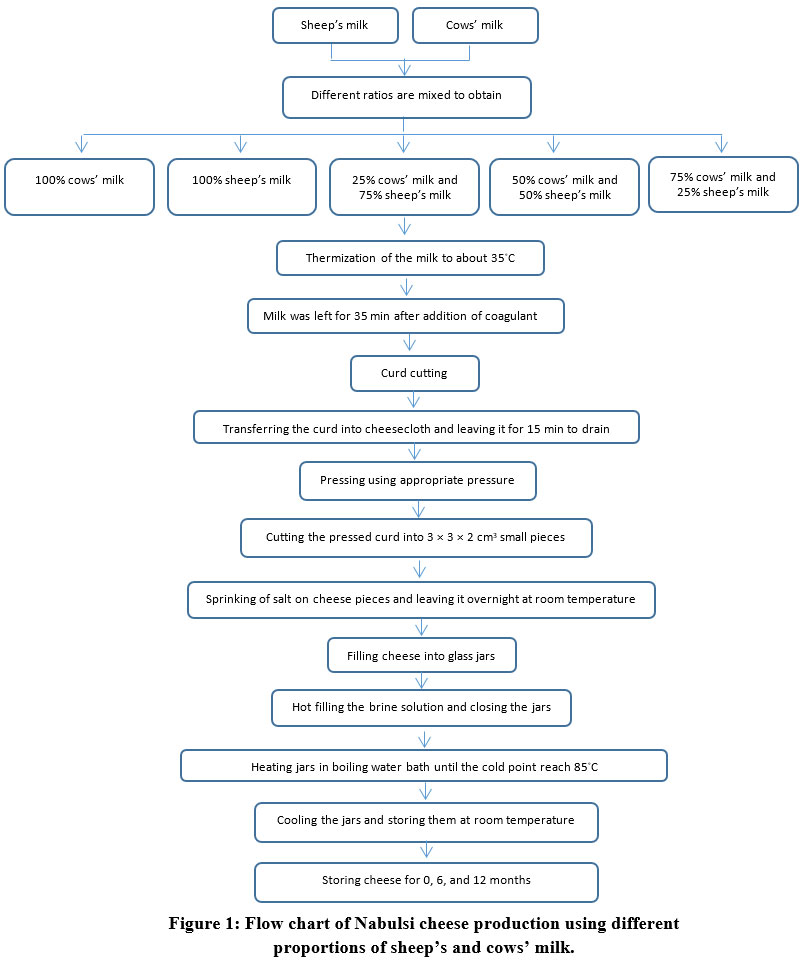 |
Figure 1: Flow chart of Nabulsi cheese production using different proportions of sheep’s and cows’ milk. |
Chemical Tests
Milk tests
A lactometer (Brannan, UK) was used to measure specific gravity; pH measurements were performed using a calibrated pH meter (Hanna, USA); acidity percentage as lactic acid was determined using titration with a standardized solution of sodium hydroxide; and the proximate composition was tested according to AOAC methods 26 using the same methods described below in “Cheese chemical tests” section.
Cheese chemical tests
The cheese was tested immediately after processing without desalting. The proximate composition was tested using AOAC methods 26 to determine moisture using the oven method, protein using the Kjeldahl method, fat content using the Gerber method, salt content using the Mohr method, and ash using the muffle furnace content. The pH of the cheese was measured using the method reported by Ayyash and Shah 27.
Cheese Yield
Cheese yield was calculated after the pressing step and after the salting steps according to the following equation:
Weight of cheese after the salting or pressing step/Weight of milk × 100.
Texture Profile Analysis (TPA) of Cheese
We used a texture analyzer (TVT 6700; Perten, Sweden) to elucidate the following TPA parameters: hardness/firmness, cohesiveness, adhesiveness, and gumminess. A 30 kg load cell was equipped onto the texture analyzer. The sample was compressed using a stainless steel cylindrical probe (height, 45 mm; diameter, 50 mm). The testing program was as follows: compression cycle, 2; starting distance from the sample, 5 mm; compression, 50%; pause between cycles, 3 s; test speed, 1 mm/s; and retract speed, 1 mm/s. Cheese pieces were tested in the salted and desalted form. To test desalted cheese, the samples were desalted before testing via soaking in water overnight in a refrigerator (5°C). Cylindrical cheese samples (height, 15 mm; diameter, 20 mm) were cut using a stainless steel cylindrical cutter and tempered at room temperature before testing. Four cheese pieces were tested from each treatment, and mean values of the results were calculated for statistical analyses. The software TexCalc (Perten, Sweden) was used to draw the curve of the relationship between distance/time and force and calculate the various parameter values. Firmness/hardness was considered the highest force recorded in the first compression cycle. Cohesiveness was calculated through the total area under the second compression cycle divided by the total area under the first compression cycle. Springiness was considered the ratio of the distance recorded during the second compression of a sample to that recorded during its initial compression. Chewiness was calculated by multiplying the firmness, cohesiveness, and springiness values. Adhesiveness was the area of the adhesive withdrawal phase when the probe was pulled away from the sample.
Color Measurements
A noncontact spectrophotometer (vs450; X rite, UK) was used to calculate the CIE color system, i.e., L*, a*, and b*, with OnColor software (CyberChrome, USA). Herein, L* denotes lightness, a* indicates red/green color, and b* represents yellow/blue color. Hunter’s whiteness index was also determined for each sample. All color values were measured for salted and desalted cheese. Desalted cheese samples were prepared according to the method described in the “Texture Profile Analysis (TPA) of Cheese” section. Four cheese pieces were tested for each treatment, and the results were averaged for statistical analysis.
Statistical Analysis
Minitab 19 (Minitab Inc., USA) was used to analyze the results. Backward elimination (α to remove = 0.05) was performed to reduce the model. The Tukey’s test was used to perform means separation, and p ≤ 0.05 indicated statistical significance. In addition, a normal probability plot of residuals was used to confirm that the model met the analysis of variance (ANOVA) assumption.
Results
Yield and Chemical Composition of Cheese
Cheese chemical composition—which was not significantly affected by milk type (Table 1)—was as follows: 41.90%–44.92% moisture, 55.09%–58.74% dry matter, 19.5%–20.9% protein, 22.75%–26.25% fat, 10.98%–12.13% ash, and 9.69%–10.16% salt, with a pH of 6.27–6.58. In brine, the salt content was 19.76%–20.87% and the pH was 6.41–6.75. The same cheese yield trend was found after pressing and dry salting (Table 1), i.e., sheep’s milk cheese had the highest yield (26.85% and 23.13% after pressing and salting, respectively), which was significantly different from the yields of cheese prepared from other types of milk. The next highest yield of cheese was prepared using 75% sheep’s milk and 25% cows’ milk (22.37% and 20.17% after pressing and salting, respectively).
Table 1: Yield and chemical composition of Nabulsi cheese produced with different ratios of sheep’s and cows’ milk.
| Treatments | Yield (%) | Chemical analysis | ||||||||||
| Type of milk | After pressing | After salting | Cheese | Brine | ||||||||
| Sheep % | Cow % | Moisture (%) |
Dry matter (%) |
Protein (%) |
Fat(%) | Ash(%) | Salt(%) | pH | Salt(%) | pH | ||
| 100 | – | 26.85 ± 0.78a | 23.13 ± 0.81a | 44.92 ± 0.54a | 55.09 ± 0.54a | 20.00 ± 0.13a | 22.75 ± 0.35a | 12.13 ± 0.02a | 10.16 ± 0.08a | 6.58 ± 0.00a | 20.69 ± 0.49a | 6.75 ± 0.05a |
| – | 100 | 14.77 ± 0.83d | 12.47 ± 0.40d | 43.17 ± 1.92a | 56.83 ± 1.92a | 20.22 ± 0.16a | 24.00 ± 1.41a | 11.53 ± 0.86a | 9.90 ± 0.30a | 6.47 ± 0.16a | 20.87 ± 0.23a | 6.63 ± 0.22a |
| 50 | 50 | 20.18 ± 0.76c | 17.64 ± 1.51bc | 43.89 ± 1.25a | 57.74 ± 1.05a | 20.90 ± 0.18a | 24.75 ± 1.00a | 11.66 ± 0.57a | 10.15 ± 0.77a | 6.37 ± 0.18a | 20.57 ± 0.35a | 6.50 ± 0.00a |
| 25 | 75 | 17.25 ± 0.35d | 15.10 ± 1.01cd | 42.90 ± 0.57a | 58.74 ± 1.04a | 20.58 ± 0.54a | 26.25 ± 1.02a | 10.98 ± 0.83a | 9.69 ± 0.76a | 6.27 ± 0.17a | 19.76 ± 0.65a | 6.41 ± 0.11a |
| 75 | 25 | 22.73 ± 0.04b | 20.17 ± 0.59ab | 41.90 ± 2.04a | 58.10 ± 2.04a | 19.5 ± 0.71a | 25.75 ± 1.06a | 11.31 ± 0.04a | 9.92 ± 0.42a | 6.44 ± 0.17a | 20.84 ± 0.16a | 6.54 ± 0.00a |
TPA
A three way ANOVA was used to investigate the main effects (milk type, storage time, and salting) with their two way (milk type*storage time, milk type*salting, and storage time*salting) and three way (milk type*storage time*salting) interactions. The three way interaction effects were presented below only when they were significant; when they were not significant, the significant results of two way interactions were presented. Main effects were presented only if no significant interaction with another factor was found.
Three TPA parameters are reported below: hardness, cohesiveness, and gumminess. The other TPA parameters, springiness and adhesiveness, were not reported because (1) springiness values (almost 1 for all treatments) were not significantly affected by the factors investigated and (2) adhesiveness values were too small to be considered practically important.
Hardness
Hardness values were significantly affected by the main effects, two way interactions, and three way interaction; therefore, only the results of the three way interaction are presented. Figure 2 shows the Pareto chart of the standardized effects of the significant factors on hardness arranged from the largest to smallest effect. Evidently, the salting of cheese had the highest standardized effect (73.52) followed by the two way interaction between salting and storage time (10.06) and the main effect of storage time (7.22).
The three way interaction effect for hardness is shown in Figure 3. Salted cheese hardness values were 12,139.6–18,010.2 g, and desalting significantly reduced the hardness values to 2327.72–8338.83 g. For salted cheese (Figure 3, A), changes in hardness during storage differed according to milk type. During storage, the hardness of cheeses made from different ratios of sheep’s and cows’ milk did not differ significantly from that of unstored cheeses, i.e., those with zero storage time. In contrast, the hardness of cheese made from 100% sheep’s milk was significantly lower (12,139.6 g) than that of cheeses made with other milk types with zero storage time. However, after 6 and 12 months of storage, the hardness values of 100% sheep’s cheese (15,964.5 and 15,320.2 g, respectively) increased significantly relative to 100% sheep’s cheese with zero storage time. The hardness of cheese made from 100% cows’ milk was 16,836.5 g at zero storage time. However, after 6 months of storage, the hardness decreased (13,374.1 g) significantly. After 12 months of storage, the hardness increased (14,976.4 g) no significantly compared with that of 100% cows’ milk–based cheese stored for 6 months and significantly with that of 100% cows’ milk–based cheese tested directly after processing. Cheese made from 50% sheep’s milk and 50% cows’ milk had the highest hardness values throughout the storage period.
In the case of desalted cheese (Figure 3 B), no significant differences were noted in terms of hardness among cheeses prepared from different types of milk at zero storage time and after 6 months of storage. However, after storing the cheeses for 12 months, cheese prepared using 100% cows’ milk showed significantly higher hardness values than cheese made from 1:1 and 3:1 sheep’s: cows’ milk mixture. Therefore, the hardness of desalted cheese prepared using a mixture of sheep’s and cows’ milk did not change significantly during 12 month storage unless the cheese contained 25% sheep’s milk and 75% cows’ milk. However, the hardness of desalted cheese made from 100% sheep’s or 100% cows’ or 3:1 cows’: sheep’s milk showed a significant increase after 12 months of storage (6524.83, 8338.83, and 5984.52 g, respectively) relative to the hardness of the same cheese types with zero storage time (3169.43, 2327.72, and 3295.2 g, respectively) and after 6 months of storage (3435.03 and 3157.14, and 3269.5 g, respectively).
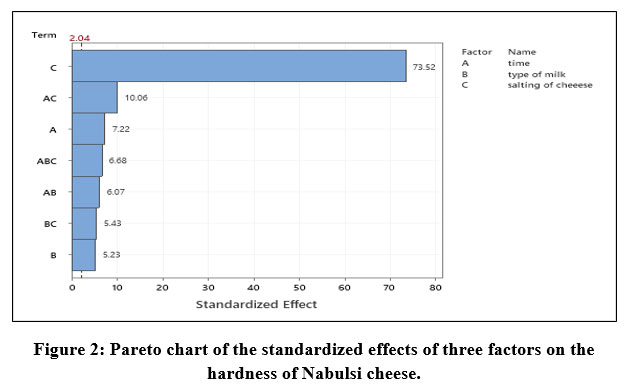 |
Figure 2: Pareto chart of the standardized effects of three factors on the hardness of Nabulsi cheese. |
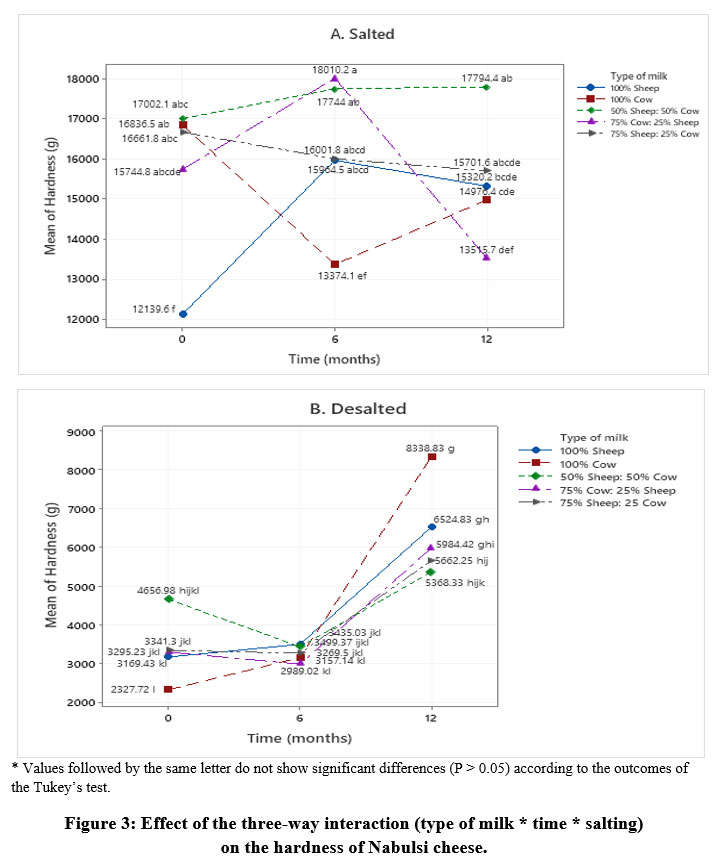 |
Figure 3: Effect of the three way interaction (type of milk * time * salting) on the hardness of Nabulsi cheese. |
Cohesiveness
Cohesiveness was significantly affected by the main effects and two way interactions, but no significant three way interaction was found. Therefore, only the results of the two way interaction are presented. The standardized effects of significant factors on cohesiveness are shown in Figure 4. Evidently, salting had the highest standardized effect (14.55) followed by milk type (9.37) and storage time (5.36).
The results of the two way interactions between the three factors are presented in Figure 5. According to the effects of storage time and the milk type when cheese was not stored (Figure 5 A), 100% sheep’s milk based cheese had the lowest cohesiveness value (0.51), which did not differ significantly from that of cheese made from 1:1 (0.55), and 3:1 (0.57) sheep’s: cows’ milk mixture although the cohesiveness values for the other cheese types were significantly higher than the values of cheese made from 100% sheep’s milk. After 6 months of storage, the cohesiveness of all cheese types increased to some extent, although the cheese made from 100% sheep’s milk had the lowest cohesiveness value (0.57) and did not show any significant difference from the cheese made from 1:1 sheep’s: cows’ milk mixture. However, cheese made from other types of milk showed significantly higher values than that made from 100% sheep’s milk. After 12 months of storage, 100% sheep’s milk cheese showed the lowest cohesiveness value (0.48); this value was significantly lower than that of the other cheese types, and no significant differences were noted among these other types of cheese.
The two way interaction between storage time and salting is shown in Figure 5 B. Desalted cheese had a significantly higher cohesiveness value than salted cheese during storage for up to 12 months. Additionally, the cohesiveness of salted and desalted cheese changed during storage. In desalted cheese, cheese stored for 6 months had the highest cohesiveness value (0.69), which was significantly higher than those of unstored cheese and cheese stored for 12 months (0.62 and 0.65, respectively). In salted cheese, cheese that was not stored exhibited the lowest cohesiveness (0.53); after 6 months of storage, cohesiveness increased no significantly to 0.56; after 12 months of storage, cohesiveness increased no significantly to 0.58 compared with that of cheese stored for 6 months and significantly compared with cheese that was not stored.
The two way interaction between milk type and salting (Figure 5 C) revealed that cohesiveness increased significantly but to different degrees for all cheese types, except for 50% sheep’s and 50% cows’ milk cheese.
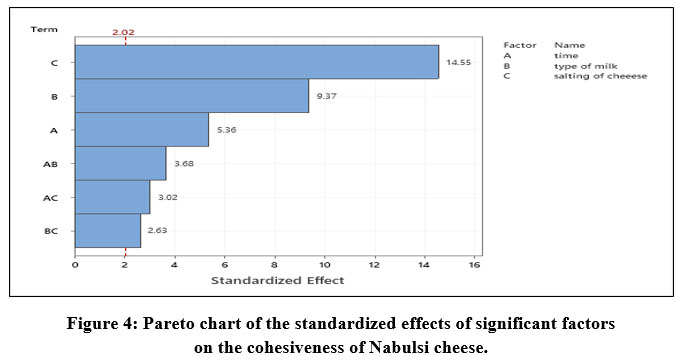 |
Figure 4: Pareto chart of the standardized effects of significant factors on the cohesiveness of Nabulsi cheese. |
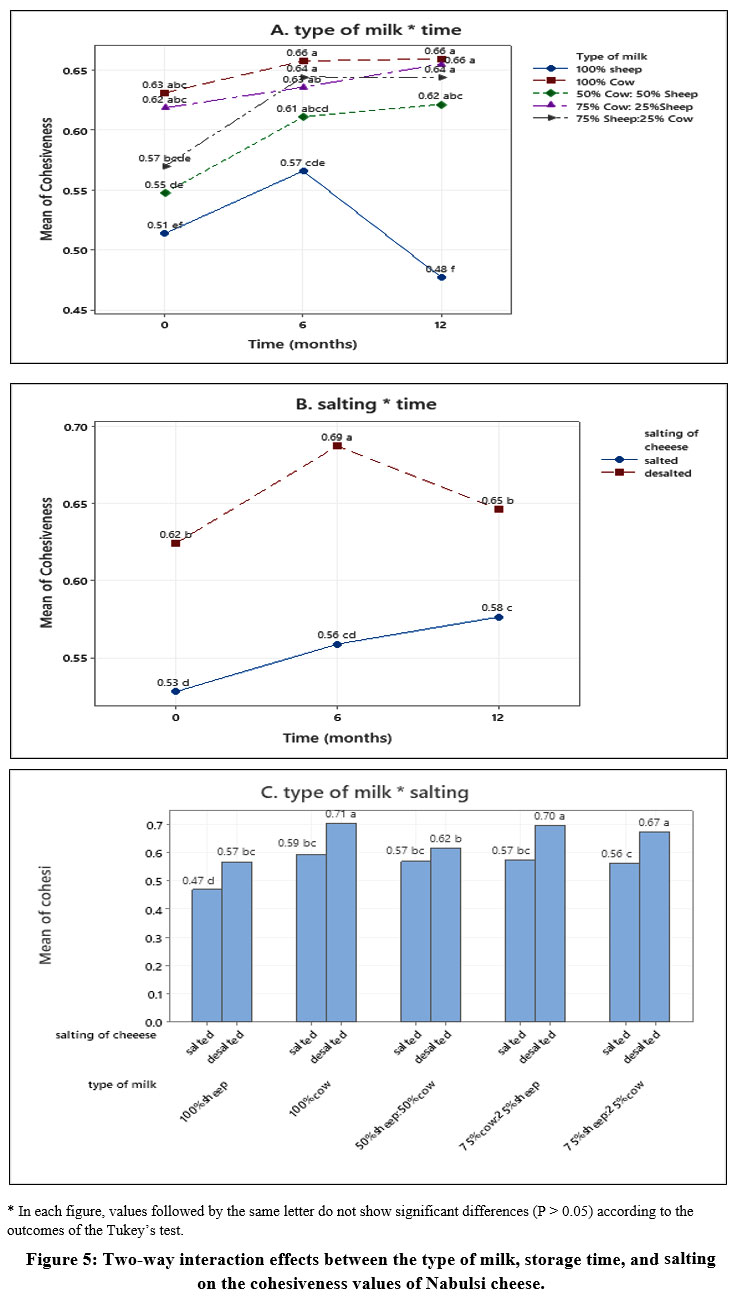 |
Figure 5: Two way interaction effects between the type of milk, storage time, and salting on the cohesiveness values of Nabulsi cheese. |
Gumminess
The main factors and their two way and three way interactions significantly affected gumminess, with salting exhibiting the highest standardized effect (Figure 6). Therefore, only the results of the three way interaction are presented. The gumminess of salted cheese was 5828.33–11,135.1 g (Figure 7A), whereas that of desalted cheese was 1548.08–5629.13 g. Desalting significantly reduced gumminess for all cheese types, although the changes in gumminess during storage differed between salted and desalted cheese. Salted cheese prepared using 100% cows’ milk or 75% sheep’s milk and 25% cows’ milk or 75% cows’ milk and 25% sheep’s milk exhibited similar gumminess throughout the storage period. However, salted cheese made from 50% sheep’s milk and 50% cows’ milk exhibited a significant increase in gumminess values after 12 months of storage compared with the gumminess of cheese with no storage time and no significantly with the gumminess of cheese after 6 months of storage. Salted cheese prepared using 100% sheep’s milk showed the lowest gumminess values at zero storage time or after storing for 12 months; however, after storing for 6 months, the gumminess significantly increased compared with cheese with no storage time and no significantly compared to cheese stored for 12 months. In desalted cheese (Figure 7B), no significant differences were found between different types of cheese stored for 0 or 6 months, with no significant changes in gumminess detected during the initial 6 month period. After 12 months of storage, the gumminess of 100% cows’ milk cheese or cheese prepared from 75% cows’:25% sheep’s milk significantly increased compared to cheese with no storage time or those stored for 6 months. Cheese made from 100% sheep’s milk, 50% sheep’s and 50% cows’ milk, and from 75% sheep’s:25% cows’ milk did not change significantly throughout the storage period.
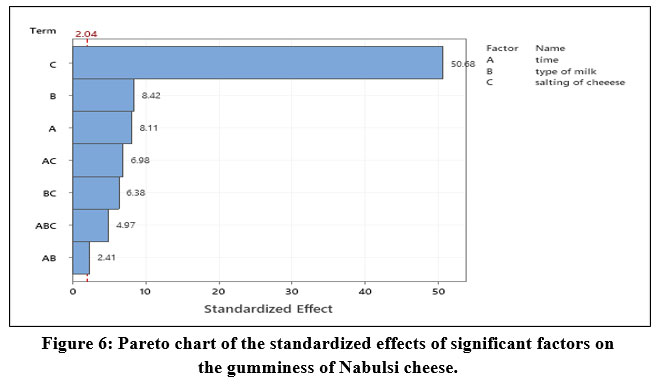 |
Figure 6: Pareto chart of the standardized effects of significant factors on the gumminess of Nabulsi cheese. |
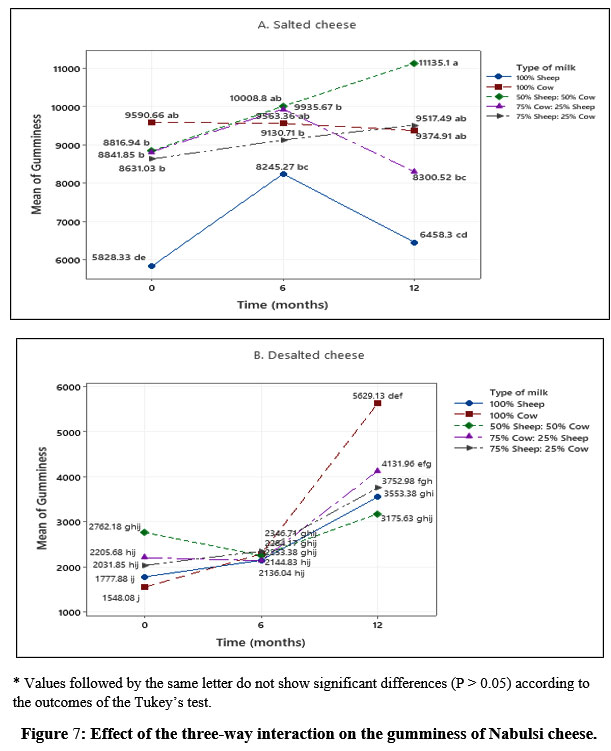 |
Figure 7: Effect of the three way interaction on the gumminess of Nabulsi cheese. |
Cheese Color
L*
L* values were significantly affected by the main effects and two way interactions between storage time and milk type and milk type and salting, although no three way interaction was found. Milk type had the highest standardized effect (8.41) followed by salting (5.56) and storage time (5.44) (Figure 8). Only the results of significant two way interactions are presented.
The effects of the interaction between milk type and storage time are shown in Figure 9. Cheese prepared using 100% sheep’s milk had the highest L* value throughout the storage period. No significant differences were noted in terms of the L* values at zero storage time among the cheese types; however, when storage time was increased, the differences in L* values increased among the cheese types. Specifically, the L* value of 100% sheep’s milk cheese changed no significantly during storage. The L* value of the cheeses prepared using 50% sheep’s and 50% cows’ milk did not show any significant differences when compared with 100% sheep’s milk cheese. To various degrees, other cheese types exhibited L* values that were significantly lower than that of 100% sheep’s milk cheese. After 12 months of storage, 100% cows’ milk cheese had the lowest L* value, which was significantly lower than that of the other cheese types.
The desalting of cheese significantly increased the L* values of all cheese types except cheeses prepared using 100% sheep’s milk and 75% sheep’s milk and 25% cows’ milk (Figure 10). After desalting, 100% sheep’s milk cheese had the highest L* value (94.78), which did not show any significant differences from that of desalted cheese prepared using 50% sheep’s milk and 50% cows’ milk (94.12). However, the other cheese types exhibited significantly lower L* values than that of 100% sheep’s milk cheese.
 |
Figure 8: Pareto chart of the standardized effects of significant factors on the lightness (L*) values of Nabulsi cheese. |
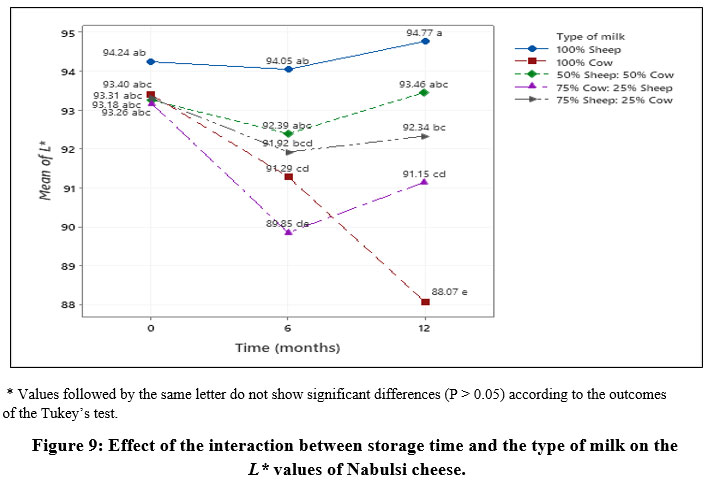 |
Figure 9: Effect of the interaction between storage time and the type of milk on the L* values of Nabulsi cheese. |
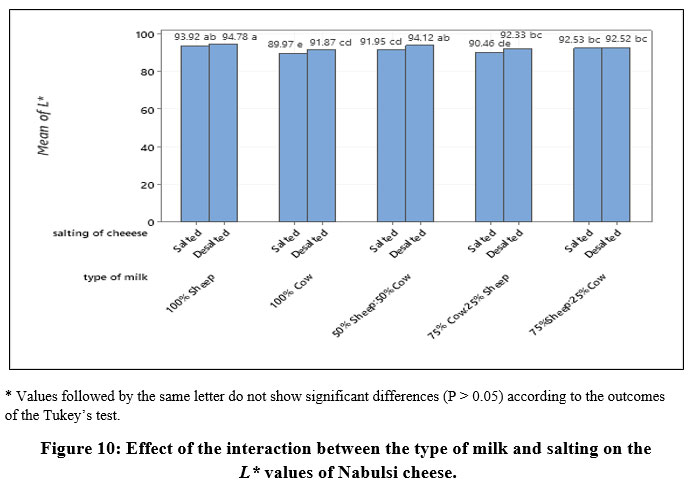 |
Figure 10: Effect of the interaction between the type of milk and salting on the L* values of Nabulsi cheese. |
a*
The a* values of cheese were significantly affected by storage time and milk type as well as their interaction effect. Storage time had the highest standardized effect (8.73) followed by milk type (5.70) and their interaction (3.01) (Figure 11). Therefore, we have only presented the results of the interaction between milk type and storage time.
The a* values of cheeses were between −1.98 and 4.22 (Figure 12). With zero storage time, a* values did not differ significantly among the cheese types. However, when storage time was increased, the a* values of different cheese types increased to different degrees. Cheese prepared using 100% sheep’s milk had the lowest a* value, which changed no significantly during storage. After 6 months of storage, cheese prepared using 75% cows’ milk and 25% sheep’s milk had the highest a* value (4.22), which differed significantly from that 100% sheep’s milk cheese; however, no significant differences were noted between sheep’s milk cheese and other types of cheese. After 12 months of storage, cheeses prepared using 100% cows’ milk and 75% cows’ milk and 25% sheep’s milk had significantly higher a* values than that of 100% sheep’s milk cheese.
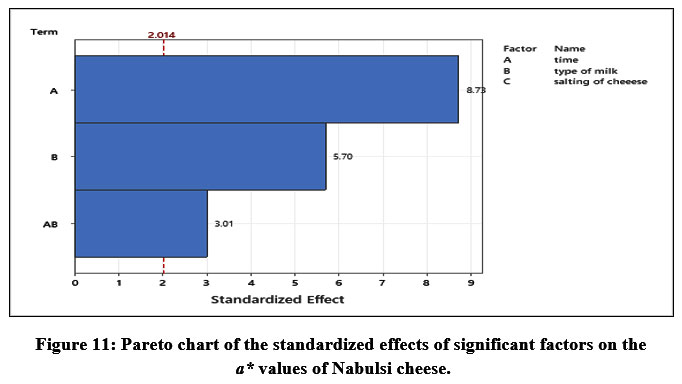 |
Figure 11: Pareto chart of the standardized effects of significant factors on the a* values of Nabulsi cheese. |
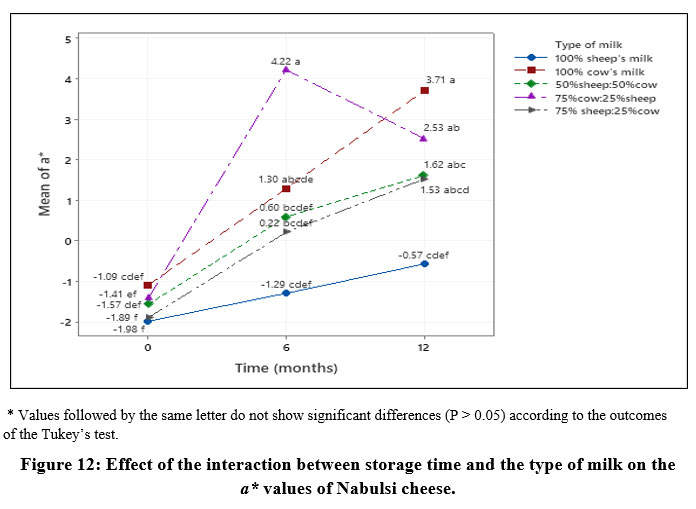 |
Figure 12: Effect of the interaction between storage time and the type of milk on the a* values of Nabulsi cheese. |
b*
The b* values of cheese were affected by the main effects and the two way interactions between storage time* type of milk, and type of milk* salting with no three way interaction (Figure 13); thus, only the results of significant two way interactions are presented. The results of the two way interaction between time and type of milk are shown in Figure 14 A. At no storage time, cheese made from sheep’s milk had the lowest b* value (13.74). This value was significantly different from that of the cheese made from 75% cows’:25% sheep’s milk (16.19), with no significant differences observed with other types of cheese. During storage, b* values of different cheese types changed no significantly except for cheese made from cows’ milk. The b* values of this cheese significantly increased (17.15) after 12 months of storage compared to cheese stored at 0 and 6 months (14.6, and 14.59, respectively). At the end of the storage period, cheese made from 1:1 and 3:1 sheep’s: cows’ milk mixtures b* values (14.39 and 14.85, respectively) did not show any significant differences from cheese made from sheep’s milk (12.91). Desalting of different cheese types significantly decreased b* values except in cheese made from 3:1 and 1:3 cows’: sheep’s milk mixtures (Figure 14 B)
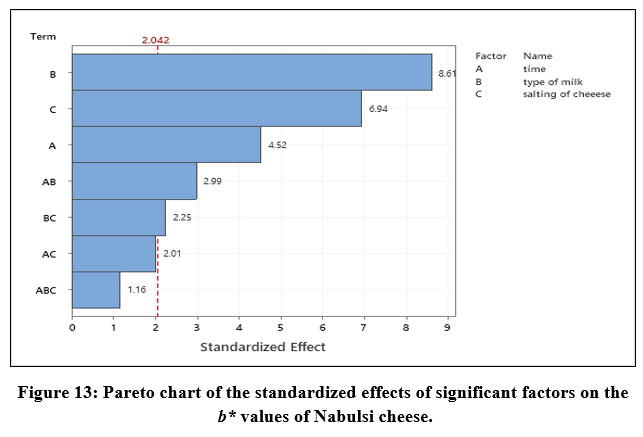 |
Figure 13: Pareto chart of the standardized effects of significant factors on the b* values of Nabulsi cheese. |
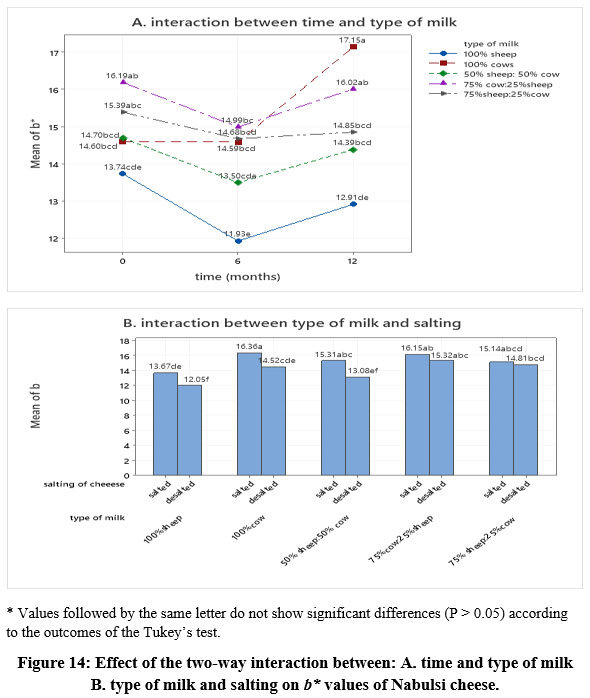 |
Figure 14: Effect of the two way interaction between: A. time and type of milk B. type of milk and salting on b* values of Nabulsi cheese. |
Hunter’s Whiteness Index
Hunter’s whiteness index was affected by the main effects (milk type, storage time, and salting) and the two way interaction between storage duration and the type of milk used. Milk type had the highest standardized effect (8.92), followed by salting (6.81), and the interaction between the duration of storage and the types of milk used (3.56) (Figure 15). Therefore, only the results of salting and the interaction effect between the storage period and milk type have been presented.
The desalting of cheese significantly increased the Hunter’s whiteness index from 49.05 (salted) to 53.84 (desalted) (Figure 16). Figure 17 shows the effects of the interaction between the type of milk and storage duration. At zero storage time, no significant difference existed between the Hunter’s whiteness index of 100% sheep’s milk cheese (56.60) and 100% cows’ milk cheese (52.29). However, when storage time was increased, the index value differed significantly between these cheese types. Specifically, the Hunter’s whiteness index of cheese prepared using 100% cows’ milk decreased during storage to reach the lowest value at 12 months of storage, which was significantly lower than that of cheeses prepared using 100% sheep’s milk, 50% sheep’s milk and 50% cows’ milk, and 75% sheep’s milk and 25% cows’ milk. Evidently, mixing sheep’s milk and cows’ milk helped stabilize the Hunter’s whiteness index throughout the storage period. For example, mixing these milk types in a 1:1 ratio resulted in a Hunter’s whiteness index that was not significantly different from that of cheese prepared using 100% sheep’s milk.
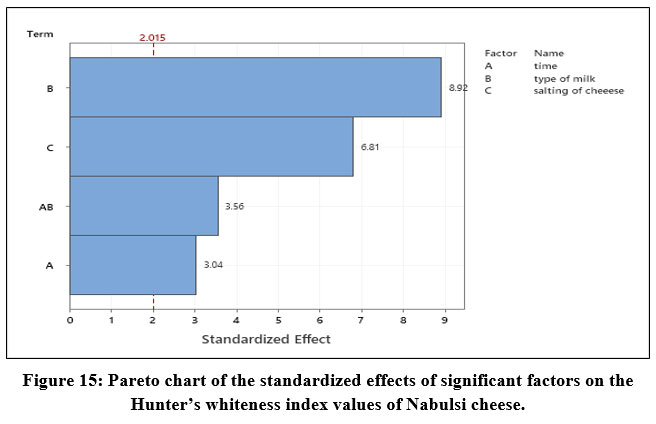 |
Figure 15: Pareto chart of the standardized effects of significant factors on the Hunter’s whiteness index values of Nabulsi cheese. |
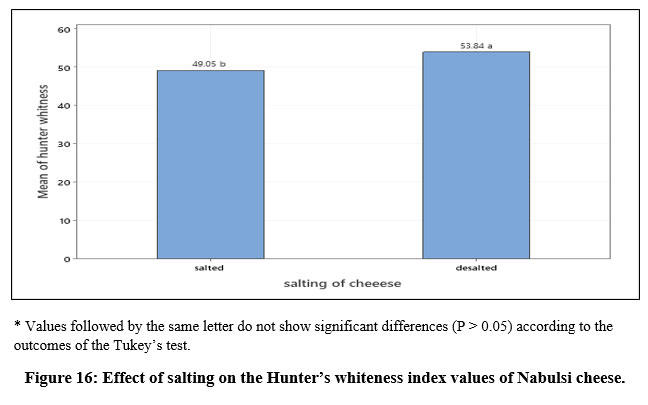 |
Figure 16: Effect of salting on the Hunter’s whiteness index values of Nabulsi cheese. |
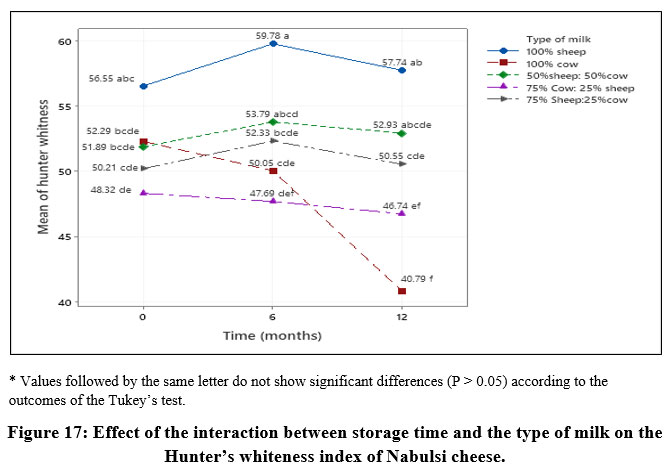 |
Figure 17: Effect of the interaction between storage time and the type of milk on the Hunter’s whiteness index of Nabulsi cheese. |
Discussion
In this section, the results of different cheese types will be discussed and compared to sheep’s milk cheese because it is traditionally considered to be of optimal quality in terms of composition, texture, and color.
Yield and Chemical Composition of Cheese
No significant differences were found in the chemical composition of different cheese types, which was consistent with the findings of El-Demerdash et al. 28 for Halloumi cheese produced with different ratios of goat’s and cows’ milk and the results of Sant’Ana 17 for Minas cheese prepared from a mixture of cows’ and goats’ milk. However, our results contradict those of Milici et al. 29, who reported that the Halloumi cheese manufactured from sheep’s and goat’s milk did not show differences in terms of their chemical composition, whereas the compositions of these cheeses were different from that of Halloumi cheese prepared using cows’ milk. Another study reported significant differences between Bulgarian white brined cheeses prepared using buffaloes’ or cows’ milk. Kaminarides et al.30 found no significant differences among four types of Halloumi cheese prepared from different goat’s and sheep’s milk mixtures in terms of moisture, acidity, total protein, and ash content, as well as pH, although significant differences in fat, calcium, and soluble protein content were found. The chemical composition of Nabulsi cheese in the present study was similar to that reported by Humeid et al. 6 for Nabulsi cheese prepared using sheep’s milk, except for protein content (61.1%). The outcomes of the present conformed with those of Ayyash and Shah 27 for cows’ milk based Nabulsi cheese in terms of fat and ash content and pH, although these authors reported higher moisture and protein values (59.12% and 25.2%, respectively). Interestingly, our results differed from those of Al Dabbas et al. 31 for freshly brined unheated Nabulsi cheese, with them reporting higher values for moisture content (61.1%) and lower values for protein, fat, ash, and salt content (13.6%, 17.2%, 8.0%, and 5.2%, respectively). The chemical composition of Nabulsi cheese is influenced by the processing method, seasonal variation, milk type used, and animal feed 6,8,31. Several studies have reported differences in yield for cheeses prepared using different types of milk, and these differences arise are a result of differences in milk composition 30,32,33.
TPA
Consumers use texture as one of the main indicators for judging cheese types 34.
The present TPA results indicated that changes in the texture of cheese types were different according to storage time and between salted and desalted cheese. Thus, the common customer practice of buying Nabulsi cheese based on its texture in the salted form is questionable. Indeed, the salting of cheese had the most prominent effect on its texture. Desalting Nabulsi cheese significantly decreased its hardness and gumminess and increased its cohesiveness in a cheese type dependent manner. A simultaneous decrease in hardness and an increase in cohesiveness were also reported by Ayyash and Shah 27. Considering Nabulsi cheese is eaten in its desalted form, it was interesting that mixing different milk types led to consistency in various texture profile values throughout the storage period except for in cheese made from 3:1 cows’: sheep’s milk mixture. Additionally, mixing cows’ milk with sheep’s milk increased the cohesiveness of the cheese when compared with 100% sheep’s milk cheese. The gumminess of cheese prepared using cows’ milk increased significantly after 12 months of storage compared with that of the other cheese types.
Several factors affect the texture of cheese during storage, e.g., salt absorption during storage and its effect on cheese moisture content 35, proteolysis during storage 27,36, and different casein structures and concentrations 37. All three factors appear to be affected by the different cheese types in the present study to varying degrees. Considering the salt absorption factor, several studies have reported different salt concentrations in cheese prepared using different milk types. For example, Halloumi cheese prepared using cows’ or mixed milk had a salt content higher than that of cheese prepared using sheep’s milk 37. Additionally, changes in salt concentration affect the moisture content of cheese and increase hardness 27. Regarding the proteolysis factor, several studies have reported a decrease in hardness during the storage of brined cheese. This seems to contradict our results which indicated that the hardness of different desalted cheese types did not show significant differences within a storage period of 6 months. However, after 12 months of storage, a significant increase was noted in the hardness of the cheeses prepared using cows’ milk, sheep’s milk, or 50% sheep’s milk and 50% cows’ milk. The insignificant change in hardness of desalted cheese during storage for up to 6 months and the subsequent increase in hardness after storage for up to 12 months could be related to 1) a decrease in the activity of heat resistant endogenous enzymes which was influenced by cheese type, the inhibitory effect of salt treatment, and heat treatments applied to different cheese types 27, or 2) the strengthening effect of moisture losses resulting from salt diffusion into cheese overcoming the proteolysis effect 16. Considering the third factor mentioned above, changes in the hardness of Nabulsi cheese after 12 months (as well as other property changes) could be related to changes in its casein structure. In the present study, the values of springiness (data not shown) were almost 1 for all samples, and the results of adhesiveness (data not shown) were too small and not significant, and this was consistent with 27, who reported that the adhesiveness values of Nabulsi cheese made from cows’ milk did not change significantly during storage.
To the best of our knowledge, there are no scientific reports examining the use of different types of milk on the quality of Nabulsi cheese. Regarding the TPA of Nabulsi cheese, the only previous study was by Ayyash and Shah 27, who monitored the TPA of salted Nabulsi cheese made from cows’ milk every 30 days for 6 months. The results of hardness for salted cheese in the present study (16836.5 and 13374.1 g at 0 and 6 months, respectively) were comparable to their findings (18150 and 13526 g at 0 and 6 months, respectively). However, the gumminess results reported the the present study (9590.66 and 9563 g at 0 and 6 months, respectively) were lower than their findings (51526 and 92286 g at 0 and 6 months, respectively). Additionally, they reported an increase in the cohesiveness of salted cheese, which is consistent with the present findings.
The effects on the texture of mixing different milk types were reported for different types of cheese. The texture of Caciocavallo cheese in terms of hardness was improved by substituting some of the cows’ milk with sheep’s milk 14. Mallatou 18 reported that as the proportion of goats’ milk increased in a mixture of milk made from sheep’s and goats’ milk, the hardness of Feta cheese increased. Using an equal volume of goats’ and cows’ milk for the preparation of Minas cheese resulted in higher hardness and lower gumminess than cheese made from one type of milk 17. Chewiness and cohesiveness were not affected for Coalho cheese made from a 1:1 mixture of goats’ milk and cows’ milk compared to cheese solely made from goats’ milk or cows’ milk; however, it had a lower hardness than cheese made from goats’ milk 19. The texture of Picanta cheese was not affected by mixing sheep’s milk and goat milk 16.
Cheese Color
Contrary to the TPA results, no single factor consistently had the largest significant effect on all measured color parameters. Milk type had the highest effects on L*, b*, and Hunter’s whiteness index values, whereas storage time had the highest effect on a* values. Color is an important quality in the food and bioprocessing industries, and it influenced consumer choice and preferences 38,39. In Nabulsi cheese, whiteness is an indicator of the milk type used during production, with yellow cheese indicating the use of cows’ milk 12 and its yellow color related to the presence of β carotene retained from the cows’ feed. In contrast, sheep convert β carotene to vitamin A, which is colorless 11. The color values in this study changed with time in a manner dependent on cheese type. Choudy et al. 11 related the change of color with time to the change in cheese structure and composition with time. Milovanovic et al. 12 reported that change in cheese surface color was related to changes in the microstructural surface.
L* is a measurement of lightness, the characteristic that allows any color to be equated to a grayscale intensity level between black and white 38. In this study, the L* value of cheese prepared using 50% sheep’s milk and 50% cows’ milk showed no significant differences from that of 100% sheep’s milk cheese, which had the highest L* value in the present study and showed nonsignificant changes throughout the storage period. In comparison, L* of other types of cheese decreased by varying degrees with time. This is consistent with the results reported by Sabbagh et al 40, who reported a decrease in L* for Iranian white brined cheese through 60 days of storage time but contrasted with the observations of cheese made from sheep’s milk and 1:1 sheep’s: cows’ mixture milk in the study. This demonstrated that mixing sheep’s milk with cows’ milk in a 1:1 ratio gave an L* insignificantly different from that made from sheep’s milk, and mixing the two types of milk with other ratios increased the L* significantly compared to cheese made from cows’ milk. The increase in L* values in cheese produced by mixing non cows’ milk with cows’ milk was reported by Queiroga et al. 19, who added goats’ milk to cows’ milk in a ratio of 1:1. They related this increase in L* to the smaller size of fat globules in goats’ milk compared to those in cows’ milk. The increase in L* upon desalting (Figure 10) could be related to the increased moisture content, which was consistent with previous findings that found a positive correlation between the L* values and moisture in cheese samples 41. The L* values of cheese made from cows’ and sheep’s milk with no storage time (93.40 and 94.24, respectively) were higher for cheese made from cows’ and sheep’s milk previously reported 12 (82.6 ± 9.2 and 83.3 ± 6.4, respectively). However, in the present study after 12 months of storage, the L* were 88.07 and 94.77 for cheese made from cows’ and sheeps’ milk, respectively. Previously, the L* value of Feta cheese was reported to be 93.5 39.
The a* values, which measure the degree of (+) redness or (−) greenness 12, increased to varying degrees depending on the type of cheese. This was consistent with previous findings 12,40 and this increase during storage was predominantly related to increases in cheese components during storage 12.
Additionally, the a* values of cheese prepared using 50% sheep’s milk and 50% cows’ milk and 75% sheep’s milk and 25% cows’ milk did not differ from that of 100% sheep’s milk–based cheese. These differences in the rate and extent of a* increase could be related to differences in fatty acid composition as described previously 19. The a* values for cheese made from cows’ and sheep’s milk at zero storage time were −1.09 and −1.98, respectively. Whereas according to previous research, it was 0.3 ± 91 and −0.7 ± 2.8, respectively 12. By the end of the storage time, the values in this study were 3.71 and −0.57 for cheese made from cows’ and sheep’s milk, respectively. A value of −1.10 for a* was reported for Feta cheese 39.
The b* values, which measure the degree of (+) yellowness or (−) blueness 12, were higher in cheese made from a mixture of milk from sheep’s and cows’ milk depending on the ratio of cows’ milk. The increase in b* values in cheese containing cows’ milk was consistent with the findings of several previous studies 11,15,17. In this study, only b* values of cheese made from 100% cows’ milk increased significantly during storage (Figure 14 A). This concurs with previous results 12,40 and contrasts with the results of other cheese types. The increase in b* values associated with storage is primarily related to the increase in cheese components during storage resulting from salt diffusion into the cheese 12, the formation of proteolysis products, and the Maillard reaction 19.
In this study, cheese samples from different types of cheese had high L* values, and higher a* values than b* values, thereby indicating that cheese’s colors are attributed to levels of white yellowness color. The degree of whiteness could be expressed using a single value known as the whiteness index that mathematically combines lightness and yellow blue color into a single value 12. Since the whiteness index is calculated from the L*, a*, and b* values, it is affected by the same factors discussed previously for these factors.
Conclusion
In summary, mixing the milk from sheep and cows in different proportions and combinations did not significantly affect the chemical composition of Nabulsi cheese, although it did affect the yield of cheese, with the highest and lowest yields found for 100% sheep’s milk cheese and 100% cows’ milk cheese, respectively. In addition, the desalting of Nabulsi cheese significantly decreased its hardness and gumminess and increased its cohesiveness at different levels depending on the cheese type used in production. Furthermore, mixing cows’ milk with sheep’s milk increased the cohesiveness of the produced cheese. During a 12 month storage period, gumminess was constant except in cheese prepared using 100% cows’ milk, for which gumminess increased significantly after 12 months of storage. In terms of color parameters, milk type most affected L*, b*, and Hunter’s whiteness index values, whereas storage time most affected a* values. Importantly, the L* and a* values did not differ between cheeses prepared using 100% sheep’s milk and from 50% sheep’s milk and 50% cows’ milk, and these two cheese types had the highest whiteness index values throughout the storage period. Taking all tested parameters into consideration, we conclude that Nabulsi cheese prepared using an equal proportion of sheep’s and cows’ milk or 100% sheep’s milk has a similar quality, although the mixed cheese exhibits increased cohesiveness. Owing to the nearly complete absence of information regarding the effects of mixing sheep’s milk and cows’ milk in different proportions, salting of cheese, and storage on the quality of Nabulsi cheese, the results of this study provide insight into the factors that could be used to optimize the quality of Nabulsi cheese during storage. Additionally, these findings will be useful to producers wishing to expand their production of Nabulsi cheese by mixing sheep’s milk and cows’ milk without compromising the quality of the cheese produced. Finally, these results are useful for customers and consumers buying Nabulsi cheese in its salted form because it demonstrates how the quality of cheese changes after desalting.
Acknowledgement
Author would like to acknowledge the mutah university.
Conflict of Interest
The author(s) declares no conflict of interest
Funding Sources
This research was funded by the Deanship of scientific research at Mutah University. the grant number is 120/14/201.
References
- Tamime AY, ed. Brined Cheeses. Blackwell Pub.; 2006
CrossRef - Toufeili I, Ozer B. Brined cheeses. In: Brined Cheeses. 2007:188-210. doi:10.1002/9780470995860.ch6
CrossRef - Haddadin M, Nabulsi ShahinR. A Jordanian cheese. Dairy Industries International. 1995;60(7). Accessed October 20, 2022. https://www.elibrary.ru/item.asp?id=2472017
- Alichanidis E, Polychroniadou A. Characteristics of major traditional regional cheese varieties of East Mediterranean countries: A review. Dairy Science and Technology. 2008;88(4-5):495-510. doi:10.1051/dst:2008023
CrossRef - Humeid MA, Tukan S. [Toward improving the traditional method of producing boiled brined white cheese (Nablusi cheese)]. Dirasat (Jordan). Published online; 1986. Accessed October 21, 2022. https://scholar.google.com/scholar_lookup?title=%5BToward+ improving+the+traditional +method+of +producing+boiled+brined +white+cheese +%28Nablusi +cheese%29%5D&author= Humeid%2C+M.A.&publication_ year=1986
- Humeid MA, Tukan SK, Yamani MI. In bag steaming of white brined cheese as a method for preservation. Milchwissenschaft. 1990;45(8):513-516
- Abu-Alruz K, Mazahreh AS, Quasem HM, Hejazin RK, El-Qudah JM. Effect of proteases on meltability and stretchability of Nabulsi cheese. American Journal of Agricultural and Biological Sciences. 2009;4(3):173-178. doi:10.3844/ajabssp.2009.173.178
CrossRef - Boukria O, El Hadrami EM, Boudalia S, Safarov J, Leriche F, Aït-Kaddour A. The effect of mixing milk of different species on chemical, physicochemical, and sensory features of cheeses: A review. Foods. 2020;9(9):1309. doi:10.3390/foods9091309
CrossRef - Hesarinejad MA, Rafe A, Sadeghian A, et al. Fabrication of elastic gel systems of Ricotta cheese containing some hydrocolloids in stuffed olive. FSCT. 2020;17(101):81-91. doi: 10.52547/fsct.17.101.81
CrossRef - Hesarinejad MA, Lorenzo JM, Rafe A. Influence of gelatin/guar gum mixture on the rheological and textural properties of restructured ricotta cheese. Carbohydrate Polymer Technologies and Applications. 2021;2:100162. doi:10.1016/j.carpta.2021.100162
CrossRef - Chudy S, Bilska A, Kowalski R, Teichert J. Colour of milk and milk products in CIE L*a*b* space. Medycyna Weterynaryjna. 2020;76(1):6327-2020. doi:10.21521/mw.6327
CrossRef - Milovanovic B, Djekic I, Miocinovic J, et al. What is the color of milk and dairy products and how is it measured? Foods. 2020;9(11):1629. doi:10.3390/foods9111629
CrossRef - Siddig SM, Sulieman AME, Salih ZA, Abdelmuhsin AA. Quality characteristics of white cheese (Jibna-beida) produced using camel milk and mixture of camel milk and cow milk. International Journal of Food Science and Nutrition Engineering. 2016;3(6):49-54
- Niro S, Fratianni A, Tremonte P, et al. Innovative Caciocavallo cheeses made from a mixture of cow milk with ewe or goat milk. Journal of Dairy Science. 2014;97(3):1296-1304. doi:10.3168/jds.2013-7550
CrossRef - Ramírez-López C, Vélez-Ruiz JF. Effect of goat and cow milk ratios on the physicochemical, rheological, and sensory properties of a fresh panela cheese. Journal of Food Science. 2018;83(7):1862-1870. doi:10.1111/1750-3841.14195
CrossRef - Freitas AC, Malcata FX. Effects of different ripening procedures on the final characteristics of picante cheese. Zeitschrift für Lebensmitteluntersuchung und -Forschung A. 1998;207(4):281-291. doi:10.1007/s002170050334
CrossRef - Sant’Ana AMS, Bezerril FF, Madruga MS, et al. Nutritional and sensory characteristics of Minas fresh cheese made with goat milk, cow milk, or a mixture of both. Journal of Dairy Science. 2013;96(12):7442-7453. doi:10.3168/jds.2013-6915
CrossRef - Mallatou H, Pappas CP, Voutsinas LP. Manufacture of feta cheese from sheep’s milk, goats’ milk or mixtures of these milks. International Dairy Journal. 1994;4(7):641-664. doi:10.1016/0958-6946(94)90039-6
CrossRef - Queiroga R de CR do E, Santos BM, Gomes AMP, et al. Nutritional, textural and sensory properties of Coalho cheese made of goats’, cows’ milk and their mixture. LWT – Food Science and Technology. 2013;50(2):538-544. doi:10.1016/j.lwt.2012.08.011
CrossRef - Sheehan JJ, Patel AD, Drake MA, McSweeney PLH. Effect of partial or total substitution of bovine for caprine milk on the compositional, volatile, non-volatile and sensory characteristics of semi-hard cheeses. International Dairy Journal. 2009;19(9):498-509. doi:10.1016/j.idairyj.2009.03.009
CrossRef - Shahein MR, Hassanein AM, Zayan AF. Evaluation of Soft Cheese Manufactured from Camel and Buffalo Milk. Published Online 2014
- Derar AMA EZI. Compositional content of white cheese manufactured from mixtures of camel and sheep milk during storage. Journal of Food and Nutritional Disorders. 2014;03(3). doi:10.4172/2324-9323.1000145
CrossRef - Shahab Lavasani AR, Ehsani MR, Mirdamadi S, Ebrahim Zadeh Mousavi MA. Changes in physicochemical and organoleptic properties of traditional Iranian cheese Lighvan during ripening. International Journal of Dairy Technology. 2012;65(1):64-70. doi:10.1111/j.1471-0307.2011.00724.x
CrossRef - Lazárková Z, Šopík T, Talár J, et al. Quality evaluation of white brined cheese stored in cans as affected by the storage temperature and time. International Dairy Journal. 2021;121:105105. doi:10.1016/j.idairyj.2021.105105
CrossRef - Kondyli E, Pappa EC, Svarnas C. Ripening changes of the chemical composition, proteolysis, volatile fraction and organoleptic characteristics of a white-brined goat milk cheese. Small Ruminant Research. 2016;145:1-6. doi:10.1016/j.smallrumres.2016.10.022
CrossRef - AOAC. Official Methods of Analysis of AOAC International. 21st ed. AOAC International; 2019
- Ayyash MM, Shah NP. The effect of substituting NaCl with KCl on Nabulsi cheese: Chemical composition, total viable count, and texture profile. Journal of Dairy Science. 2011;94(6):2741-2751. doi:10.3168/jds.2010-3976
CrossRef - El-Demerdash ME, Metwalli SAH, Hashem ME. Study on producing halloumi cheese from different types of milk. Egyptian Journal of Animal Production. 2008;45(1):133-139. doi:10.21608/ejap.2008.104507
CrossRef - Milci S, Goncu A, Alpkent Z, Yaygin H. Chemical, microbiological and sensory characterization of Halloumi cheese produced from ovine, caprine and bovine milk. International Dairy Journal. 2005;15(6-9):625-630. doi:10.1016/j.idairyj.2004.10.009
CrossRef - Kaminarides S, Rogoti E, Mallatou H. Comparison of the characteristics of halloumi cheese made from ovine milk, caprine milk or mixtures of these milks. International Journal of Dairy Technology. 2000;53(3):100-105. doi:10.1111/j.1471-0307.2000.tb02670.x
CrossRef - Al-Dabbas MM, Saleh M, Abu-Ghoush MH, Al-Ismail K, Osaili T. Influence of storage, brine concentration and in-container heat treatment on the stability of white brined Nabulsi cheese. International Journal of Dairy Technology. 2014;67(3):427-436. doi:10.1111/1471-0307.12139
CrossRef - Ozer B, Atasoy F, Akin S. Some properties of Urfa cheese (a traditional white-brined Turkish cheese) produced from bovine and ovine milks. International Journal of Dairy Technology. 2002;55(2):94-99. doi:10.1046/j.1471-0307.2002.00040.x
CrossRef - Pappa EC, Kandarakis I, Mallatou H. Effect of different types of milks and cultures on the rheological characteristics of Teleme cheese. Journal of Food Engineering. 2007;79(1):143-149. doi:10.1016/j.jfoodeng.2006.01.038
CrossRef - Sasmazer RC, Korukluoglu M, Ginoyan RV, Platova GI. White cheese texture profile at different storage temperatures. IOP Conference Series: Earth and Environmental Science. 2022;1052(1):012061. doi:10.1088/1755-1315/1052/1/012061
CrossRef - Kaya S. Effect of salt on hardness and whiteness of Gaziantep cheese during short-term brining. Journal of Food Engineering. 2002;52(2):155-159. doi:10.1016/S0260-8774(01)00098-X
CrossRef - Fox PF, O’Connor TP, Mcsweeney PLH, Guinee TP, O’Brien NM. Cheese: Physical, biochemical, and nutritional aspects. In: Taylor SL, ed. Advances in Food and Nutrition Research. Vol 39. Academic Press; 1996:163-328. doi:10.1016/S1043-4526(08)60075-3
CrossRef - Aminifar M, Hamedi M, Emam-Djomeh Z, Mehdinia A. The effect of ovine and bovine milk on the textural properties of Lighvan cheese during ripening. International Journal of Dairy Technology. 2013;66(1):45-53. doi:10.1111/1471-0307.12009
CrossRef - Pathare PB, Opara UL, Al-Said FAJ. Colour measurement and analysis in fresh and processed foods: A review. Food and Bioprocess Technology. 2013;6(1):36-60. doi:10.1007/s11947-012-0867-9
CrossRef - Ramõrez-Navas Js, De Stouvenel ar. Characterization of Colombian Quesillo Cheese by Spectrocolorimetry. 2012;19(2):178-185
CrossRef - Sabbagh N, Gheisari HR, Aminlari M. Monitoring the chemical and microbiological changes during ripening of Iranian probiotic low-fat white cheese. American Journal of Animal and Veterinary Sciences. 2010;5(4):249-257. doi:10.3844/ajavsp.2010.249.257
CrossRef - Álvarez S, Fresno M, Méndez P, Castro N, Fernández JR, Sanz Sampelayo MR. Alternatives for improving physical, chemical, and sensory characteristics of goat cheeses: The use of arid-land forages in the diet. Journal of Dairy Science. 2007;90(5):2181-2188. doi:10.3168/jds.2006-506
CrossRef
Accepted on: 10 Mar 2023
Second Review by: Richard Trevor Wilson United kingdom , Shubhendra Singh India
Final Approval by: Dr. Prasad S. Variyar


Web of Science Coverage
Emerging Sources Citation Index (ESCI)
2024 Journal Impact Factor: 1.1
Scopus Journal Metrics
CiteScore 2025: 2.6
CiteScore Details
Sustainable Nutrition: Food Systems, Nutrient Retention, and Public Health Impact
![]()
This journal is a member of, and subscribes to the principles of, the Committee on Publication Ethics (COPE)


