Method Optimization for Quantification of GABA and Isoflavone Aglycones in Germinated Soybean
Dinh T Tran1*
, Daylan A. Tzompa-Sosa2, Thuy Anh Thi Nguyen1 and Koen Dewettinck2 1Faculty of Food Science and Technology, Vietnam National University of Agriculture, Hanoi, Vietnam.
2Department of Food Technology, Safety and Health, Ghent University, Ghent, Belgium.
Corresponding Author E-mail: ttdinh@vnua.edu.vn
DOI : http://dx.doi.org/10.12944/CRNFSJ.11.1.7
Download this article as:
![]()
Germinated soybean is rich in bioactive compounds such as γ-aminobutyric acid (GABA), polyphenols, and flavonoids. Thus, quantification of these components is critical for assessing nutritional value of soybean after germination and processing. In the current research, methods for determination of GABA, daidzein, genistein, and glycitein in germinated soybeans using high-performance liquid chromatography with ultraviolet-visible detector (HPLC-UV-VIS) were optimized. Then, soybean germination time was optimized in ‘DT84’ and ‘DT51’, two Vietnamese soybean cultivars. These cultivars were soaked for 1 h, 2 h, 3 h, 4 h, and 5 h with water-to-bean ratio of 1:5 at 26 - 28 ºC to initiate germination. After being soaked, the seeds were germinated, dried, and ground into powder for quantification of GABA and isoflavone aglycones. The highest concentration of GABA, daidzein and genistein were reached after 1 h of bean soaking. Further, germinated ‘DT51’ had higher GABA and lower genistein and daidzein content than germinated ‘DT84’.Previous studies had reported the extraction and quantification of GABA and isoflavone aglycones in various food matrices. However, in this study we performed optimization of these procedures in a soybean matrix and showed potential of germination as a low-cost processing to boost the nutritional quality of soybean.
KEYWORDS:γ-aminobutyric acid (GABA); Daidzein; Genistein; Germination; Low-Cost Processing; Nutraceuticals
Introduction
Soybean, commonly known as Glycine max (L.) Merrill, provides all essential amino acids and high-quality protein, compared to other plant-based protein.1 Research on the quality of soy protein shows that it resembles egg protein.2 Hoffman and Falvo (2004) claimed that soy protein was equivalent to animal protein on the PDCAAS scale with highest attainable value (1.0 score).3 Thereby, soybean meals are a rich source of nutrition and a viable alternative to animal products.4 Recent advances in food technology have innovated on the use of soybean to produce functional foods with health benefits. One of which is germination to reduce phytic acid content but also to increase protein, γ-aminobutyric acid (GABA), and antioxidants such as polyphenols, flavonoids, carotenoids, and vitamins.5,6 Germination consists of vigorous metabolic activities that encompass respiration, cellular structural changes, molecular synthesis and hydrolysis, and protein, lipid, and carbohydrate transformation.7 Germination is recognized as a straightforward, low-cost approach of boosting the nutritional value and efficiency of soybean usage.8 Therefore, analysing the bioactive compounds in the germinated soybean is critical for assessing its nutritional value.
GABA is present in large quantities in most organisms and acts as an inhibitory neurotransmitter in the mammalian central nervous structure.9 GABA is generated from decarboxylation of L-glutamic acid by enzyme glutamate decarboxylase (GAD).6 Glutamic acid is produced mainly by protein hydrolysis and its content has been shown to increase during germination. In addition, the synthesis of GABA during germination also depends on the activity of the GAD enzyme which is strongly dependent on the germination temperature. In both, the solid and liquid stages, GABA can exist in various structural configurations. Thus, it has numerous key biological activities, including anti-psychotic effect, anti‐cardiovascular disease control, blood pressure regulation,10 anti-diabetic,11 stress and anxiety reduction, pain prevention, and cancer cell suppression.12,13,6,14 Due to these appealing properties, many people are interested in supplying this amino acid to the body through GABA-rich diet.
Isoflavones are the important bioactive compounds in the germinated soybean as they are essential for human health.15 They belong to the group of polyphenols, a sub-class of the flavonoid group.16 Isoflavones have a fundamental structure that consists of two benzene rings (A and B) joined by a three-carbon bridge to form a pyran (C) heterocycle, with the benzene B ring connected at the third position of the heterocycle. The C-ring is like other flavonoids. Isoflavones exist in 12 different forms in soybean and soybean products, which are grouped into four major groups: aglycones, glycosides, and two ester forms of glycosides i.e., malonyl and acetyl glycosides. Among them, only isoflavone aglycones are proven to be biologically active against many human ailments such as cancer, obesity, cardiovascular disease, diabetic complications, Alzheimer’s disease, and menopausal symptoms.17,18,19 The isoflavone aglycones content rises after germination,20 this is due to the intracellular enzyme β-glucosidase being active during germination and converting isoflavone glycosides plentiful in soybean into aglycones.21
As people’s quality of life nowadays improves, there is a high demand to produce GABA and isoflavones-rich foods to promote human health. As a result, quantifying these compounds become an essential part to facilitate their applications in food industry. So far, several methods have been applied to determine GABA and isoflavones, for example automated amino acid analysis, spectrophotometric (UV-VIS), liquid chromatography tandem mass spectrometry (LC/MS),22,23,24 electrochemical detection,25 capillary electrophoresis-MS (CE-MS),26 and high-performance LC (HPLC).27,28,29,30,31 Among them, HPLC is considered as a standard analytical method because it offers the advantage of simplicity, sensitivity, reproducibility, and economics. Nevertheless, GABA is a small aliphatic amino acid that does not possess fluorescent and strong ultraviolet absorbance property, it cannot be directly detected with a HPLC system coupled with UV–VIS or fluorescence detector. 32 Therefore, several derivatizing agents such as 2-hydroxynaphthaldehyde (HN), 28,33,34 o-phthalaldehyde (OPA), 28,31,35, 4-dimethylaminoazobenzene-4’-sulphonyl, 36 and phenylthiocarbamyl 37 were used to create GABA derivatives to extend the retention time of GABA on HPLC columns, resulting in better GABA detection. However, depending on derivatizing compounds and mechanisms to form GABA derivatives, the sensitivity of GABA detection might be varied, leading to deviation in its linear dynamic range. Furthermore, methods describing the sample extraction and HPLC quantification for these compounds on legumes in general and germinated soybean in particular are inadequate. In addition, the HPLC conditions are sample matrix dependent. For these reasons, the current study aimed to optimize the methods for quantification of GABA and isoflavone aglycones in germinated soybean. The optimal methods were then applied to quantify these compounds in two popular germinated soybean cultivars grown in Vietnam for selection of the suitable material to produce functional foods.
Materials and Methods
Optimization of HPLC conditions for determination of GABA and isoflavone aglycones content
Preparation for soybean sample
The extraction optimization and high-performance liquid chromatography with ultraviolet-visible detector (HPLC-UV-VIS) conditions for quantification of GABA, daidzein, genistein, and glycitein was performed using germinated cultivar ‘DT84’. This cultivar was soaked for 1 h with water-to-bean ratio of 1:5 at 26 – 28 ºC to initiate germination. After being soaked, the seeds were taken out of the water and germinated at the same temperature for 30 h. Spraying water was changed every 6 h to remove the toxic compounds generated from seed respiration activities. After germination, the soybeans were dried at 60 ºC for 17 h, then ground into fine powder using a high-speed multi-function grinder (Retsch, Germany). The powder was stored at -80 ºC until analysis.
Reagents and instrument
Daidzein, glycitein, and genistein, GABA standards, HN reagent, GABA, HPLC solvents (MeOH, formic acid, acetonitrile, and water) were purchased from Sigma-Aldrich (U.S.A). The remaining chemicals were of analytical grade.
Chromatographic analysis was performed on an Agilent 1260 HPLC system (Agilent Technology infinity LC, U.S.A) equipped with an auto sampler, an online degasser, a quaternary pump, an ultraviolet-visible (UV-VIS) detector. The chromatographic column used was an XDB-C18 column (4.6×150mm×5μm). Chemstation software system was used to control the equipment.
Calibration curve, limit of detection, and limit of quantification
Preparation of GABA standard solutions
A GABA stock standard solution (5 mg/ml) was created by dissolving the GABA standard in 10 ml aqueous 70% MeOH and kept in the dark at 4 ºC until analysis. Six working solutions of 3.125 mg/ml, 6.25 mg/ml, 12.5 mg/ml, 25.0 mg/ml, 50.0 mg/ml and 100.0 mg/ml were prepared through dilution with MeOH 70%. Then, each working solution above was mixed with HN in absolute MeOH, followed by addition of borax buffer (pH 8.0) in a 2ml Eppendorf tube in a ratio of 1:1:1 (v/v). Thus, the concentration of GABA was reduced threefold, corresponding to GABA concentrations 1.04 mg/ml, 2.08 mg/ml, 4.16 mg/ml, 8.33 mg/ml and 16.67 mg/ml. The mixed solution was heated in a thermostatic water bath for 10 min at 80 ºC and allowed to cool down to ambient temperature before being centrifuged for 10 min at 4 ºC, 12000 rpm. After that, the supernatant was collected and used to quantify GABA on the HPLC-UV-VIS system.
Preparation of isoflavone standard solutions
Each isoflavone standard (daidzein, genistein, and glycitein) was dissolved individually in a mixture of MeOH:DMSO (70:30 v/v) to give a solution concentration of 2000 mg/ml, and stored at -20 ºC. The combined stock solutions containing daidzein, genistein, and glycitein were prepared to acquire a concentration of 300 mg/ml for each compound. A series of standard working solutions with concentrations of 0.5, 1.0, 2.0, 4.0, 8.0, 16.0, 32.0, and 50.0 g/ml for daidzein, genistein, and glycitein were then prepared by diluting this mixed solution with aqueous MeOH 70%.
The dilution series of the GABA and isoflavone standard solutions were then used for the calibration curves. The limit of detection (LOD) and the limit of quantification (LOQ) for each compound were calculated based on their corresponding standard curve.
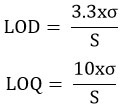
Where S is the slope of a calibration curve and s is the standard deviation of the response factor.
To evaluate the precision of the HPLC-UV-VIS methods, GABA and standard isoflavones samples (with concentration of 2.0 µg/ml) were injected 5 times into the HPLC system. It is expressed as RSD (Relative Standard Deviation).
where,x : the spectral area of the analysis’ mean value.
n: number of repetitions.
xi: measured spectral area value of each analysis.
SD: standard deviation.
Optimization conditions for separation of GABA and isoflavone aglycones in HPLC
Isoflavone aglycones and GABA separation on HPLC was performed by extracting these components from a real sample matrix, namely the germinated soybean ‘DT84’ as described above. A 15 ml falcon tube containing 10 ml of 70% HPLC grade MeOH was used for extraction, along with 0.5 g of soybean powder. The extraction was then carried out at 50 ºC for 1 h. During extraction, the tubes were shaken every 15 min to accelerate mass diffusion. Then, the tubes were ultrasonically vibrated for 30 min at 30 ºC. After extraction, the combined solution was centrifuged for 20 min at 12,000 rpm. Next, the supernatant was obtained for HPLC analysis by filtration through a 0.22 μm syringe membrane. GABA and isoflavone aglycones in the extracts were identified by comparing their retention time with that of the genuine standards. Quantification of the detected compounds was made using the corresponding calibration curves.
Separation optimization of GABA-HN derivatization
This optimization included three factors, namely 1) HN concentration for GABA derivatization, 2) HPLC flow rate and 3) composition of the mobile phase. First, the HN concentration for GABA-HN derivatization was optimized. The derivatives were prepared by adding the sample extract with borax buffer at pH 8 and HN solution at 0.1%, 0.2%, 0.3%, 0.4%, and 0.5% in absolute MeOH with the volume ratio of 1:1:1. Afterwards, the mixtures were heated for 10 min at 80°C. The solutions were then allowed to cool down to room temperature (25oC) before being centrifuged for 10 min at 4 ºC, 12,000 rpm. Finally, the supernatants were collected and injected to the HPLC column for GABA separation.
Second, the optimal HPLC flow rate was determined. Two flow rates were examined: 0.8 ml/min and 1.0 ml/min. The fixed factors were the mobile phase containing A (water) and B (0.1% formic acid (FA) in acetonitrile (ACN); stationary phase being the XDB-C18 column (4,6×150mm×5μm); the injection volume of sample of 20 μL; the column temperature set at 30 ºC, the UV-VIS detector with detection wavelength of 254 nm.
Third, to determine the optimal composition of the mobile phase through gradient elution, different elution gradients (GE1, GE2, GE3) were examined as presented in Table 1.
Table 1: Scheme of the elution gradient procedures for GABA analysis. Percentage of solvent B
| Elution gradient solvent B | Time (min) | ||||||||
| 0 | 2 | 5 | 6 | 8 | 8.5 | 9 | 10 | 12 | |
| GE1 | 50 | 60 | 70 | 80 | 90 | 50 | |||
| GE2 | 50 | 60 | 70 | 90 | 90 | 50 | 50 | ||
| GE3 | 40 | 50 | 60 | 90 | 90 | 40 | 40 | ||
Separation optimization of isoflavone aglycones
To optimize a method for quantifying daidzein, genistein, and glycitein by HPLC, two factors were examined: flow rate and elution gradient. To start with, the flow rate was investigated with two levels: 0.8 ml/min and 1.0 ml/min. The chromatographic conditions were the mobile phase containing A (water) and B (0.1% formic acid (FA) in acetonitrile (ACN); the stationary phase being the XDB-C18 column (4,6×150mm×5μm); the injection volume of sample of 16 μl; the column temperature set at 40 ºC, the UV-VIS detector with detection wavelength of 254 nm.
Next, to determine the optimal composition of the mobile phase through gradient elution, different gradient elution procedures (GE4, GE5, GE6) were investigated as indicated in Table 2.
Table 2: Scheme of the elution gradient procedures for isoflavone aglycones analysis. Percentage of solvent B.
| Elution Gradient solvent B | Time (min) | ||||||||||
| 0 | 10 | 11 | 15 | 16 | 18 | 19 | 20 | 21 | 35 | 40 | |
| GE4 | 10 | 45 | 90 | 90 | 10 | 10 | |||||
| GE5 | 20 | 36 | 95 | 95 | 20 | 20 | |||||
| GE6 | 23 | 36 | 95 | 95 | 23 | 23 | |||||
Extraction condition of GABA and isoflavones from the germinated soybean samples
The most crucial factors, solid-to-solvent ratio and extraction time were explored to improve the extraction conditions for the chemicals under investigation. For the effect of solid-to-solvent ratio, three sample sets of germinated ‘DT84’ powder were prepared corresponding to three soybean : solvent ratios (1:10, 1:20, and 1:30). To examine the impact of extraction time, the soybean powder was added to MeOH 70% with the optimal ratio found above. The mixture was then extracted at different duration of 1 h, 19 h, and 25 h. After extraction, the combined solution was centrifuged for 20 min. The supernatant was obtained by filtration through the 0.22 μm membrane and then subjected to the HPLC analysis.
Quantification of GABA and isoflavone aglycone in germinated soybean
Optimization of soybean germination aimed to increase GABA and isoflavone aglycones content. Soybean cultivars ‘DT84’ and ‘DT51’ were grown in the winter season in 2020 and supplied by Legumes Research and Development Centre in Vietnam. These cultivars were soaked for 1 h, 2 h, 3 h, 4 h, and 5 h with water-to-bean ratio of 1:5 at 26 – 28 ºC to initiate germination. After being soaked, the seeds were germinated, dried, and ground into powder for quantification of GABA and isoflavone aglycones as described in section 2.1.
Data analysis
The GABA and isoflavones content were reported as mg/g of germinated soybean on a dry weight (DW). The data were expressed as mean ±SD (standard deviation) from three replicate measurements. To examine the significant of the means, one-way ANOVA was conducted. The differences between mean levels were evaluated by Tukey’s multiple comparison tests. Statistical analyses were performed using the JMP software version 10 (SAS Institute, Inc., Cary, NC, USA).
Results and Discussion
Protocol optimization for quantification of GABA and isoflavone aglycones in germinated soybean
Linear dynamic range, sensitivity, and repeatability for quantification of GABA and isoflavone aglycones by HPLC-UV-VIS
 |
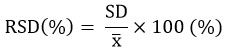
Figure 1. The calibration curves for A) GABA, B) Daidzein, C) Genistein, and D) Glycitein. Each point represents the mean ± SD (n = 3) |
Figure 1A-D shows the calibration plots for GABA, daidzein, genistein, and glycitein detection which were constructed using a series of concentrations for each compound as indicated in section 2.2.1. All the curves showed an excellent linear correlation between the absorbance signals (mAU.min) and the analyse concentrations with the correlation coefficient 0.999 for all the investigated compounds, which is desirable for the quantification. The regression equation, R2, LOD, LOQ, and repeatability for quantification of GABA, daidzein, genistein, and glycitein are given in Table 3.
Table 3: Regression analyses of the linearity data of GABA and isoflavone aglycones
| Compounds | Regression equation | Correlation coefficients (R2) | LOD (µg/ml) | LOQ (µg/ml) | RSD (%) |
| GABA | y = 365.37 x + 80.23 | 0.9999 | 0.06 | 0.17 | 3.30 |
| Daidzein | y = 93.67 x + 4.75 | 0.9999 | 0.04 | 0.15 | 4.16 |
| Genistein | y = 97.21 x + 47.84 | 0.9998 | 0.84 | 2.57 | 2.12 |
| Glycitein | y = 71.05 x + 12.47 | 0.9995 | 0.59 | 1.79 | 1.50 |
The results demonstrated that GABA had LOD of 0.06 µg/ml and LOQ of 0.17 µg/ml. Among isoflavone aglycones, daidzein had the lowest LOD and LOQ which were 0.04 µg/ml and 0.15 µg/ml respectively, followed by glycitein which was detectable at 0.59 mg/ml and quantifiable at 1.79 µg/ml. Finally, genistein had the highest LOD of 0.84 µg/ml and a LOQ of 2.57 µg/ml. Their sensitivity values were 365.37 mAU.min.ml/µg for GABA, 93.67 mAU.min.ml/µg for daidzein, 97.21 mAU.min.ml/µg for genistein, and 71.05 mAU.min.ml/µg for glycitein as calculated from the slope of the calibration curve. The linear dynamic range is as low as 1.05 µg/ml to at least 33.6 µg/ml for GABA; and 0.5 µg/ml to at least 50 µg/ml for daidzein, genistein, and glycitein. Comparing with the data published by Panrod et al. (2016) in which the linear range, LOD, and LOQ detection for GABA were from 40 – 600 μg/ml, 1 μg/ml and 5 μg/ml respectively, 28 the obtained data in the current study are much lower, indicating the high sensitivity of our methods. The data variations might be due to the differences in the HPLC system, column, and detector used by the research groups.
Regarding the repeatability, the relative standard deviations (RSD) for all analyses varied from 1.5% to 4.16% (n = 5), of which glycitein had the lowest value of 1.50%, followed by genistein (2.12%), GABA (3.30%), and daidzein having the highest value of 4.16%. All these values meet the requirement of AOAC standards (2016) for which RSD ≤ 8% for the analyte concentration <10 µg/ml. This confirms the optimized methods show remarkable reproducible and high precision, resulting in reliable quantification data. Furthermore, the method proved the stability of GABA derivative under the optimized condition.
Optimal conditions for separation of GABA and isoflavone aglycones in HPLC analysis
In the previous section, the calibration curves were constructed and validated in the standard solutions. When they are applied to quantify GABA and isoflavone aglycones in the germinated soybean samples, separation of these compounds in HPLC might be disturbing for example retention time shift, baseline noise, and poor peak resolution due to complexity of the real sample matrix. Hence, their separation conditions need to be optimized to gain accurate quantification.
Separation optimization of GABA-HN derivative
Effect of HN concentration on separation of GABA-HN
GABA is an amino acid that is insensitive to the UV-VIS detector. Consequently, to improve its responsiveness to the UV-VIS detector, it must be derivatized with 2-hydroxyl 1-naphtaldehyde (HN) to generate GABA-HN derivative. Amount of HN should theoretically be 1.5-2 times higher than that of GABA in the reaction. If there is too much excess of HN, it will impair the detector and the column separation process. Therefore, one of the most crucial aspects of the derivatization reaction is determining the HN concentration. As shown in Figure 2, the concentration of HN had a great influence on the separation of GABA. When using HN 0.1% for derivatizing, the narrow and symmetric peaks were obtained for GABA-HN derivative with the retention time of 3.129 min and for excess HN at 8.335 min. This means 0.1% HN content was sufficient for the derivatization reaction with GABA (Figure 2A). When the concentration of HN was increased to 0.2% – 0.5%, HN reacted not only with GABA but also with other amino acids in the sample matrix. Thus, the peaks were overlapped, poor resolution, tailing, and asymmetric, leading to inaccurate quantification of GABA-HN (Figure 2B-E). Moreover, excess of HN might negatively affect the detector and be difficult to wash off the column, causing a long column equilibrating time. Thus, the HN concentration of 0.1% was chosen for GABA-HN derivatization reaction.
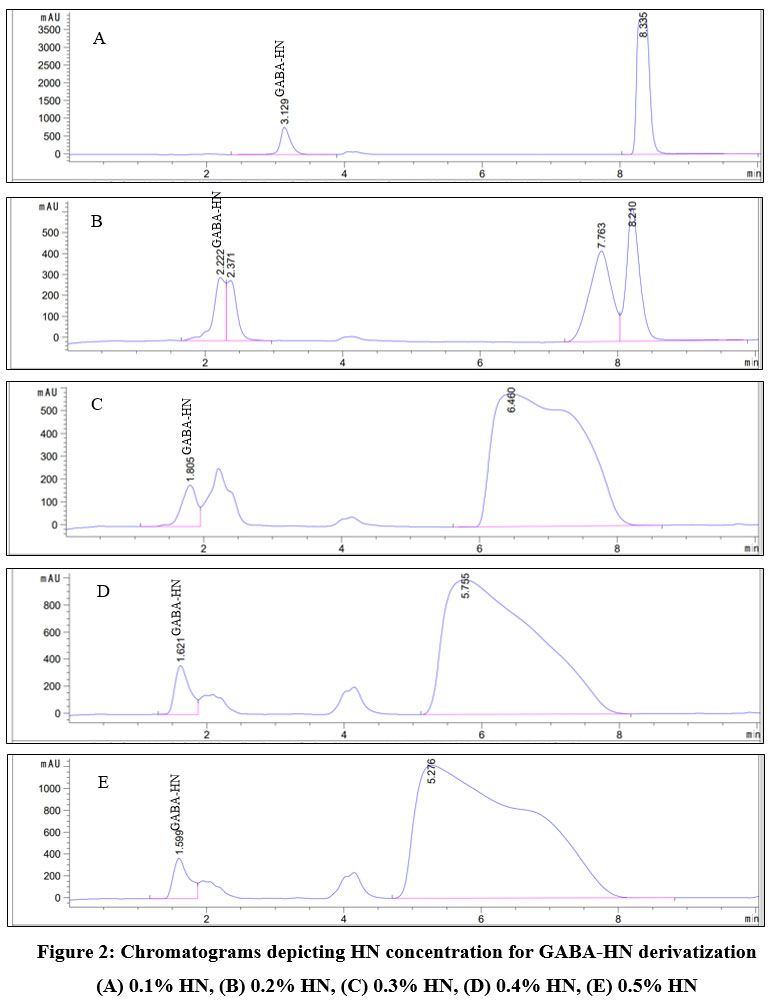 |
Figure 2: Chromatograms depicting HN concentration for GABA-HN derivatization (A) 0.1% HN, (B) 0.2% HN, (C) 0.3% HN, (D) 0.4% HN, (E) 0.5% HN |
Effect of flow rate on separation of GABA-HN
Flow rate of the mobile phase is an important factor influencing GABA analysis. As indicated in Figure 3A, when the flow of 0.8 ml/min was applied, the peaks of GABA-HN with 0.1% HN for derivatization and excess HN appeared at 3.080 min and 8.307 min respectively. The proper resolution of these peaks and the symmetry were achieved. Further increase of flow to 1 ml/min significantly speeded up the retention time for both compounds. GABA-HN was released at 2.176 min, whereas excess HN was detected at 6.318 min. Although the signal of GABA-HN is symmetric, their tail was closed to another compound having retention time of 2.551 min, resulting in poor peak resolution and possibly inaccurate peak integration. Furthermore, the peak width in half height of excess HN was much bigger than that observed when the flow was at 0.8 ml/min (Figure 3B). Hence, the flow rate of 0.8 ml/min was chosen for improving the chromatographic separation and analysis accuracy.
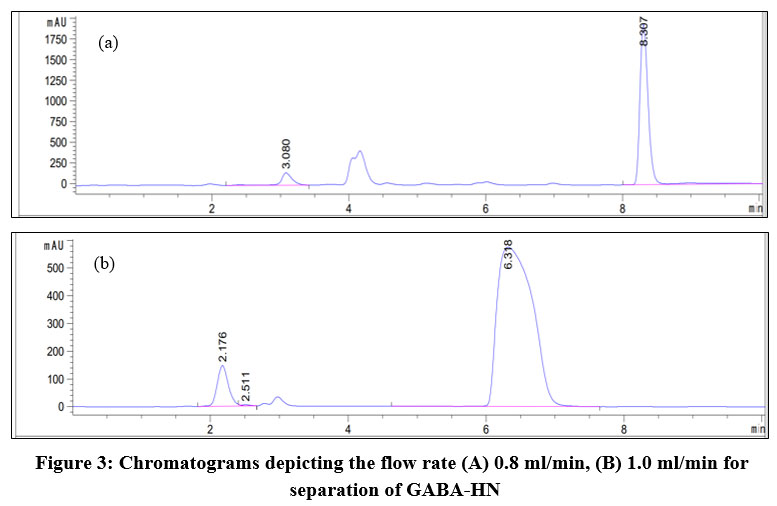 |
Figure 3: Chromatograms depicting the flow rate (A) 0.8 ml/min, (B) 1.0 ml/min for separation of GABA-HN |
Effect of mobile phase composition through gradient elution on GABA-HN separation
Data in Figure 4 illustrate the mobile phase composition by utilizing gradient elution had great impact on elution of solutes. When the gradient elution procedure GE1 and GE2 were employed, the retention time of the analyses were shorter than that of GE3. Specifically, in GE1 GABA-HN was eluted from the column at 2.217 min, followed by HN at 6.414 min. In GE2, they were eluted at 2.183 and 6.359 min, respectively. Even though the signals in these mobile phase systems are in good shape, there are possibility that the peak of GABA-HN are overlapped with other compounds that were eluted later. Therefore, GE1 and GE2 were not optimal to separate GABA-HN in chromatographic analysis.
With the third gradient elution procedure GE3, the retention time was much longer for GABA-HN (3.127 min) and the excess HN (8.345 min). Other compounds were also obviously separated. Therefore, the gradient elution procedure GE3 was preferred for the subsequent experiments.
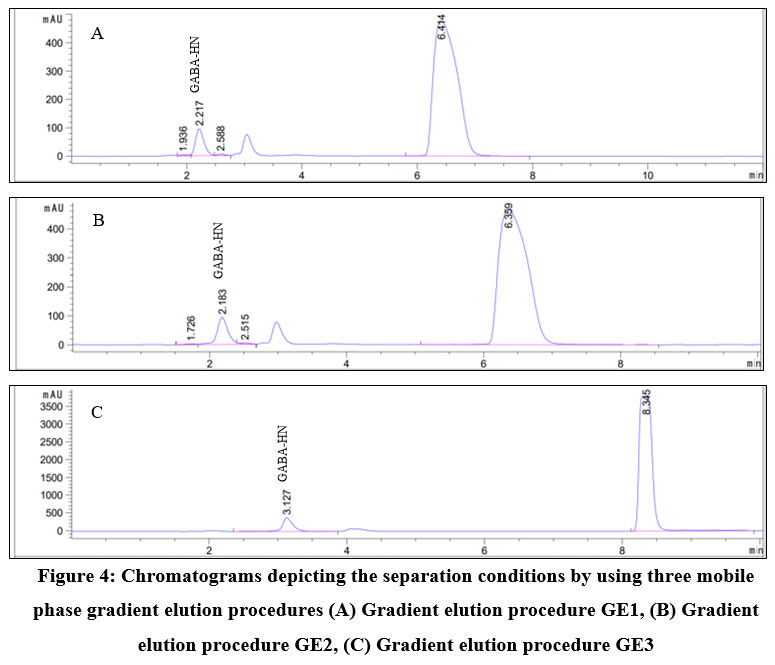 |
Figure 4: Chromatograms depicting the separation conditions by using three mobile phase gradient elution procedures. |
Separation optimization of isoflavones
Effect of flow rate on separation of isoflavone aglycones
To determine the optimal flow rate for separation of daidzein, genistein, and glycitein, different conditions were tested. Figure 5 indicates the signals of three isoflavones were well detected when both flow rate of 0.8 ml/min and 1.0 ml/min were applied. However, the peak resolution of daidzein and glycitein at 1.0 ml/min was better than that at 0.8 ml/min. Based on the peaks of isoflavone standards, their retention time at 0.8 min/ml were identified at 7.325 min for daidzein, 7.907 min for glycitein, and 10.784 min for genistein (Figure 5A). When applying the flow of 1.0 ml/min, their corresponding retention times were shorter with 6.475 min, 7.079 min, and 10.048 min for daidzein, glycitein, and genistein, respectively (Figure 5B). Hence, for the isoflavone analysis, the flow rate of 1.0 ml/min was preferred to preserve solvent, shorten elution time, and still achieve high resolution.
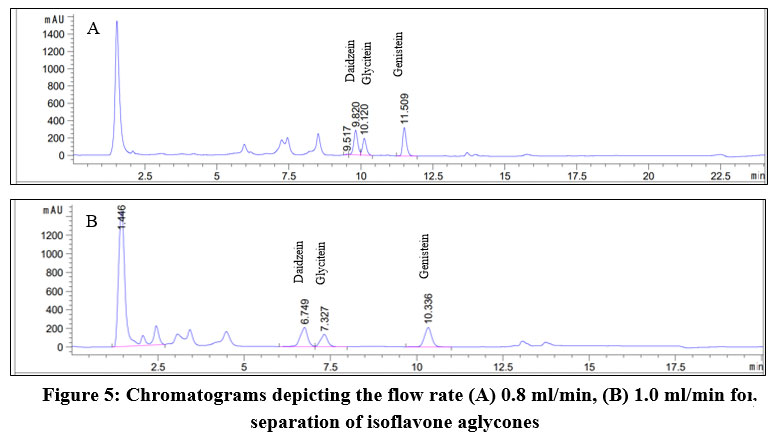 |
Figure 5: Chromatograms depicting the flow rate (A) 0.8 ml/min, (B) 1.0 ml/min for separation of isoflavone aglycones |
Effect of mobile phase composition through gradient elution on isoflavone aglycones separation
Data in Figure 6 reveal that the gradient elution procedure GE6 provided the best separation efficiency with narrow and symmetric peaks obtained for daidzein, glycitein, and genistein. Based on the standard signals, the retention time were found to be 6.620 min for daidzein, 7.215 min for glycitein, and 10.250 min for genistein. In contrast, chromatograms generated from the gradient elution procedures GE4 and GE5 provided the signals which are poorly separated and resolved, especially for daidzein and glycitein. As a result, the mobile phase gradient elution procedure GE6 was chosen for further investigation.
 |
Figure 6: Chromatograms depicting the separation conditions by using three mobile phase gradient elution procedures. |
Extraction optimization for quantifying GABA and isoflavone aglycones
Table 4 demonstrates the impact of the ratio of solid-to-solvent ratio on isoflavone aglycones and GABA extraction from the germinated soybean. It can be seen that the most noticeable alteration was a shift in the ratio of solid-to-solvent from 1:10 to 1:20, which resulted in a significant rise of the GABA, daidzein, and genistein concentrations (from 183.15 µg/g DW to 223.20 µg/g DW for GABA; from 41.38 µg/g DW to 52.33 µg/g DW for daidzein; and from 39.68 µg/g DW to 52.34 µg/g DW for genistein respectively). However, when the ratio of solid-to-solvent continued to raise from 1:20 to 1:30, their concentration did not change notably (P>0.05). This could be explained by the fact that at high solid-liquid ratio, the solvent easily gains access to cells and dissolve the solutes. Furthermore, it creates stronger diffusion dynamics to accelerate mass transfer and extraction rate but at certain solid-liquid ratio (1:30) the extracted concentration will reach plateau. Therefore, to save solvent for both ecological and economical reasons, the ratio of 1:20 was chosen for sample extraction. It should be noted that out of three isoflavone aglycones, the glycitein concentration was too low in the actual germinated soybean. Therefore, only the daidzein and genistein concentration were reported (Table 4).
For the extraction time, it had a great effect on GABA and isoflavone aglycones in the first hour. Initially, their concentration increased with the increase of extraction time and reached maximum at 242 μg/g DW for GABA, 50.52 μg/g DW for daidzein, and 52.53 μg/g DW for genistein respectively after 1 h of extraction. After that even the duration was prolonged until 19h and 25 h, there was no significant difference in their concentration compared to those obtained after 1 h at 95% confidence level (Table 4). These results suggest that 1 h is optimal extraction as it is enough for the system reaches saturation. Even the extraction time was extended for a longer period, concentration of the investigated compounds remained unchanged. The extraction time in this study is much shorter compared to that reported by Phommalth et al. (2008) in which their extraction time was found to be 15 h.38 To conclude, the extraction time of 1 h was optimal for further study to save analytical resources.
Table 4: Effect of extraction condition on the GABA, daidzein, and genistein contents in germinated soybean
| Extraction conditions | GABA content(μg/g DW) | Daidzein (μg/g DW) | Genestein (μg/g DW) | |
| Solid-to-solvent ratio (g/ml) | 1:10 | 183.15 ± 3.82b | 41.38 ± 1.25b | 39.68 ± 1.16b |
| 1:20 | 223.20 ± 10.89a | 52.33 ± 1.09a | 53.34 ± 0.95 a | |
| 1:30 | 217.06 ± 6.01a | 51.60 ± 0.34a | 52.54 ± 0.67 a | |
| Extraction time (h) | 1 | 242.46 ± 2.23a | 50.52 ± 0.37a | 52.53 ± 1.39a |
| 19 | 230.27 ± 3.39a | 50.22 ± 1.93a | 50.97 ± 0.40b | |
| 25 | 239.05 ± 11.63a | 50.71 ± 0.53a | 52.00 ± 0,64a | |
Results with the same letter were not statistically different at a significant level α = 0.05. Data represents the mean ± SD (n = 3)
Application of the optimal protocols for quantifying GABA and isoflavone aglycones in some germinated soybean cultivars grown in Vietnam
Soaking is considered as one of the principal steps in germination process of soybean. During soaking, the dry bean will absorb water, leading to texture changes, increase of soluble proteins, reduction of nutritional inhibitors and toxic substances, especially activation of GAD enzyme and β-glucosidase which are responsible for conversion of glutamic acid and β-glucoside isoflavones into GABA and isoflavone aglycones.39,40 To identify the suitable soaking time for accumulation of these bio-active compounds, two soybean cultivars ‘DT51’ and ‘DT84’ commonly grown in Vietnam were soaked for different periods of time (0 – 5 h), then germinated under the condition described in section 2.1.1. After that, GABA, daidzein, and genistein contents were determined using methods optimized in the previous section. The results are presented in Table 5.
Table 5: Quantification of GABA, daidzein, and genistein content in germinated soybean cultivars at different soaking time
| Soaking time (h) | GABA concentration (µg/g DW) | Daidzein concentration (µg/g DW) | Genistein concentration (µg/g DW) | |||
| DT51 | DT84 | DT51 | DT84 | DT51 | DT84 | |
| 0 | 260.37±6.90b | 150.91±10.31c | 18.33±0.19b | 53.11±3.24c | 13.30±1.39a | 36.71±8.41b |
| 1 | 370.88±2.59a | 242.90±8.25a | 25.87±0.37a | 70.63±2.57a | 17.04±1.99a | 50.35±2.28a |
| 2 | 195.94±2.45d | 100.19±0.78e | 19.14±1.43b | 65.05±0.74ab | 10.00±3.38a | 24.91±1.76c |
| 3 | 222.75±5.80c | 130.74±0.57d | 18.97±0.20b | 58.10±1.40bc | 12.33±3.52a | 24.47±1.72c |
| 4 | 220.31±4.39c | 209.65±2.68b | 20.30±0.28b | 51.21±4.74c | 15.71±9.67a | 38.49±2.53b |
| 5 | 252.80±7.95b | 152.09±2.30c | 13.11±2.91c | 36.48±3.61d | 14.12±5.23a | 25.55±2.08c |
Results with the same letter were not statistically different at a significant level α = 0.05. Data represents the mean ± SD (n = 3)
Results in Table 5 reveal that soaking time had a significant influenced on GABA concentration of germinated soybean ‘DT51’ and ‘DT84’. Both cultivars reached the peak of GABA content of 370.88 µg/g DW for ‘DT51’ and 242.90 µg/g DW for ‘DT84’ after 1 h of soaking. When soaking was prolonged from 1 h to 5 h, the GABA content for both cultivars tends to decline. This can be explained by the fact that soaking helps soybean absorb water which stimulate hydrolysis reactions. Additionally, GAD enzyme present in plant cells is activated, resulting in GABA biosynthesis in soybean. However, if the beans are soaked for an extended period, they will absorb too much water, thus the metabolic activity will be inhibited and prevents subsequent germination due to the drop of oxygen present in the water. This leads to the reduction of GABA content.40 The best soaking time found in the current study was much shorter compared to that published by Guo et al. (2011) where his team discovered that the most efficient temperature/time protocol was soaking for 4 h at 30 °C to have sufficient moisture in the soybean, leading to successful germination and accumulation of GABA.40 Furthermore, GABA content determined in the germinated soybean ‘DT51’ being soaked for 1 h and germinated for 30 h at 26 – 28 oC (370.88 µg/g DW) was in the same range with that in the soybean being soaked by lactic acid bacteria fermented whey solution.41 However, it was 3.7 times and 1.3 times higher than that in the best cultivar ZH13 screened by Wang et al. (2015) after 1 day (100 µg/g DW) and 5 days (260 µg/g DW) of germination respectively (Luo et al., 2018).30,42 At similar germination time and temperature, GABA content in the germinated soybean ‘Jindou 25’ (0.36 µmol/g DW) was 10 times lower than that in the germinated soybean ‘DT51’.43 The difference in GABA content in the soybean cultivars could be due to the genetic properties and various external factors such as growing season, climate, storage environment, and germination condition.44,45,46
Changes in the isoflavone content followed the same trend as in GABA. Soaking for 1 h gave the highest concentration of daidzein (25.87 µg/g DW for ‘DT51’ and 70.63 µg/g DW for ‘DT84’) and genistein (17.04 µg/g DW for ‘DT51’ and 50.35 µg/g DW for ‘DT84’). Then, if the soaking time continued to rise, the isoflavone content in the germinated soybeans diminished. After 5 h of soaking daidzein remained only 13.11 µg/g DW for ‘DT51’ and 36.48 µg/g DW for ‘DT84’, about two times less than that after 1 h soaking. Similarly, genistein also decreased and reached 14.12 µg/g DW for ‘DT51’ and 25.55 µg/g DW for ‘DT84’ after 5 h soaking. Concentrations of isoflavone aglycones found in the germinated soybean ‘DT84’ was like those in the national certified Zhonghuang soybean cultivars ZH13, ZH30, and ZH42 grown in China.42
Not only the concentration of bioactive compounds was reduced but also the sensory quality of the germinated soybean was unacceptable when soaking was longer than 2 h. We observed that the bean became viscous and had sour smell. When it was used to produce germinated soy milk, the beverage had off-flavour and odour. Furthermore, coagulation of the soymilk occurred. This might be due to the microbial growth and physiological and biochemical activities of the bean when being soaked for a long period. Further study shall be focused on to identify the underlying causes. Based on these findings, soaking of 1 h is the most appropriate time before germinating the soybean.
When the comparison of the targeted compounds in two soybean cultivars was made for the same soaking duration, it is observed that the GABA content in germinated soybean ‘DT51’ was found to be 1.5 times higher than that in germinated soybean ‘DT84’. In contrast, the former had 3 times lower in daidzein and genistein content than the latter. These results suggest that soaking the soybean for 1 h and then germinating for 30 h at 26 – 28 oC generated the best bioactive compounds in germinated soybean. Thus, if one is interested in producing isoflavone-rich foods, ‘DT84’ should be selected while if GABA-rich foods are preferred then ‘DT51’ is the most suitable material.
Conclusion
The present work successfully optimized the methods for determination of GABA and isoflavone aglycones in the germinated soybeans using HPLC-UV-VIS. The calibration curves were constructed and validated for quantifying the targeted compounds with high sensitivity, high precision, and low LOD. The optimized methods were then utilized to quantify GABA, genistein, and daidzein in two common germinated soybean cultivars grown in Vietnam. The results showed that the highest concentration of GABA, daidzein and genistein are reached after 1 h of bean soaking. Further, germinated ‘DT51’ had higher GABA and lower genistein and daidzein content than germinated ‘DT84’. To conclude, the optimized methods explicitly described in this study can be used to determine the GABA and isoflavone aglycones in soybean and could be using in other food matrices. The results suggest the suitability of soybean cultivar for development of GABA- or isoflavone-rich foods.
Acknowledgement
The authors thank the staff and students at Faculty of Food Science and Technology, Vietnam National University of Agriculture for their kind assistance.
Conflict of Interest
All authors declare no conflict of interest.
Funding Sources
This work was funded by the Flemish Inter University Council (VLIR-UOS, Project No. VN2020SIN314A103).
References
- Qin P., Wang T., Luo Y. A review on plant-based proteins from soybean: Health benefits and soy product development. Journal of Agriculture and Food Research. 2022; 7(12):100265. DOI: 10.1016/j.jafr.2021.100265.
CrossRef - Rizzo G., Baroni L. Soy, soy foods and their role in vegetarian diets. Nutrients. 2018; 10(1): 43. DOI: 10.3390/nu10010043.
CrossRef - Hoffman J. R., Falvo M. J. Protein – which is best? J Sport Sci Med. 2004; 3(3):118-130.
- Wardlaw G. M., Kessel M. W. Perspectives in Nutrition. 5th New York: McGraw Hill; 2001.
- Plaza L., de Ancos B., Cano P. M. Nutritional and health-related compounds in sprouts and seeds of soybean (Glycine max), Wheat (Triticum aestivum. L) and alfalfa (Medicago sativa) treated by a new drying method. Eur Food Res Technol. 2003; 216(2):138-144. DOI: 10.1007/s00217-002-0640-9.
CrossRef - Diana M., Quílez J., Rafecas M. Gamma-aminobutyric acid as a bioactive compound in foods: a review. J Funct Foods. 2014; 10:407-420. DOI: 10.1016/j.jff.2014.07.004.
CrossRef - Zieliński H. Contribution of low molecular weight antioxidants to the antioxidant screen of germinated soybean seeds. Plant Food Hum Nutr. 2003; 58:1-20. DOI: 10.1002/food.200390069.
CrossRef - Jiang S., Cai W., Xu, B. Food Quality Improvement of Soy Milk Made from Short-Time Germinated Soybeans. Foods. 2013; 2(2):198-212. DOI: 10.3390/foods2020198.
CrossRef - François A., Low S. A., Sypek E. I., Christensen A. J., Sotoudeh C., Beier K. T., Ramakrishnan C., Ritola K. D., Sharif-Naeini R., Deisseroth K., Delp S. L., Malenka R. C., Luo L., Hantman A. W., Scherrer G. A Brainstem-spinal cord inhibitory circuit for mechanical pain modulation by GABA and Enkephalins. Neuron. 2017; 93(4):822-839. DOI: 10.1016/j.neuron.2017.01.008.
CrossRef - Shizuka F., Kido Y., Nakazawa T., Kitajima H., Aizawa C., Kayamura H., Ichijo N. Antihypertensive effect of γ‐amino butyric acid enriched soy products in spontaneously hypertensive rats. Biofactors. 2004; 22(1-4):165-167. DOI: 10.1002/biof.5520220133.
CrossRef - Chen L., Zhao H., Zhang C., Lu Y., Zhu X., Lu Z. γ‐Aminobutyric acid‐rich yogurt fermented by Streptococcus salivarius thermophiles fmb5 apprars to have anti‐diabetic effect on streptozotocin‐induced diabetic mice. J Funct Foods. 2016; 20:267-275. DOI: 10.1016/j.jff.2015.10.030.
CrossRef - Abdou A. M, Higashiguchi S., Horie K., Kim M., Hatta H., Yokogoshi H. Relaxation and immunity enhancement effects of gamma-aminobutyric acid (GABA) administration in humans. Biofactors. 2006; 26(3):201-208. DOI: 10.1002/biof.5520260305.
CrossRef - Li H., Cao Y. Lactic acid bacterial cell factories for gamma‐aminobutyric acid. Amino Acids. 2010; 39(5):1107-1116. DOI: 10.1007/s00726-010-0582-7.
CrossRef - Diez-Gutiérrez L., San Vicente L., R. Barrón L. J., Villarán M. del C., Chávarri M. Gamma-aminobutyric acid and probiotics: Multiple health benefits and their future in the global functional food and nutraceuticals market. J Funct Foods. 2020; 64:103669. DOI: 10.1016/j.jff.2019.103669.
CrossRef - Křížová L., Dadáková K., Kašparovská J., Kašparovský T. Molecules. 2019; 24(6):1076. DOI: 10.3390/molecules24061076.
CrossRef - Kaufman P. B., Duke J. A., Brielmann H., Boik J., Hoyt J. E. A Comparative Survey of Leguminous Plants as Sources of the Isoflavones, Genistein and Daidzein: Implications for Human Nutrition and Health. J Altern Complem Med. 1997; 3(1):7-12. DOI: 10.1089/acm.1997.3.7.
CrossRef - Barnes S. Evolution of the health benefits of soy isoflavones. P Soc Exp Biol Med. 1998; 217(3):386-392. DOI: 10.3181/00379727-217-44249.
CrossRef - Kurzer M. S. Hormonal effects of soy isoflavones: studies in premenopausal and postmenopausal women. J Nutr. 2000; 130(3):660S-661S. DOI: 10.1093/jn/130.3.660S.
CrossRef - Wang Q., Ge X., Tian X., Zhang Y., Zhang J., Zhang P. Soy isoflavone: The multipurpose phytochemical. Biomed Rep. 2013; 1(5):697–701. DOI: 10.3892/br.2013.129.
CrossRef - Ribeiro M. L. L., Mandarino J. M. G., Carrão-Panizzi M. C., Oliveira M. C. N., Campo C. B. H., Nepomuceno A. L., Ida E. I. β-Glucosidase activity and isoflavone content in germinated soybean radicles and cotyledons. J Food BioChem. 2006; 30(4):453-465. DOI: 10.1111/j.1745-4514.2006.00075.x.
CrossRef - Matsumoto Y., Ohba R., Teramoto Y., Ohta N., Ueda S. Solubilization of a novel isoflavone glycoside-hydrolyzing β-glucosidase from Lactobacillus casei rhamnosus. J Ferment Bioeng. 1994; 77(4):439-441. DOI: 10.1016/0922-338x(94)90021-3.
CrossRef - Eckstein J. A., Ammerman G. M., Reveles J. M., Ackermann B. L. Analysis of glutamine, glutamate, pyroglutamate, and GABA in cerebrospinal fluid using ion pairing HPLC with positive electrospray LC/MS/MS. J Neurosci Meth. 2008; 171(2):190-196. DOI: 10.1016/j.jneumeth.2008.02.019.
CrossRef - Buck K., Voehringer P., Ferger B. Rapid analysis of GABA and glutamate in microdialysis samples using high performance liquid chromatography and tandem mass spectrometry. J Neurosci Meth. 2009; 182(1):78-84. DOI: 10.1016/j.jneumeth.2009.05.018.
CrossRef - Ren Q., Wang J. A., Liu S. L., Wang F., Wang H. Y. Identification and determination of isoflavones in germinated black soybean sprouts by UHPLC-Q-TOF-MS mass spectrometry and HPLC-DAD. Int J Food Prop. 2017; 20(12):2877-2887. DOI: 10.1080/10942912.2016.1256303.
CrossRef - Sekioka N., Kato D., Kurita R., Hirono S., Niwa O. Improved detection limit for an electrochemical γ-aminobutyric acid sensor based on stable NADPH detection using an electron cyclotron resonance sputtered carbon film electrode. Sensor Actuat B-chem. 2008; 129(1):442-449. DOI: 10.1016/j.snb.2007.08.040
CrossRef - Takeda S., Yamano N., Kawasaki N., Ando H., Nakayama A. Rapid determination of 4-aminobutyric acid and L-glutamic acid in biological decarboxylation process by capillary electrophoresis mass spectrometry. J Sep Sci. 2012; 35(2):286-291. DOI: 10.1002/jssc.201100776.
CrossRef - Vacek J., Klejdus B., Lojková L., Kubán V. Current trends in isolation, separation, determination and identification of isoflavones: A review. J Sep Sci. 2008; 31(11):2054-2067. DOI: 10.1002/jssc.200700569.
CrossRef - Panrod K., Tansirikongkol A., Panapisal V. Comparison of validated HPLC methods using two derivatizing agents for gamma-aminobutyric acid quantification. Thai Journal of Pharmaceutical Sciences. 2016; 40(4):203-208
CrossRef - Huang G., Cai W., Xu B. Improvement in beta-carotene, vitamin B2, GABA, free amino acids and isoflavones in yellow and black soybeans upon germination. LWT – Food Science and Technology. 2017; 75:488-496. DOI: 10.1016/j.lwt.2016.09.029.
CrossRef - Luo X., Wang Y., Li Q., Wang D., Xing C., Zhang L., Xu T., Fang F., Wang F. Accumulating mechanism of γ-aminobutyric acid in soybean (Glycine max ) during germination. Int J Food Sci Tech. 2018; 53(1):106-111. DOI: 10.1111/ijfs.13563.
CrossRef - Le P. H., Verscheure L., Le T. T., Verheust Y., Raes K. Implementation of HPLC Analysis for γ-Aminobutyric Acid (GABA) in Fermented Food Matrices. Food Anal Method. 2020; 13:1190-1201. DOI: 10.1007/s12161-020-01734-2.
- Mohammadian E., Rahimpour E., Foroumadi A., Alizadeh-Sani M., Hasanvand Z., Jouyban A. Derivatization of γ-Amino Butyric Acid Analogues for Their Determination in the Biological Samples and Pharmaceutical Preparations: A Comprehensive Review. Crit Rev Anal Chem. 2021; 52(8):1727-1754. DOI: 1080/10408347.2021.1916733.
CrossRef - Hayat A., Jahangir T. M., Khuhawar M. Y., Alamgir M., Siddiqui A. J., Musharraf S. G. Simultaneous HPLC determination of gamma amino butyric acid (GABA) and lysine in selected Pakistani rice varieties by pre-column derivatization with 2-Hydroxynaphthaldehyde. J Cereal Sci. 2014; 60(2):356-360. DOI: 10.1016/j.jcs.2014.05.011.
CrossRef - Hayat A., Jahangir T. M., Khuhawar M. Y., Alamgir M., Siddiqui A. J., Musharraf S. G. HPLC determination of gamma amino butyric acid (GABA) and some biogenic amines (Bas) in controlled, germinated, and fermented brown rice by pre-column derivatization. J Cereal Sci. 2015; 64:56-62. DOI: 10.1016/j.jcs.2015.04.014.
CrossRef - Zandy L., Doherty J. M., Wibisono N. D., Gonzales R. A. High sensitivity HPLC method for analysis of in vivo extracellular GABA using optimized fluorescence parameters for o-phthalaldehyde (OPA)/sulfite derivatives. J Chromatogr B Analyt Technol Biomed Life Sci. 2017; 1055-1056:1-7. DOI: 10.1016/j.jchromb.2017.04.003.
CrossRef - Takeuchi T. HPLC of Amino Acids as Dansyl and Dabsyl Derivatives. Journal of Chromatography Library. 2005; 70:229-241. DOI: 10.1016/S0301-4770(05)80010-7.
CrossRef - Bai Q., Chai M., Gu Z., Cao X., Li Y., Liu K. Effects of components in culture medium on glutamate decarboxylase activity and g-aminobutyric acid accumulation in foxtail millet (Setaria italica ) during germination. Food Chem. 2009; 116(1):152-157. DOI: 10.1016/j.foodchem.2009.02.022.
CrossRef - Phommalth S., Jeong Y., Kim Y., Dhakal K. H., Hwang Y. Effects of light treatment on isoflavone content of germinated soybean seeds. J Arg Food Chem. 2008; 56(21):10123–10128. DOI: 10.1021/jf802118g.
CrossRef - Toda T., Sakamoto A., Takayanagi T., Yokotsuka K. Changes in isoflavone composition of soybean during soaking in water. Food Sci Technol Res. 2001; 7(2):171-175. DOI: 10.3136/fstr.7.171.
CrossRef - Guo Y., Chen H., Song Y., Gu Z. Effects of soaking and aeration treatment on γ-aminobutyric acid accumulation in germinated soybean (Glycine max). Eur Food Res Technol. 2011; 232:787-795. DOI: 10.1007/S00217-011-1444-6.
CrossRef - Kim T. J., Sung C. H., Kim Y. J., Jung B. M., Kim E. R., Choi W. S., Jung H. K., Chun H. N., Kim W. J., Yoo S. H. Effects of a Soaking-Fermentation-Drying Process on the Isoflavones and g-Aminoburytic acid Contents of Soybean. Food Sci Biotechnol. 2007; 16(1):83-39.
CrossRef - Wang F., Wang H., Wang D., Fang F., Lai J., Wu T., Tsao R. Isoflavone, γ-aminobutyric acid contents and antioxidant activities are significantly increased during germination of three Chinese soybean cultivars. J Funct Foods. 2015; 14:596-604. DOI: 10.1016/j.jff.2015.02.016.
CrossRef - Xu J-G., Hu Q-P. Changes in g-aminobutyric acid content and related enzyme activities in Jindou 25 soybean (Glycine max ) seeds during germination. LWT-Food Science and Technology. 2014; 55(1):341-346. DOI: 10.1016/j.lwt.2013.08.008.
CrossRef - Hoeck J. A., Fehr W. R., Murphy P. A., Welke G. A. Influence of Genotype and environment on isoflavone contents of soybean. Crop Sci. 2000; 40(1):48-51. DOI: 10.2135/cropsci2000.40148x.
CrossRef - Seguin P., Wenju Z., Donald L. S., Wenhua D. Isoflavone content of soybean cultivars grown in eastern Canada. J Sci Food Arg. 2004; 84(11):1327-1332. DOI: 10.1002/jsfa.1825.
CrossRef - Zhu D., Navam S. H., Ronny H., Pengyin C. Isoflavone contents in germinated soybean seeds. Plant Food Hum Nutr. 2005; 60:147-151. DOI: 10.1007/s11130-005-6931-0.
CrossRef
Accepted on: 24 Mar 2023
Second Review by: Jorge Octavio Virues Delgadillo Mexico
Final Approval by: Dr. Dariusz Dziki


Web of Science Coverage
Emerging Sources Citation Index (ESCI)
2024 Journal Impact Factor: 1.1
Scopus Journal Metrics
CiteScore 2025: 2.6
CiteScore Details
Sustainable Nutrition: Food Systems, Nutrient Retention, and Public Health Impact
![]()
This journal is a member of, and subscribes to the principles of, the Committee on Publication Ethics (COPE)


