Glycaemic Indices of the Traditional Sago-based Snack and Staple Food in Sarawak, Malaysia
Sal Hazreen Bugam* and Efyza Hashim
Downstream Technology Division, CRAUN Research Sdn. Bhd., Lot, Block 14, Jalan Sultan Tengah, Kuching, SARAWAK.
Corresponding Author E-mail: salhazreen.craunresearch@gmail.com
DOI : http://dx.doi.org/10.12944/CRNFSJ.11.1.32
Download this article as:
![]()
Sago (Metroxylon sagu) starch was the staple carbohydrate source in Sarawak, Malaysia. Saguk and Linut are two well-known traditional Sago foods. Like many traditional Sago foods, their glycaemic index (GI) has yet to be established. This study aimed to determine the GI for Saguk and Linut. Isoglucidic servings containing 50g available carbohydrate for both foods and glucose drink as reference, were consumed by 12 healthy subjects. Blood was drawn at predefined intervals for 2 hours to measure postprandial glycaemia and subsequently to determine the GIs. Linut and Saguk demonstrated “moderate to high GI” and “moderate to low GI” values of 69.8 ± 5.5 and 46.9 ± 5.1. In addition, glycaemic load (GL) at various serving sizes was also evaluated. Serving sizes illustrated as one quarter, half and three quarters of a regular rice bowl, yielded “low to high” GLs values from 10.0 to 27.4 for Linut, while “low to moderate” GLs values from 5.9 to 17.6 for Saguk. Albeit its high GI, the GL for Linut at a serving size of up to half the volume of a regular rice bowl was moderate, thus suggesting a healthier serving Linut indulgence. This visualization is thought to be useful as portion control for Linut. This low GI characteristic of Sago is believed to be attributed to its resistant starch (RS) content. The marked GI difference between Saguk and Linut was the result of "wet" and "dry" heat treatments, which has profoundly affected the starch structure resulting in loss of RS, thus increasing starch digestibility. It is therefore noteworthy to exercise caution and refrain from any generalisation that meals composed predominantly from high RS sources such as Sago starch would elicit low glycaemic response. This can lead to erroneous deduction if factors such as food processing and glycaemic burden per serving are not judiciously considered.
KEYWORDS:Glycaemic Index; Glycaemic Load; Metroxylon sagu; Resistant Starch
Introduction
Globally, the incidence of Type 2 diabetes mellitus (T2DM) continued to be on the rise. In Malaysia alone, the National Health and Morbidity Survey (NHMS) 2019 revealed that the prevalence rate of T2DM among Malaysian adults has grown from 13.4% in 2015, to 18.3% in 2019 1. Additionally, of the nearly 1.7 million patients registered with the National Diabetes Registry in 2020, 10.07% of the cases were reported in Sarawak 2. The projected rise in the incidence of T2DM could develop into a substantial health problem worldwide. This is further exacerbated in the light of the COVID-19 pandemic, as diabetes patients suffer disproportionately from acute COVID-19. The higher rates of serious complications and death had posed challenges to primary caregivers to appropriately manage glycaemia in COVID-19 patients with diabetes comorbidity 3.
It is widely accepted that diet and nutrition play an important role in the prevention and management of diabetes. The wake of diabetes awareness has led to increasing interest in the role of low glycaemic index (GI) diet to reduce the risk of metabolic diseases including diabetes. GI is used to classify food based on their postprandial blood glucose raising potential. GI is defined as incremental area under blood glucose response curve (iAUC) expressed as a percent of the response, after consuming a test food that contains isoglucidic amount of either 25g or 50g of available carbohydrate to that of a standard food consumed by the same subject 4. In a low-GI food, longer time is required by the body to convert carbohydrate to glucose hence reducing both the postprandial glycaemic and insulinaemic response in our body. Thus, GI is widely used as a guide for food choices. In addition, a food GI is closely related to the digestibility of carbohydrate present in such food. Slower rate of digestion and absorption was identified as the factor to result in a gradual and controlled rise in postprandial glycaemia hence the food GI 5,6.
One of the main limitations in GI is, it does not take into consideration the amount of carbohydrate consumed even though this is a primary predictor of glycaemic response, and this has led to introduction of Glycaemic Load (GL) 7. While GI tells us about the quality or type of carbohydrate of a food, GL associates this information with its serving size. Up to this point, GI is established based on the portion of either 25g or 50g of available carbohydrate. However, almost always, this serving size is usually too big and does not represent the regular serving size of the food. A classic example is watermelon, which although the GI is high, it has a low GL because of the typically small serving size 8. Essentially, as the name implies, food with higher GL is expected to elevate postprandial blood glucose more than that of a lower GL. As a rule of thumb, foods that have low GL almost always have low GI, while those with an intermediate or high GL may have GI ranging from very low to very high 9.
Before the introduction of rice, Sago starch was the staple carbohydrate source in Sarawak and some areas in Indonesia. Currently it is still widely used to make different types of food, such as Sago pearls, tebaloi (a popular biscuit), keropok (shrimp crackers), puddings and jellies 10.
The Sago-based test foods tested in this study were Saguk and Linut. These two foods are indigenous to Sarawak, and largely consumed by the Melanau ethnic group, given the fact that Sago palm holdings are primarily located within their population locality. However, these foods can now be found widely throughout Sarawak.
Saguk is typically made by mixing Sago starch with ingredients among which includes desiccated coconut, coconut milk, rice husk, oil, water, and salt11. The composite is shaken horizontally on a traditional sieve. Continuous agitation will aggregate the composite into many small pearl-shaped Saguk. Saguk is then slowly roasted over wood fire which gives it the charred aroma. Traditionally Saguk is eaten on its own as snack, and can also be eaten with fish to replace rice in a main dish.
Linut has glue-like texture as it is in fact the gelatinized Sago starch and is typically eaten with sambal – a condiment made from shrimp paste, chilies, and lime. As a complete meal, Linut is also eaten with dishes such asam pedas (sour and spicy fish stew), to replace the carbohydrate component of rice12.
Like many traditional Sago meals, both Saguk and Linut have yet to have their GI determined. Therefore, the aim of this study was to measure the GI of two Sarawak’s traditional carbohydrate-rich foods made from Sago starch. Subsequently the GL of these Sago foods at illustrative serving sizes were determined. This information will provide an idea of how these traditional foods should be consumed with a view to manage glucose intake. In addition, some insight on factors influencing starch digestibility which in turn affecting the GI of Sago food is also demonstrated.
Materials and Methods
Nutritional Analysis
Nutritional analysis for Saguk and Linut were conducted using proximate method stipulated in the Association of Official Analytical Chemists (AOAC) standard methods, namely for protein, fat, ash, and moisture. Total carbohydrate was determined by calculation, while total dietary fibre was determined using method AOAC991.43. The available carbohydrate was then calculated by subtracting total dietary fibre (TDF) from the total carbohydrate obtained. Finally, the serving size that contained 50g available carbohydrate for both foods were determined accordingly. In this study, Linut was served with commercial ready-to-eat sambal (Adabi® Sambal belacan pedas manis), of which the nutritional information was obtained from the product label.
Preparation of test foods
Saguk used in this study was procured from a well-known Saguk entrepreneur from Kampung Medong, Dalat, Sarawak. Their product was synonymous with the brand of Saguk Medong as one of highly sought after Saguk in the state. Despite years of business, the production was still maintained at cottage industry level.
In this study, Linut was prepared fresh on test day. Linut with the right consistency was obtained by slowly adding 500ml of water to 88.5g of Sago starch, whilst heating over stove with rigorous stirring. Linut was ready when the starch had completely gelled and became translucent. The proper amount of Linut according to serving size determined was taken from this preparation. Likewise, an appropriate amount of sambal was served with Linut. The available carbohydrate contributed per serving from both Linut and sambal were 47.5g and 2.5g respectively, which total to 50g as required by the study.
Glucose, D(+)-Glucose anhydrous (HmbG Chemicals) was the reference food chosen for this study. To prepare the glucose drink, 50g of D(+)-Glucose anhydrous was dissolved in 250mL water.
Glycaemic Index Study
The ethics and conduct of this GI study was reviewed and approved by Crop Research and Application Unit (CRAUN) Research Committee, Kuching, Sarawak (Approval number: CRAUNRC/20/01/IHGI20001) and carried out in accordance with Food and Agriculture Organisation (FAO) Food and Nutrition Paper on the Definition of Glycaemic Index. In line with the principle of good clinical practice, informed consent was obtained from all subjects prior to conducting the study.
This study targeted to recruit 12 subjects and inclusion criteria for these subjects include, healthy male or female subjects (not pregnant or lactating) aged between 18 – 55 years; who had body mass index (BMI) within 18 – 30 kg/m2; who were not diabetic or prediabetic with fasting blood glucose (FBG) ≤ 5.6 mmol/L and 2-hour postprandial glucose level ≤ 7.8 mmol/L after an oral glucose tolerance test (OGTT). Prior to enrollment to the study, the OGTT screening was conducted by PathLab, an external medical pathology lab. Only subjects who fulfilled these inclusion criteria were recruited for the study.
All subjects are required to complete five periods on separate days. This includes three periods for glucose drink and a period each for Saguk and Linut, of which sequence was in random order. Each food was served with 250 mL water, while the glucose drink was dissolved in an equal amount of water. The subjects were required to fast overnight for at least 10 hours prior to attending the study site in the morning. The study was held at Downstream Technology Division (DTD) food pilot plant, CRAUN Research Sdn. Bhd., Kuching, Sarawak.
Blood glucose samplings were done on -15 minute and 0 minute before food intake and the mean was regarded as the fasting or baseline glucose level. Minute zero was timed starting from the time subject took the first bite of the foods or first sip of the glucose drink. Subsequently, blood glucose samplings were done on 15, 30, 45, 60, 90, and 120 minutes postprandial. Finger-prick capillary blood was sampled using sterile, single-use lancing device (Accucheck Safe-T-Pro Plus; Roche Diagnostics) and blood glucose was measured using glucometers (AccuChek Guide; Roche Diagnostics). Capillary blood sampling is the recommended blood glucose measurement method in a GI study by FAO guideline 4. In addition, capillary blood glucose was found to have smaller variability in determining GI value of food than venous blood glucose testing 13.
Glucose response curve, GI and GL Evaluation
A glucose response curve was plotted and incremental area under the curve (iAUC) above the fasting glucose level were calculated according to the trapezoidal rule for each food 4. For each subject, iAUC of each test food (iAUCtest) was divided by mean iAUC of glucose drink from three repeated trials (iAUCreference) and then expressed a percentage. The resulting values from all subjects were then averaged to calculate the GI for each test food.
The GI value of carbohydrate-rich foods can be classified as low (GI = <45), medium (GI = 46–69), and high (GI = >70) 14. The GI values obtained for both Saguk and Linut were then compared using t-test assuming unequal variances, with significance level set as p < 0.05.
GL is determined using the GI value obtained. GL is defined as product of the available carbohydrates in grams in a serving of such food, and the food’s GI and calculated as follows 8:
The GL value can be classified as low (GL =<10), medium (GL = 11 – 19), and high (GL = >20) 9. Results were presented as mean ± SEM. Computational for iAUCs were calculated using GraphPad Prism version 5.01 and other calculations and statistic were done in Microsoft® Excel® 2016 and SPSS 21.0.
Results
Nutritional analysis and available carbohydrate determination
Table 1 depicts the nutritional analysis results for both test foods and Sambal which was served with Linut. Both fat and protein were not detected in Linut samples as the ingredient was solely Sago starch which has low protein and fat content. A serving of 68g of Saguk was determined to provide 50g available carbohydrate. Meanwhile, the amount of available carbohydrate in a serving of 363.0g Linut was 47.5g. Small portion of Sambal contributed to the remaining available carbohydrate to make up to the serving size required by the study. As an illustrative the serving of 363g of Linut is equal to one heaped regular rice bowl. The volume of the bowl used in this study is approximately 280mL.
Table 1: Nutritional and available carbohydrate determination for test foods
| Saguk | Linut | Sambal | |
| Total Energy (kcal/100g) | 466 | 54 | 220 |
| Carbohydrate (g/100g) | |||
| Total (g/100g) | 76.7 | 14.1 | 30.0 |
| Total Dietary Fibre (g/100g) | 3.7 | 1.0 | 4.4 |
| Available (g/100g) | 73.0 | 13.1 | 25.6 |
| Fat (g/100g) | 17.5 | N.D | 9.2 |
| Protein (g/100g) | 2.3 | N.D | 4.3 |
N.D – not detected.
Baseline characteristics of subjects
The baseline characteristics of these subjects at screening, data are presented as mean ± standard deviation (Table 2). 12 subjects were successfully recruited and out of the 12 subjects, eight were males. All twelve subjects managed to finish the glucose drink and Saguk within time required. However, four subjects did not manage to finish even up to half the serving of Linut given to them. Therefore, their data were discarded in considering the GI value for Linut. The exclusion of these four subjects did not adversely affect the GI consideration as the FAO Food and Nutrition Paper recommended at least seven subjects for a GI study 4. Therefore, for Linut, only data from the remaining eight subjects was considered. Their primary reason to reject Linut was due to its texture.
Given its glue-like nature, Linut is a type of food which may not have the sensory cues, but it can develop acquired preference over time. Although Linut is a traditional food in Sarawak, it is however has becoming a less common staple among the younger generations. If future study were to be conducted, especially involving food atypical to normal liking, it would be wise to have the subject consuming and test the food as a practice prior to commencing the study, to mitigate risk of losing subjects due to protocol noncompliant.
Table 2: Baseline characteristics of study participants (N=12)
| Parameter | N=12 |
| Male | 8 |
| Age, year | 31.2 ± 10.6 |
| Body weight, kg | 63.6 ± 11.1 |
| BMI*, kg/m2 | 22.8 ± 2.5 |
| Fasting blood glucose, mmol/L | 4.6 ± 0.4 |
| OGTT post 2-hour glucose, mmol/L | 5.5 ± 0.9 |
| HbA1c | 5.5 ± 0.2 |
*BMI, body mass index; OGTT, oral glucose tolerance test; Mean ± SEM (standard error of mean)
Glycaemic Index and Glycaemic Load Analysis
Postprandial blood glucose response after consumption of Saguk and Linut are presented in Figure 1(a) and Figure 1(b) respectively. The mean iAUCs and GIs for both Saguk and Linut as summarized in Table 3. From the analysis, with the consideration of the standard error, it can be classified that Saguk has a moderate to low GI with GI value of 46.9 ± 5.1. Linut on the other hand has a moderate to high GI value of 69.8 ± 5.5. The difference in GIs between these sago foods is significant with p = 0.009 as in Figure 2.
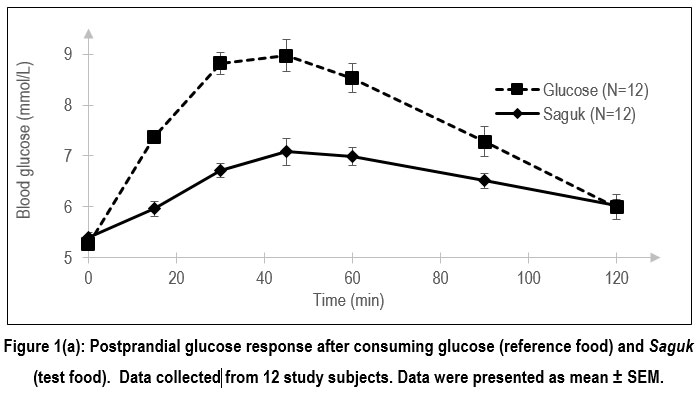 |
Figure 1(a): Postprandial glucose response after consuming glucose (reference food) and Saguk (test food). |
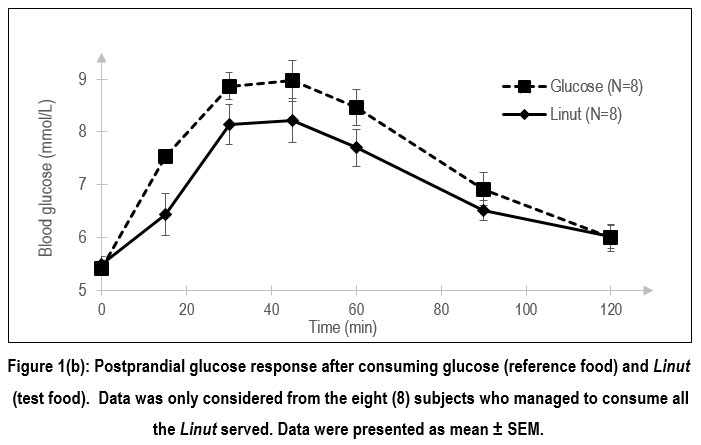 |
Figure 1(b): Postprandial glucose response after consuming glucose (reference food) and Linut (test food). |
Table 3: Mean iAUCs and GIs for Saguk and Linut.
| Saguk (N=12) | Linut (N=8) | |||
| Mean | SEM | Mean | SEM | |
| iAUCtest | 133.3 | 15.3 | 186.6 | 26.4 |
| iAUCreference | 288.3 | 21.4 | 265.1 | 23.5 |
| Gltest | 46.9 | 5.1 | 69.8 | 5.5 |
iAUC, incremental area under the curve; GI, glycaemic index; SEM, standard error of mean.
‡ Only data from 8 subjects were considered in the evaluation of GI for Linut.
Figure 2: Glycaemic indices (GI) values for Saguk (N=12) and Linut (N=8). The data represent mean±SEM from 12 subjects for Saguk and 8 subjects for Linut. Significant difference between the GIs of these two Sago foods, p = 0.009, t-test assuming non-equal variance.
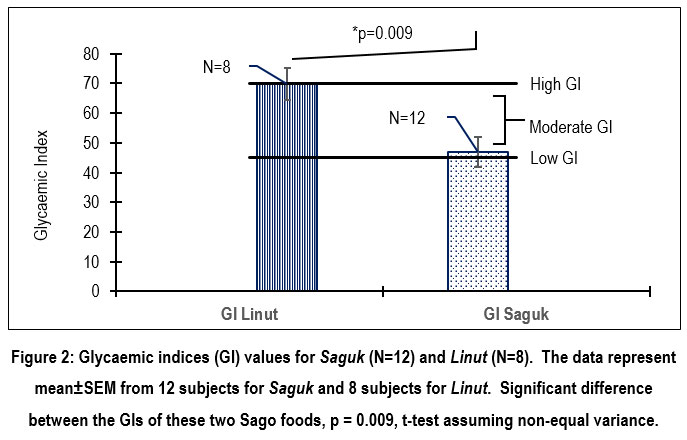 |
Figure 2: Glycaemic indices (GI) values for Saguk (N=12) and Linut (N=8). The data represent mean ± SEM from 12 subjects for Saguk and 8 subjects for Linut. |
A further evaluation of the GL for these Sago foods is presented in Table 4. This GLs evaluation was attempted based on illustrative serving sizes relative to that of the serving sizes used in the GI study, which were 363g and 68g for Linut and Saguk respectively. Realistically the serving used in the GI study may be a bit too large than their regular serving sizes. In fact, the serving size for Linut in the GI study which can be visualised as heaped regular rice bowl, was deemed a lot by the study subjects.
GL evaluation revealed that if the size of serving for Linut is reduced to approximately a quarter of the amount that was served in GI serving, the GL is 10.0 which is still considered low. Half serving of Linut is reported to provide moderate GL of 18.3. Increasing the portion of Linut to approximately three-quarter of the GI study portion, will increase the GL further to 27.4 which is considered high. For Saguk, the GL ranges from 5.9 (low), 11.7 (moderate) and 17.6 (moderate) for serving of a quarter, half, and three-quarter of that served in GI study.
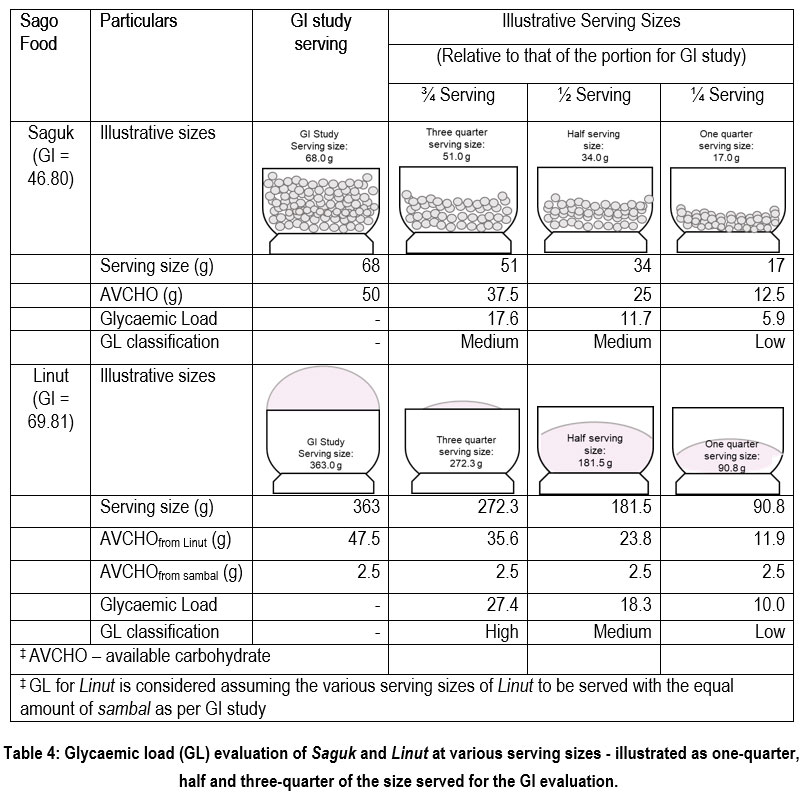 |
Table 4: Glycaemic load (GL) evaluation of Saguk and Linut at various serving sizes – illustrated as one-quarter, half and three-quarter of the size served for the GI evaluation. |
Discussions
In this study, the GIs of Linut and Saguk were determined as 69.8 ± 5.5 and 46.9 ± 5.1 accordingly. Based on GI classification, these values are classified as being “moderate to high GI” and “moderate to low GI”. Traditionally, like rice, Linut is taken as main carbohydrate component in a complete dish. It is known that the GI for rice varies according to variety. The commonly eaten Jasmine white rice’s GI ranged from 80 – 92 which is categorized as high GI 15,16. Basmathi rice which typically being labelled as “healthy rice” has a moderate GI of 55 – 62, and lastly Bario rice – a variety which is also indigenous to Sarawak demonstrated a moderate GI of 60 – 62 15,17. Thus, it is obvious that as main carbohydrate component, when compared to Jasmine white rice, consuming Linut will have less effect on postprandial glycaemia.
A further evaluation of the GL revealed that, on regular-sized serving, the GL for Linut ranges from “low to high”, while Saguk reported GL from “low to moderate”. This GL evaluation should raise awareness regarding the appropriate portion control to consider for healthier indulgence of these Sago foods. As an example, despite Linut having moderate to high GI, it can still be enjoyed at a smaller portion. As shown in this study, even at a serving of up to 181.5g – which portion can be visualised as slightly more than half the volume of a Regular rice bowl, the GL value was considered as moderate. This suggests that the serving size for a healthy Linut indulgence can be up to approximately half the volume of a Regular rice bowl. It should be interesting to learn the satiating effect afforded by these smaller servings of Linut, which evaluation was not covered in this study.
Unlike Linut, subjects considered the serving size for Saguk in this study was still appropriate. Its GL in regular-serving sizes ranged from low to moderate making Saguk a healthy snacking choice. The Sago characteristics for having low GI is believed to be attributed to the resistant starch (RS) content in Sago starch. RS is defined as the sum of starch and the product of starch digestion that resist digestion in small intestine of a normal human being 18. It acts more as dietary fibre for colonic fermentation by gut bacteria. From perspective of blood glucose control, food made from starch with high RS generally exhibit low GI value. It was reported that the RS content in native Sago starch ranged from 45.53 to 68.99% 19,20. Furthermore, analogue rice made from 100 percent Sago starch reported to exhibit low GI value of approximately 40.7 21.
However, from this study it is evident that this is not necessarily true for Linut. Despite being made solely from high RS Sago starch, Linut has high GI, which was also significantly higher than GI for Saguk (p=0.009). This finding concurs to that of an earlier study which suggested various supplementation made from Sago such as porridge, paste and gel elicited high postprandial plasma glucose response 22. This finding thus suggested that for a starch-rich food, apart from RS content, there are additional factors that can affect digestibility and consequently the food’s GI. Thermal treatment during food processing has been suggested as one of the factors to cause paramount effect on starch structure and consequently its digestibility 23,24. These thermal treatments may be divided into two types namely the “wet” methods such as boiling, steam cooking etc., and “dry” methods which include grilling, microwaving and roasting.
Of these methods, boiling in water has been suggested to result in rapid starch digestion. The crystalline structure of starch changes because of heating in a large volume of water, making it more vulnerable to enzymatic hydrolysis 25. In the similar manner to boiling, preparation of Linut requires Sago starch to be gelatinized, where starch and water are subjected to heat resulting in the starch granules absorbing water, swell and eventually burst to form gel. A gelatinized starch is more susceptible to enzyme hydrolysis and digestion. This is due to its amorphous nature which provides more binding sites for α-amylase and consequently will result in high GI food as was seen in Linut 26.
In contrast, when the “dry” heat treatment methods are used, less RS is affected thus, more native RS remain in product 27. To date, Saguk production still uses the traditional method which involves roasting Saguk over wood fire in a specialized hut built with clay hearth 11. This slow roasting may have managed to preserve the RS in Saguk, and it is evident in the value of GI obtained. The similar effect of “wet” and “dry” heat treatment was also demonstrated in baked potato which has higher RS content than that of the boiled ones 27.
Furthermore, incorporation of other ingredients in Saguk such as rice husk, desiccated coconut and coconut milk may also have some contributing factors in attenuating glycaemia. First, these ingredients can increase the amount of dietary fibres in Saguk. To date, the positive effect of high dietary fibre diet for glycaemic control has been widely established and accepted. Second is the possibility of interaction between Sago starch and fat, afforded by coconut milk and oil in Saguk which may have led to formation of amylose-lipid complex (ALC). This complex has recently been considered as a novel type of RS 28. Depending upon digestive resistance mechanism RS may be classified into several types from type 1 (RS1) to type 4 (RS4) 29. Of the recent, several studies had suggested that ALC, either artificially created or formed during cooking, can be considered as type 5 resistant starch (RS5) 29. Meanwhile, native Sago starch is classified as RS2, which is the starch that is protected from digestion due to their crystalline structure 30.
The formation of ALC involved amylose morphing into a helix shape from its random coil structure in the presence of lipids, and therefore making alteration to its glycosidic bonds’ torsion angles. This change in angle consequently result in a structure less accessible to digestive enzymes, thus increased the resistance 29. In preparation of Saguk, lipid from coconut milk and oil may have interacted with amylose from Sago starch to form ALC, this however requires further elucidation. Using the complexing index (CI), the extent of ALC formation can be determined with Iodine via colorimetry approach 31. This was not covered in this study and should warrant for future research.
Up to this point, it is clear that food processing profoundly affects a native starch’s ordered structure which on its own, acts as natural physical barrier to enzyme digestion 32. In many foods, such structure is destroyed due to hydrothermal processes, which promotes partial or complete starch gelatinization 33,34. This implicates in loss of that resistive structure in native starch, and therefore increased enzyme digestibility. Linut and Saguk have demonstrated the impact of “wet” and “dry” thermal treatment, evident through the value of GI obtained. That being said, other food processing treatments regardless of “wet” or “dry” such as baking, frying and storage conditions were also found to have the potential to alter the RS content hence digestibility of foods 35.
To a certain extent, this study also suggested that incorporation of RS into food products may not always be straightforward and one that requires thoughtful considerations. Earlier studies suggested that 20 to 30g of RS can provide the physiological benefits to human 36,37. However, it is now understood that often the RS fraction of a food is compromised by conventional food processing 38. As a result, method to increase the RS content either in raw starch as ingredient, or in processed foods, as well as overall strategies to slow the digestion of starchy food, are being studied extensively 24,39.
That being said, this study is not without any limitations. One of the limitations is the Saguk used in this study was obtained from only one Saguk supplier. As the recipe and processing can differ from one supplier to another, it would be of interest to examine the GI of Saguk from these various suppliers. Another limitation is the study was conducted with relatively small sample size especially for Linut, which was almost close to the bare minimum size for GI evaluation according to the FAO guidelines4.
Conclusion
This study has managed to determine the GI of traditional Sarawak Sago foods namely Linut and Saguk which had never been established before. Linut and Saguk demonstrated “moderate to high GI” and “moderate to low GI” values of 69.8 ± 5.5 and 46.9 ± 5.1 respectively. Serving sizes illustrated as one quarter, half and three quarter of a regular rice bowl, yielded “low to high” GLs values from 10.0 to 27.4 for Linut, while “low to moderate” GLs values from 5.9 to 17.6 for Saguk.
Finally, this study has also managed to yield some insights to factors which may affect digestibility hence the GI of these Sago foods and starch-rich food in general. Despite earlier studies suggesting Sago starch as having low GI value, this however was not the case for Linut. It became evident that for Linut, hydrothermal cooking has gelatinized the Sago starch and altering its structure, resulting in loss of native RS thus increased starch digestibility and GI. Contradictorily, “dry” heat treatment for Saguk may have preserved its native RS.
Acknowledgement
All authors would like to thank the Sarawak State Government for financially funded the work involved in this project gratefully acknowledge the Management of CRAUN Research Sdn. Bhd. for publishing the findings of this study.
Conflict of Interest
All authors are the employee of CRAUN Research Sdn Bhd, where CRAUN Research is an agency entrusted by Sarawak State Government to spearhead Sago Research in Sarawak.
Funding Sources
This work was supported by The Ministry of Education, Culture, Research, and Technology 090/E5/PG.02.00/PT/2022). The funding grant no: RMK11P3/1.2.3.
References
- Institute for Public Health. National Health and Morbidity Survey 2019 (NHMS 2019): Non-Communicable Diseases, Healthcare Demand, and Health Literacy – Key Findings.; 2020.
- Zakariah N, Chandran A. National Diabetes Registry Report 2020.; 2021. doi:10.13140/RG.2.2.12409.60004
- Wake DJ, Gibb FW, Kar P, et al. ENDOCRINOLOGY IN THE TIME OF COVID-19: Remodelling diabetes services and emerging innovation. Eur J Endocrinol. 2020;183(2):G67-G77. doi:10.1530/EJE-20-0377
CrossRef - Carbohydrates in human nutrition. Report of a Joint FAO/WHO Expert Consultation. FAO Food Nutr Pap. 1998;66:1-140.
CrossRef - Thorne MJ, Thompson LU, Jenkins DJ. Factors affecting starch digestibility and the glycemic response with special reference to legumes. Am J Clin Nutr. 1983;38(3):481-488. doi:10.1093/ajcn/38.3.481
CrossRef - Giri S, Banerji A, Lele SS, Ananthanarayan L. Starch digestibility and glycaemic index of selected Indian traditional foods: Effects of added ingredients. Int J Food Prop. 2017;20(sup1):S290-S305. doi:10.1080/10942912.2017.1295387
CrossRef - Madhu S. Glycaemic index: challenges in translating concept to practice. Int J Diabetes Dev Ctries. 2017;37(4):377-378. doi:10.1007/s13410-017-0585-y
CrossRef - Kim D. Glycemic index. In: Obesity. Elsevier; 2020:183-189. doi:10.1016/B978-0-12-818839-2.00014-4
CrossRef - Lu ZQ, Yan J. Dietary Carbohydrate and Age-Related Cataract. In: Handbook of Nutrition, Diet and the Eye. Elsevier; 2014:271-277. doi:10.1016/B978-0-12-401717-7.00027-7
CrossRef - Karim AA, Tie APL, Manan DMA, Zaidul ISM. Starch from the Sago ( Metroxylon sagu ) Palm TreeProperties, Prospects, and Challenges as a New Industrial Source for Food and Other Uses. Compr Rev Food Sci Food Saf. 2008;7(3):215-228. doi:10.1111/j.1541-4337.2008.00042.x
CrossRef - Ahmad Ishak SZ, Taibi M, Yaakub AN. Impact of Sago Crop Commercialization Programs on Gender Roles of Melanau Communities in Sarawak, Malaysia. Asian Soc Sci. 2017;13(12):35. doi:10.5539/ass.v13n12p35
CrossRef - Magiman M, Jamaluddin R, Nasir A, et al. Cultural heritage of Vaie community: Engulfed cultural heritage of minor ethnic groups by other larger ethnic groups. Opcion. 2020;35:1940-1963.
- Wolever TMS, Vorster HH, Björck I, et al. Determination of the glycaemic index of foods: interlaboratory study. Eur J Clin Nutr. 2003;57(3):475-482. doi:10.1038/sj.ejcn.1601551
CrossRef - Foster-Powell K, Holt SH, Brand-Miller JC. International table of glycemic index and glycemic load values: 2002. Am J Clin Nutr. 2002;76(1):5-56. doi:10.1093/ajcn/76.1.5
CrossRef - Tan VMH, Wu T, Henry CJ, Lee YS. Glycaemic and insulin responses, glycaemic index and insulinaemic index values of rice between three Asian ethnic groups. Br J Nutr. 2015;113(8):1228-1236. doi:10.1017/S0007114515000586
CrossRef - Camps SG, Lim J, Koh MXN, Henry CJ. The Glycaemic and Insulinaemic Response of Pasta in Chinese and Indians Compared to Asian Carbohydrate Staples: Taking Spaghetti Back to Asia. Nutrients. 2021;13(2):451. doi:10.3390/nu13020451
CrossRef - Daniel N, Khalid KH, Chua HP, Ahmad R. Nutritional value and glycemic index of Bario rice varieties. Journal of Tropical Agriculture and Food Science (Malaysia). 2014;42(1):1-8.
- Englyst HN, Kingman SM, Cummings JH. Classification and measurement of nutritionally important starch fractions. Eur J Clin Nutr. 1992;46 Suppl 2:S33-50.
- Zaman SA, Awang Seruji AZR, Sarbini SR. Effect of Acetylation on Physicochemical Properties and Resistant Starch Content of Metroxylon sagu Starch. In: International Academy of Engineers (IA-E) August 25-26, 2015 Kuala Lumpur, Malaysia. International Academy of Engineers (IA-E); 2015. doi:10.15242/IAE.IAE0815408
CrossRef - Lokman EF, Abdul Aziz SM, Ibrahim AS, Yunus N, Awang Seruji AZR, Bugam SH. Hepatic Glucose Regulations by Sago (Metroxylon sagu) Resistant Starch in Diabetic Goto Kakizaki Rat. International Journal of Biomedical Science. 2021;17(3).
- Wahjunings SB, Marsono Y, Praseptian D, Haryanto B. Resistant Starch Content and Glycaemic Index of Sago (Metroxylon spp.) Starch and Red Bean (Phaseolus vulgaris) Based Analogue Ric. Pakistan Journal of Nutrition. 2016;15(7):667-672. doi:10.3923/pjn.2016.667.672
CrossRef - Ahmad H, Singh R, Ghosh AK. Glycaemic & insulinaemic responses in men at rest following sago meal. Indian J Med Res. 2009;130(2):160-165.
- Narwojsz A, Borowska EJ, Polak-Śliwińska M, Danowska-Oziewicz M. Effect of Different Methods of Thermal Treatment on Starch and Bioactive Compounds of Potato. Plant Foods for Human Nutrition. 2020;75(2):298-304. doi:10.1007/s11130-020-00808-0
CrossRef - Pellegrini N, Vittadini E, Fogliano V. Designing food structure to slow down digestion in starch-rich products. Curr Opin Food Sci. 2020;32:50-57. doi:10.1016/j.cofs.2020.01.010
CrossRef - Narwojsz A, Borowska EJ, Polak-Śliwińska M, Danowska-Oziewicz M. Effect of Different Methods of Thermal Treatment on Starch and Bioactive Compounds of Potato. Plant Foods for Human Nutrition. 2020;75(2):298-304. doi:10.1007/s11130-020-00808-0
CrossRef - Martinez MM, Li C, Okoniewska M, Mukherjee I, Vellucci D, Hamaker B. Slowly digestible starch in fully gelatinized material is structurally driven by molecular size and A and B1 chain lengths. Carbohydr Polym. 2018;197:531-539. doi:10.1016/j.carbpol.2018.06.021
CrossRef - Raatz SK, Idso L, Johnson LK, Jackson MI, Combs GF. Resistant starch analysis of commonly consumed potatoes: Content varies by cooking method and service temperature but not by variety. Food Chem. 2016;208:297-300. doi:10.1016/j.foodchem.2016.03.120
CrossRef - Hasjim J, Lee S, Hendrich S, Setiawan S, Ai Y, Jane J. Characterization of a Novel Resistant‐Starch and Its Effects on Postprandial Plasma‐Glucose and Insulin Responses. Cereal Chem. 2010;87(4):257-262. doi:10.1094/CCHEM-87-4-0257
CrossRef - Li L, Liu Z, Zhang W, Xue B, Luo Z. Production and Applications of Amylose‐Lipid Complexes as Resistant Starch: Recent Approaches. Starch – Stärke. 2021;73(5-6):2000249. doi:10.1002/star.202000249
CrossRef - Zailani MA, Kamilah H, Husaini A, Awang Seruji AZR, Sarbini SR. Functional and digestibility properties of sago (Metroxylon sagu) starch modified by microwave heat treatment. Food Hydrocoll. 2022;122:107042. doi:10.1016/j.foodhyd.2021.107042
CrossRef - Lau E, Zhou W, Henry CJ. Effect of fat type in baked bread on amylose–lipid complex formation and glycaemic response. British Journal of Nutrition. 2016;115(12):2122-2129. doi:10.1017/S0007114516001458
CrossRef - Yee JC. Amylopectin Molecular Structure from Different Banana Cultivars and Its Influence on the Formation of Structurally-Driven Slowly Digestible Starch. Master of Applied Science. University of Guelph; 2019.
CrossRef - Martínez MM, Román L, Gómez M. Implications of hydration depletion in the in vitro starch digestibility of white bread crumb and crust. Food Chem. 2018;239:295-303. doi:10.1016/j.foodchem.2017.06.122
- Dhital S, Warren FJ, Butterworth PJ, Ellis PR, Gidley MJ. Mechanisms of starch digestion by α -amylase—Structural basis for kinetic properties. Crit Rev Food Sci Nutr. 2017;57(5):875-892. doi:10.1080/10408398.2014.922043
CrossRef - Singh Yadav B. Effect of frying, baking and storage conditions on resistant starch content of foods. British Food Journal. 2011;113(6):710-719. doi:10.1108/00070701111140061
CrossRef - Robertson MD, Bickerton AS, Dennis AL, Vidal H, Frayn KN. Insulin-sensitizing effects of dietary resistant starch and effects on skeletal muscle and adipose tissue metabolism. Am J Clin Nutr. 2005;82(3):559-567. doi:10.1093/ajcn.82.3.559
CrossRef - Al-Tamimi EK, Seib PA, Snyder BS, Haub MD. Consumption of Cross-Linked Resistant Starch (RS4 XL ) on Glucose and Insulin Responses in Humans. J Nutr Metab. 2010;2010:1-6. doi:10.1155/2010/651063
CrossRef - Foster-Powell K, Holt SH, Brand-Miller JC. International table of glycemic index and glycemic load values: 2002. Am J Clin Nutr. 2002;76(1):5-56. doi:10.1093/ajcn/76.1.5
CrossRef - Dupuis JH, Liu Q, Yada RY. Methodologies for Increasing the Resistant Starch Content of Food Starches: A Review. Compr Rev Food Sci Food Saf. 2014;13(6):1219-1234. doi:10.1111/1541-4337.12104
CrossRef
Accepted on: 22 Mar 2023
Second Review by: Nagat Eltoum Saudi Arabia
Final Approval by: Dr Ardiansyah


Web of Science Coverage
Emerging Sources Citation Index (ESCI)
2024 Journal Impact Factor: 1.1
Scopus Journal Metrics
CiteScore 2025: 2.6
CiteScore Details
Sustainable Nutrition: Food Systems, Nutrient Retention, and Public Health Impact
![]()
This journal is a member of, and subscribes to the principles of, the Committee on Publication Ethics (COPE)


