Effect of Protein Concentrates and Isolates on the Rheological, Structural, Thermal and Sensory Properties of Ice Cream
Antonina Anatolievna Tvorogova1
, Tatyana Vladimirovna Shobanova1, Igor Timofeyevich Smykov2 1All-Russian Scientific Research Institute of Refrigeration Industry – branch of V.M. Gorbatov Federal Research Center for Food Systems, Moscow, Russian Federation.
2All-Russian Scientific Research Institute of Butter- and Cheesemaking – branch of V.M. Gorbatov Federal Research Center for Food Systems, Uglich, Russian Federation.
Corresponding Author E-mail: iixrug@yandex.ru
DOI : http://dx.doi.org/10.12944/CRNFSJ.11.1.22
Download this article as:
![]()
The possibility of using protein concentrates and isolates instead of milk solids-not-fat (MSNF) in the production of ice cream with a high mass fraction of milk fat (12%) and increased mass fraction of protein was investigated and justified in this article. The ice cream samples with use of milk protein concentrates (MPC), whey protein concentrates (WPC), milk protein isolates (MPI) and native whey protein isolates (NWPI) were made according to classical technology. Ice cream samples were analyzed by their quality indices. Viscosity and texture of samples were studied by the rheological methods; the overrun was calculated. The microstructural properties, such as dispersion of ice crystals and air bubbles were investigated by the light microscopy. The sensorial properties were analyzed by 6 certified panelists. The reduction in viscosity by 9-74% with use of MPC, WPC and MPI and the increase by 96% with use of NWPI were noted. It was found that replacement of MSNF reduced the overrun by 36-67%. Study of microstructure showed that with use of protein isolates, mean size of ice crystals was reduced and with use of protein concentrates was increased. The increasing in mean size of air bubbles with use of NWPI was established. The studied textural parameters were increased with use MPC and MPI. The hardness and adhesiveness with use of NWPI were increased. The sensorial properties of samples with replacement of MSNF were not worse than with use of MSNF. It has been established that the replacement of MSNF with concentrates and isolates of milk and whey proteins can be an effective way to increasing the protein content in ice cream while maintaining or improving its sensory properties.
KEYWORDS:Hardness; Ice cream; Protein concentrates; Protein isolates; Structure; Viscosity
Introduction
One of the most popular dairy dessert products in the world is ice cream. Therefore, researchers over the years1 have proposed new technological methods for its manufacture and various recipes both to meet consumer requirements and to reduce production costs. Common ice cream formulations include dairy, sugar, stabilizers, emulsifiers, flavors, and colors. Ice cream is high in calories due to fat and sugar, but the protein content in it is not enough. Protein deficiency in food is a global food problem. Considerably, the use of proteins from dairy by-products (skimmed milk and whey) can contribute to its solution. Such products include milk protein concentrates (MPC), whey protein concentrates (WPC), milk protein isolates (MPI), whey protein isolates (WPI), native whey protein isolates (NWPI), etc. Ice cream manufacturers inevitably face problems with increasing the mass fraction of protein in the product, increasing the viscosity of the mixture and increasing the cost of products. Some problems are largely solved by reducing the mass fraction of milk solids-not-fat (MSNF) in ice cream. A change in the composition of the product is reflected in its consistency and structure. This is mainly due to the technological properties of proteins, such as interaction with water to form network structures, stabilization of emulsions and foams2,3. Complex interactions between water, fat, proteins and the air phase affect the physical, rheological and sensory properties of the product. New ingredients included in mixtures also affect the freezing behavior of the mixture and the storage stability of ice cream4.
Usually ice cream contains 7-11 % of MSNF and, accordingly, 2.3-4 % of protein. The quality of ice cream largely depends on the mass fraction of MSNF. A study5 noted that the determinants of ice cream texture performance were ice crystal size and uniformity6,7, glass transition temperature, and rheological properties of mixture8. Since proteins, through their water-holding capacity, influence the formation and size of ice crystals9,10 and the rheological properties of the ice cream mixture11-13, their addition to ice cream can affect the texture of the finished product. It is important to consider that during heat treatment (pasteurization), protein molecules unfold and new bonds are formed with water molecules, which contributes to an increase in viscosity14. Replacing 20 % and 50 % of MSNF in ice cream with MPC increased the viscosity of the mixture by increasing the dispersed particles, but there was no significant difference in the value of the viscosity index between samples using concentrates containing 56 % and 85 % of protein15. When using WPC, a decrease in surface tension at the fat-water interface was also noted, caused by an increased content of protein, as evidenced by an increase in viscosity16. When microparticulate whey protein was used, the hardness of the product increased, which was explained by the stronger structural network formed when β-lactoglobulin interacted with water17. The addition of WPI in the amount of 4 % at 10 % of MSNF in ice cream resulted in an increase in the viscosity of the mixture, a decrease in overrun and an increase in the hardness of the finished product2.
The use of NWPI in ice cream instead of MSNF had an impact not only on the texture of the finished product, but also on its overrun and air bubble stability18. There are different opinions about the correlation between overrun and ice cream texture indicators. A study19 indicates its absence, which is doubtful, and studies8,17 have established a relationship between hardness and overrun.
Replacing MSNF with WPC20 resulted in a decrease in the thermal stability of ice cream, while the effect of this concentrate on the texture of the product was not detected in the sensory evaluation. However, in an objective texture assessment11 when using WPC for the same purpose, a decrease in product hardness, stickiness and adhesion was noted, which could be due to changes in viscosity and overrun21,22. WPI added to ice cream reduced overrun and increased hardness23, similar changes occurred with milk concentrate24. The role of proteins in the formation of secondary shells of fat globules in an ice cream mixture25 is very important, however, researchers paid insufficient attention to the quality indicators of a product with a high mass fraction of fat when replacing MSNF with protein concentrates and isolates.
The purpose of this work was to determine the effect of WPC, MPC, MPI and NWPI on the consistency, structure and sensory properties of ice cream with a high mass fraction of milk fat of 12 % and not containing MSNF.
Materials and Methods
Materials
The following materials were used in the research. Dairy fat spreads, fat mass fraction of 72.5 % (OJSC Dairy plant “Penzensky”, Penza, Russia); white crystalline sugar (“Russian sugar”, Moscow, Russia); nonfat dry milk (Yugovsky Dairy Products Plant LLC, Perm, Russia); stabilizer-emulsifier Cremodan SE 334 VEG (DuPont Danisco Nutrition & Biosciences, France); maltodextrin Multydex 18 and dry glucose syrup Multydex 38 produced by LLC “KZ Gulkevichsky” (RP Krasnoselsky, Krasnodar, Russia).
Protein concentrates and isolates produced by Ingredia S.A. (Arras CEDEX France): Prodiet 87B Fluid milk protein isolate (at least 84 % of protein in dry matter), obtained by spray drying and enriched with micellar casein; milk protein concentrate MPC85 (ST) (protein in dry matter not less than 80 % of ratio of casein and whey protein 80/20 %) produced using ultrafiltration and spray drying methods; native whey protein isolate Prodiet 90S (protein in dry matter is not less than 85.5 %), obtained from cow’s milk whey by ultrafiltration and diafiltration. WPC 80 whey protein concentrate (not less than 80 %) produced by Mlekovita Group (Vysoké Mazovetsky, Poland) was obtained in the process of whey drying after removal of the non-protein component from pasteurized liquid whey.
Using these materials, the following ice cream samples were prepared for research (Table 1).
Table 1: The composition of ice cream samples
| Сomposition | Samplea | ||||
| Cs | MPIs | MPCs | NWPIs | WPCs | |
| Water, % | 63.6 | 63.6 | 63.6 | 63.6 | 63.6 |
| Fat, % | 12.0 | 12.0 | 12.0 | 12.0 | 12.0 |
| MSNF b, % | 10.0 | – | – | – | – |
| Sugar, % | 14.0 | 14.0 | 14.0 | 14.0 | 14.0 |
| Stabilizer, emulsifier, % | 0.4 | 0.4 | 0.4 | 0.4 | 0.4 |
| Maltodextrin, % | 3.0 | 3.0 | 3.0 | 3.0 | |
| Dry glucose syrup, % | 2.0 | 2.0 | 2.0 | 2.0 | |
| Milk protein isolate, % | 5.0 | ||||
| Whey protein concentrate, % | 5.0 | ||||
| Native milk protein isolate, % | 5.0 | ||||
| Milk protein concentrate, % | 5.0 | ||||
aCs – control sample with 10 % MSNF, MPIs – sample with milk protein isolate, MPCs – sample with milk protein concentrate, NWPIs – sample with native whey protein isolate, WPCs– sample with whey protein concentrate;
b MSNF milk solids-not-fat
Methods
Ice cream preparation
The process of ice cream manufacture using protein components included the following stages: mixing of raw materials and heating them to 45 °C, filtering the mixture at a temperature of at least 60 °C (filter with a mesh width of 1 mm), pasteurization of the mixture at a temperature of 78 °C with holding for 10 minutes in a long-term pasteurization bath (OSKON, Glazov, Russia), homogenization of the mixture at a temperature of 75 °C and a pressure of 12.0-14.0 MPa at the 1st stage, 3.0-5.0 MPa at the second stage (laboratory homogenizer APV SCHRÖDER GMBH, Germany), cooling mixture to 4 °C, ripening at 4 °C for 24 hours, freezing the mixture to ice cream temperature minus 5 °C (laboratory freezer Labo 8/12 E, CARPIGIANI, Italy), packaging ice cream in 150 ml polystyrene containers, hardening ice cream at temperature minus 30 °C for 3 days and subsequent storage at a temperature minus 18 °C.
Rheological study
The dynamic viscosity of ice cream mixtures was studied using a DV2+Pro rheoviscometer (BrookField, USA) with Rheocalc V3 1-1 software (BrookField, USA) and an SC4-31 spindle as described by Amador et al.26. The ice cream mixture was poured into a metal cylinder with a volume of 10 cm3, fixed, the spindle was immersed in it, and a temperature sensor was connected. The samples were measured in triplicate with an accuracy of ±1 % of the used range and a reproducibility of at least 0.2 % at a mixture temperature of 4.0±0.5 °C. To maintain the required temperature, a water bath (thermostat) was used with an error of ±0.5 °С. The dynamic viscosity of the samples was recorded at 10 rpm (0.16 s-1). For each sample, a graphical dependence of the shear stress on the shear rate and a mathematical dependence were obtained in accordance with the Herschel-Bulkley equation, based on which the values of the flow behavior (n) and the consistency coefficient (K) were determined.
Chemical and physical indicators
The titratable acidity, expressed as (%) lactic acid, was determined by titration using a 0.1 N NaOH solution and a phenolphthalein indicator.
Overrun was determined by weight method based on the mass of the same volume of mixture and ice cream according to the method described by Goff and Hartel27 according to the formula (1):

where M1 is the mass of the mixture, g; M2 is the mass of ice cream, g.
The cryoscopic temperature (Тf) was determined on an OSKR-1 cryoscope osmometer (KIVI Osmometriya, Russia). The glass transition temperature of the mixture (Тg) was determined on a NETZSCH DSC 204 F1 differential scanning calorimeter (NETZSCH-Geratebau GmbH, Germany).
Structural study
The study of structural elements consisted in determining the size of air bubbles and ice crystals, mathematical modeling of their distribution and calculation of average diameters with the modified procedures adapted from the methods described by Lomolino et al.9 and Goff et al.28. A CX41RF microscope (OLYMPUS, Japan) with a built-in camera and ImageScope M software (SMA, Moscow, Russia) were used.
To study the air phase, a small amount of the prepared sample was applied to a glass slide, covered with a coverslip, and placed on the microscope stage or cryostage. The studies were carried out at a microscope magnification of 100 times. 8-10 photographs were taken for each sample.
When studying ice crystals, a small amount of an ice cream sample was placed in alcohol and then on a cover glass with a cryostage at a temperature of -18 °C. The studies were carried out at a magnification of 100 times. 8-10 photographs were taken for each sample.
After processing the photographs with ImageScopeM, Excel 2010 (Microsoft Inc., Redmond, WA) and Mathcad V14.0 (PTC Inc, Boston, Massachusetts, USA) were used. To approximate the results obtained, construct distribution curves, calculate modes (Dm), medians (Dmed) and average values (DMe), the following formula (2) was used:
![]()
where D is the diameter; a, b are the coefficients of the equation.
Texture analysis of ice cream samples was performed on a CT3 Texture Analyzer (BrookField, USA) with TexturePro Lite v1.1 Bld 4 software (BrookField) with modified procedures adapted from the methods by Soukoulis et al.5. The TA28 sensor was used for the study. Ice cream samples were stored at -18 °C. They were placed on an object table at room temperature (20 °C), after which a program was launched, according to which the probe was immersed to a depth of 5 mm at a speed of 0.5 mm/s and a trigger point of 10 g. At least 5 measurements were carried out for each sample. The change in the load during the immersion of the sensor was recorded, after which the calculations were carried out. The fracture force (g), hardness (g), adhesive force (g), adhesiveness (gs) and rigidity (g) were determined.
Sensory evaluation
Sensory scores were determined by a panel of 6 certified tasters. Selection of panelists has been done according to ISO standards30. Taste and aroma (maximum score 6.0), structure and texture (maximum score 3.0), color and appearance (maximum score 1.0) were evaluated.
Statistical analysis
Statistical processing of the obtained results was performed using Past V4.03 (Øyvind Hammer, Norway) and Excel 2010 (Microsoft Inc., Redmond, WA). One-way ANOVA was used with Tukey’s multiple comparison to analyze results. A significance level of P < 0.05 was used.
Results and Discussion
Chemical and physical indicators
During experimental studies, the chemical and physical parameters of the above mixtures for ice cream were determined: titratable acidity, glass transition temperature and cryoscopic temperature (Table 2).
Table 2: Indicators of mixtures
| Indicators | Sample | ||||
| Cs | MPIs | MPCs | NWPIs | WPCs | |
| TA(% lactic acid) | 0.19±0.02 | 0.14±0.01 | 0.12±0.01 | 0.17±0.01 | 0.16±0.01 |
| Тf (°C) | -2.48 | -2.08 | -2.11 | -2.18 | -2.14 |
| Тg (°C) | -44 | -45 | -46 | -46 | -43 |
TA – titratable acidity, Тf – cryoscopic temperature; Тg – glass transition temperature of the mixture.
Significant differences were found in the titratable acidity of all samples with 100 % replacement of MSNF from the control Cs sample. The MPCs sample had the lowest value of this indicator. The replacement of MSNF with different protein components also led to an increase in the cryoscopic temperature by 0.3 °C. No significant differences were found between samples with MSNF replaced. The glass transition temperature is also similar in all ice cream samples studied.
When conducting rheological studies, significant differences (P<0.05) in the value of the “dynamic viscosity” indicators and the calculated indicators “consistency coefficient” and “flow behavior index” were found between the samples of Cs, NWPIs and WPCs (Table 3).
Table 3: Rheological properties of mixtures
| Sample | DV (mPa·s) | CI | FI |
| Cs | 1060±16 | 1380±25 | 0.6 |
| MPIs | 960±33 | 1340±9 | 0.7 |
| MPCs | 930±11 | 1000±5 | 0.7 |
| NWPIs | 2080±54 | 3990±13 | 0.4 |
| WPCs | 270±4 | 270±12 | 0.8 |
DV – dynamic viscosity, CI – consistency index, FI – flow index
The significance of the differences was confirmed by statistical ANOVA analysis, the results of which are presented in Table 4. A slight decrease in dynamic viscosity was found in the MPIs and MPCs samples compared to the Cs sample. A significant increase in the viscosity of the ice cream mix was found in the sample with NWPIs. In the WPCs sample, a sharp decrease in viscosity was found, compared with the control by 3.8 times. The dynamic viscosity between the MPIs, MPCs and Cs samples did not differ markedly.
Table 4: ANOVA for dynamic viscosity
| Compared samples | P |
| Cs – MPIs | 1.8×10⁻² |
| Cs – MPCs | 7.1×10⁻⁴ |
| Cs – NWPIs | 1.7×10⁻⁶ |
| Cs – WPCs | 2.8×10⁻⁷ |
| MPIs – MPCs | 0.311 |
| MPIs – NWPIs | 2.1×10⁻⁶ |
| MPIs – WPCs | 8.4×10⁻⁶ |
| MPCs – NWPIs | 1.2×10⁻⁶ |
| MPCs – WPCs | 1.5×10⁻⁷ |
|
NWPIs – WPCs |
3.2×10⁻⁷ |
The decrease in titratable acidity of MSNF -free samples can be explained by the different composition of proteins and the decrease and difference in mineral salts and free acids in protein concentrates. In addition, the acidity value could be affected by the method of production of protein concentrates and isolates and their amino acid composition. This is supported by the fact that samples with MPI and MPC were characterized by lower titratable acidity than samples with whey proteins. The results of this study found to be opposite to the analysis conducted by El-Zeini et al.11and Mostafavi et al.15 thus confirming the influence of chemical composition. Samples in these studies contained MSNF; its replacement for proteins was partial. The findings of decrease of freezing point correlate with the data obtained by Moschopoulou et al.22, Patel et al.30 and El-Zeini et al.11. As in the case of titratable acidity, the decrease in cryoscopic temperature is associated with a decrease in the content of mineral salts and the absence of the low molecular weight nutrient lactose.
Differences in the viscosity of the mixtures are associated with the peculiarities of the structures of the molecules of milk and whey proteins in concentrates and isolates and their different water-binding capacity. The NWPIs sample was characterized by the highest viscosity, which indicates its high water-binding capacity, as a result of which the use in an amount of 5 % leads to an unacceptable loss of mixture fluidity for production conditions. The highest viscosity of NWPIs correlates with the data of study of its properties got by Heino et al.31. Mention of the usage of NWPI in ice cream was not found.
The lowest viscosity of the WPC sample is due to the low water-binding capacity of whey proteins compared to casein. The results got by Goff et al. correspond our data of decrease of viscosity at using WPC instead of MSNF32.
Overrun
Significant differences were found in the overrun of ice cream samples obtained under conditions of unregulated air supply to the freezer (Figure 1). In various studies, protein components were added to MSNF, or partially replaced it. The values of overrun at use MPC match the values obtained by Alvarez et al.15. The replacing of NFDM to 20% of MPC increased the overrun; the overrun at 50% replacement was lower than at 20%. The results obtained by Moschopoulou et al.22 correspond our data at using WPC. The difference between WPCs and NWPIs correlated with results of study by Heino et al.31, although the properties of proteins in this manuscript were compared not in the ice cream.
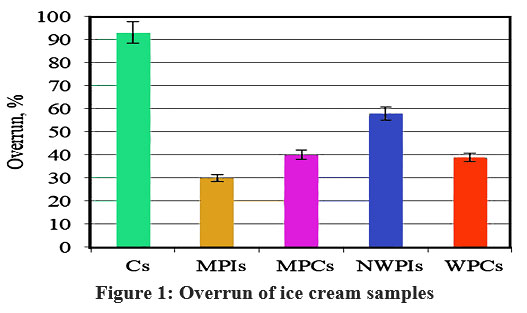 |
Figure 1: Overrun of ice cream samples |
The control sample Cs had the highest overrun in comparison with the rest of the samples. The MPIs sample had the least overrun compared to the Cs. In the MSNF -replaced samples, the NWPIs sample had the highest overrun. There was no difference in overrun between MPCs and WPCs. The lower ability of the mixture to saturate with air in samples with the replacement of MSNF with concentrates and isolates of milk and whey proteins indicates the formation of a dense protein-lipid shell on the fat globules, which does not collapse under thermomechanical action in the freezer, which prevents the demulsification and agglomeration of the fat phase, which is necessary to stabilize the air phase. To a large extent, the stability of the shells is due to the low desorption capacity of protein concentrates and isolates from the shells of fat globules.
Dispersion of structural elements
Studies have shown that the use of concentrates and isolates in ice cream has a different effect on the size of ice crystals. Table 5 and Figure 2 show the results of approximation of the obtained data by formula (2) and the values of the sizes characterizing their distribution. The submitted results differed from Patel et al.30, because the draw temperature was high. The reasons of the difference in the sizes of ice crystals and air bubbles in the manuscripts may be related to the different composition of the samples and the time of freezing.
Table 5: Parameters of ice crystals
| Sample | Dmean (µm) | Dm (µm) | Dmed (µm) | a | b· | R2 |
| Cs | 29±8 | 22 | 28 | 3.77 | 0.13 | 0.84 |
| MPIs | 27±9 | 22 | 26 | 3.76 | 0.14 | 0.94 |
| MPCs | 32±12 | 28 | 31 | 3.63 | 0.12 | 0.94 |
| NWPIs | 27±7 | 25 | 26 | 3.80 | 0.14 | 0.86 |
| WPCs | 32±11 | 35 | 31 | 3.64 | 0.12 | 0.93 |
Dmean – mean size, Dm – mode, Dmed – median, a,b – coefficients of equation (2), R2 – coefficient of determination
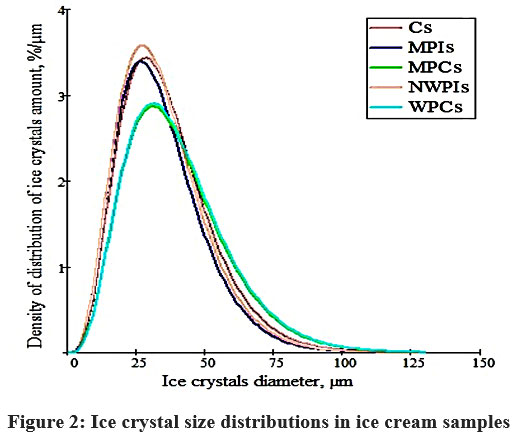 |
Figure 2: Ice crystal size distributions in ice cream samples. |
The existence of significant differences in the size of ice crystals of ice cream samples in relation to the control sample (Cs) was determined, which are illustrated by the results of ANOVA in Table 6. At the same time, a significant difference between the sizes of ice crystals in samples with isolates (MPIs and NWPIs) and in samples with concentrates (WPCs and MPCs) was not observed.
Table 6: ANOVA for mean size of ice crystals
| Compared samples | P |
| Cs – MPIs | 1.2×10⁻⁴ |
| Cs – MPCs | 1.0×10⁻⁹ |
| Cs – NWPIs | 3.7×10⁻⁵ |
| Cs – WPCs | 1.2×10⁻⁸ |
| MPIs – MPCs | 1.0×10⁻¹⁸ |
| MPIs – NWPIs | 0.761 |
| MPIs – WPCs | 1.3×10⁻¹⁵ |
| MPCs – NWPIs | 2.9×10⁻²¹ |
| MPCs – WPCs | 0.554 |
| NWPIs – WPCs | 1.5×10⁻¹⁸ |
An analysis of the sizes of ice crystals by their distribution functions indicates the highest dispersion of ice crystals in the NWPIs sample. Considerably, in this indicator, the MPIs sample approaches the NWPIs sample, and both of them are close to or somewhat better than the Cs control sample.
Studies of the microstructure of ice cream samples also made it possible to reveal differences in the size distribution of air bubbles in ice cream when using protein concentrates and isolates in them. It was obtained numerical values for the air bubble size distribution characteristics (Table 7).
Table 7: Parameters of air bubbles
| Sample | Dmean (µm) | Dm (µm) | Dmed (µm) | a | b | R2 |
| Cs | 32±13 | 28 | 28 | 3.65 | 0.12 | 0.93 |
| MPIs | 32±15 | 22 | 29 | 3.62 | 0.13 | 0.98 |
| MPCs | 35±17 | 26 | 32 | 3.56 | 0.12 | 0.98 |
| NWPIs | 38±16 | 28 | 34 | 3.45 | 0.10 | 0.97 |
| WPCs | 35±20 | 27 | 30 | 3.54 | 0.12 | 0.98 |
Dmean – mean size, Dm – mode, Dmed – median, a,b – coefficients of equation (2), R2 – coefficient of determination
Here are the results of approximation of the obtained data by formula (2) and their graphical representation (Figure 3).
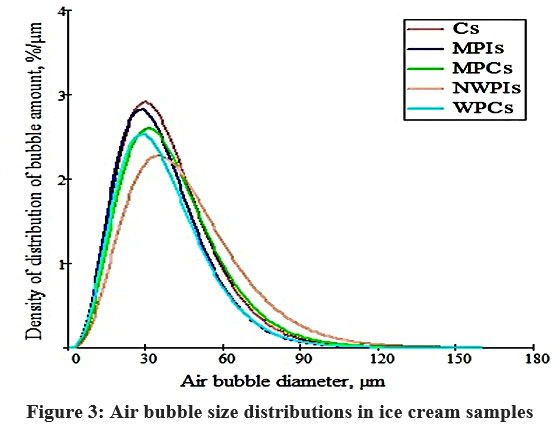 |
Figure 3: Air bubble size distributions in ice cream samples |
Significant differences in air bubble size between Cs and NWPIs and MPIs and NWPIs were found to exist, as illustrated by the ANOVA results in Table 8.
Table 8: ANOVA for the mean size of air bubbles
| Compared samples | P |
| Cs – MPIs | 0.999 |
| Cs – MPCs | 0.161 |
| Cs – NWPIs | 2.0×10⁻⁶ |
| Cs – WPCs | 0.089 |
| MPIs – MPCs | 0.284 |
| MPIs – NWPIs | 4.6×10⁻⁵ |
| MPIs – WPCs | 0.204 |
| MPCs – NWPIs | 0.188 |
| MPCs – WPCs | 0.999 |
| NWPIs – WPCs | 0.085 |
The obtained differences in the sizes of ice crystals with protein isolates and concentrates are probably due to differences in their molecular mass and, as a result, the number of contacts of active protein radicals with water molecules, which affects the mobility of molecules, and during freezing, the number of water crystallization centers. The different dispersity of the air phase of the samples obtained under conditions of unregulated air supply to the freezer is largely due to their different overrun, as well as the viscosity of the mixture. The sample with MPI (with the least overrun) corresponded to the control sample to the greatest degree in terms of the dispersion of the air phase, and to the least degree – with NWPI (the highest viscosity).
Textural analysis
It was found that the replacement of MSNF in ice cream with concentrates and isolates of milk and whey proteins leads to significant changes in the indicators characterizing the texture (Table 9). The obtained data about using MPC in ice cream correlate with results got by Roy et al.33. The results of using WPC are opposite to the results got by El-Zeini et al.34. The diistinction of values can be explained by the difference of the overruns of the samples.
Table 9: Textural analysis
| Sample | Fracture force (g) | Hardness (g) | Adhesive force (g) | Adhesiveness (gs) | Rigidity (g) |
| Cs | 21±17 | 680±80 | -38±6 | -110±27 | 250±35 |
| MPIs | 95±34 | 2140±130 | -120±14 | -620±86 | 980±290 |
| MPCs | 77±54 | 2000±200 | -75±17 | -280±93 | 930±240 |
| NWPIs | 27±34 | 890±81 | -47±9 | -160±33 | 300±110 |
| WPCs | 52±30 | 680±77 | -33±7 | -82±36 | 280±72 |
The significance of differences is determined by the results of the ANOVA analysis, shown in Table 10.
A significant difference was found in the hardness of MPCs, MPIs and NWPIs compared to the Cs control. The hardness of the MPCs and MPIs samples did not differ significantly, but its value in these samples was more than 2 times higher compared to the Cs sample. The hardness of the NWPIs sample is 30% higher than that of the control one.
Table 10: ANOVA for textural analysis
| Compared samples | Fracture force (g) | Hardness (g) | Adhesive force (g) | Adhesiveness (gs) | Rigidity (g) |
| Cs – MPIs | 3.5×10⁻³ | 9.5×10⁻¹⁰ | 6.9×10⁻⁸ | 1.8×10⁻⁸ | 4.7×10⁻⁵ |
| Cs – MPCs | 4.1×10⁻² | 4.3×10⁻⁹ | 5.0×10⁻⁴ | 3.9×10⁻⁴ | 2.7×10⁻⁵ |
| Cs – NWPIs | 0.722 | 5.6×10⁻³ | 6.9×10⁻² | 4.8×10⁻³ | 0.353 |
| Cs – WPCs | 6.0×10⁻² | 0.896 | 0.139 | 0.126 | 0.374 |
| MPIs – MPCs | 0.661 | 0.310 | 3.2×10⁻³ | 3.5×10⁻⁵ | 0.760 |
| MPIs – NWPIs | 5.5×10⁻² | 4.3×10⁻⁹ | 6.9×10⁻⁷ | 1.7×10⁻⁸ | 1.2×10⁻⁴ |
| MPIs – WPCs | 0.129 | 8.0×10⁻¹⁰ | 2.2×10⁻⁷ | 8.8×10⁻⁸ | 2.3×10⁻⁴ |
| MPCs – NWPIs | 0.157 | 7.1×10⁻⁹ | 5.0×10⁻³ | 5.5×10⁻³ | 5.6×10⁻⁵ |
| MPCs – WPCs | 0.402 | 3.9×10⁻⁹ | 3.3×10⁻⁴ | 2.4×10⁻⁴ | 1.3×10⁻⁴ |
| NWPIs – WPCs | 0.281 | 4.5×10⁻³ | 1.2×10⁻² | 6.3×10⁻⁴ | 0.738 |
The value of the “adhesive force” indicator, due to the intermolecular interaction of the surfaces of the product and the measuring device, was characterized by the highest value in the samples of Cs and WPCs. Compared with the Cs sample, the WPCs and NWPIs samples showed similar adhesive strength values. The samples of MPCs and MPIs showed lower adhesive force values.
Significant differences were found in the stiffness of the MPCs and MPIs ice cream samples relative to the Cs sample. The Cs, NWPIs, and WPCs samples were not significantly distinct from each other. In turn, the samples of MPCs and MPIs were similar in terms of stiffness. The stickiness index had significant differences in the MPCs, MPIs and NWPIs samples relative to the control sample. There were no significant differences in this parameter between Cs and WPCs samples. When evaluating the breaking force, a significant difference was found between the Cs sample and the MPCs and MPIs samples. At the same time, no significant differences were found between the samples of WPCs, MPCs, MPIs, and NWPIs.
In all samples, compared with the control, a stronger consistency and structure was formed. The breaking force, hardness, adhesive force, stickiness and stiffness have increased. This is due to the achievement of a higher mass fraction of protein in the product (5 % in the NWPIs, MPCs, and MPIs samples and 3.4% in the Cs control sample), an important function of which is the formation of strong structures upon interaction with water. A particularly noticeable strengthening of the structure occurred in samples with MPC and MPI containing the active structure former casein.
Sensory evaluation
Table 11 provides the results of the sensory assessment of all ice cream samples. The structure and consistency of the sample with WPC received the highest rating – 2.8 points out of 3.0 possible. Samples with MPI and NWPI had a dense consistency, which correlates with the results of determining the hardness, samples with MPC and WPC were creamy, which correlates with overrun values (higher than that of the sample with MPI). It was found that the milky taste characteristic of ice cream was felt in MPC and WPC samples.
Table 11: Sensory indicators of ice cream
| Indicators | Sample | |||||
| Cs | MPIs | MPCs | NWPIs | WPCs | ||
| Taste and aroma | 5.6±0.1 | 5.4±0.1 | 5.6±0.1 | 5.6±0.1 | 5.7±0.1 | |
| Structure and consistency | 2.6±0.1 | 2.7±0.1 | 2.6±0.1 | 2.6±0.1 | 2.8±0.1 | |
| Color and appearance | 1.0 | 1.0 | 1.0 | 1.0 | 1.0 | |
Structure in all samples without perceptible ice crystals. Sensory assessment of the state of the structure and consistency did not reveal noticeable differences between the control sample and samples with isolate concentrates and protein concentrates, which correlates with instrumental studies of texture indicators. However, the WPC ice cream sample received the highest rating.
Conclusions
The use of concentrates and isolates leads to a decrease in titratable acidity and the ability of the mixture to saturate with air (overrun) and an increase in cryoscopic temperature. The glass transition temperature in the samples did not differ significantly. In terms of the dispersion of ice crystals, the samples with isolates (NWPI and MPI) did not differ largely from the control sample, and the samples with protein concentrates (MPC and WPC) were noticeably inferior to it in this indicator. The sample with MPI corresponded to the control sample to the greatest extent in terms of dispersion of the air phase, and to the least degree, to the sample with NWPI. According to this indicator, samples with concentrates (MPC and WPC) were noticeably inferior to the control, but did not differ from each other. Compared to the control sample, there was a significant increase in hardness, adhesive strength and stiffness in samples with MPC and MPI. When sensory assessed in samples with MPI and NWPI, a dense consistency was noted, which correlates with the results of determining the hardness, samples with MPC and WPC had a creamy consistency. Sensory perceptible ice crystals were not found in all samples.
According to our results, replacing milk solids-not-fat with milk and whey protein concentrates and isolates may be an effective way to increase protein content in ice cream to improve its functional properties while maintaining or improving its sensory properties.
Acknowledgement
The authors disclosed receipt of the following financial support for the research, authorship, and/or publication of this article: This work was carried out within the framework as part of the research topic foundation for scientific research, No. 075–01190–22–00 of the state assignment of the V. M. Gorbatov Federal Research Center for Food Systems, grant No. 0585–2019–0043-С-01 and as part of the research under the state assignment grant No. FNEN-2019-0010.
Conflict of Interest
The authors declared no potential conflicts of interest with respect to the research, authorship, and/or publication of this article.
References
- Webb F. C. Ice Cream. International Journal of Dairy Technology. 1948;2(1):27–37.
CrossRef - Akalın A. S., Karagözlü C., Ünal G. Rheological properties of reduced-fat and low-fat ice cream containing whey protein isolate and inulin. European Food Research and Technology. 2008;227:889-895.
CrossRef - Suthar J., Jana A., Balakrishnan S. High Protein Milk Ingredients – A Tool for Value-Addition to Dairy and Food Products. Journal of Dairy, Veterinary & Animal Research. 2017;6(1):259-265.
CrossRef - Mehditabar H., Razavi S. M. A., Javidi F. Influence of pumpkin puree and guar gum on the bioactive, rheological, thermal and sensory properties of ice cream. International Journal of Dairy Technology. 2020;73(2):447-458.
CrossRef - Soukoulis C., Rontogianni E., Tzia C. Contribution of thermal, rheological and physical measurements to the determination of sensorially perceived quality of ice cream containing bulk sweeteners. Journal of Food Engineering. 2010;100:634-641.
CrossRef - Pintor A., Severiano-Pérez P., Totosaus A. Optimization of fat-reduced ice cream formulation employing inulin as fat replacer via response surface methodology. Food Science and Technology International. 2014;20(7):489–500.
CrossRef - Aime D. B., Arntfield S. D., Malcolmson L. J., Ryland D. Textural analysis of fat reduced vanilla ice cream products. Food Research International. 2001;34:237-246.
CrossRef
- Muse M., Hartel R. W. Ice cream structural elements that affect melting rate and hardness. Journal of Dairy Science. 2004;87(1):1-10.
CrossRef - Lomolino G., Zannoni S., Zabara A., Da Lio M., De Iseppi A. Ice recrystallisation and melting in ice cream with different proteins levels and subjected to thermal fluctuation. International Dairy Journal. 2020;100:104557.
CrossRef - Tomer V., Kumar A. Development of High Protein Ice-Cream Using Milk Protein Concentrate. IOSR Journal of Environmental Science. Toxicology and Food Technology. 2013;6:71-74.
CrossRef - El-Zeini Hoda M., Moneir El-Abd M., Mostafa A. Z., Yasser El-Ghany F. H. Effect of Incorporating Whey Protein Concentrate on Chemical, Rheological and Textural Properties of Ice Cream. Journal of Food Processing and Technology. 2016;7(2):1-7.
CrossRef - Atallah A. A., Morsy O. M., Gemiel D. G. Characterization of functional low-fat yogurt enriched with whey protein concentrate, Ca-caseinate and spirulina. International Journal of Food Properties. 2020;23:1678-1691.
CrossRef - Orrego M., Troncoso E., Zúñiga R. N. Aerated whey protein gels as new food matrices: Effect of thermal treatment over microstructure and textural properties. Journal of Food Engineering. 2015;163:37-44.
CrossRef - Melnikova E. I., Stanislavskaya E. B., Fedorova A. R. Modification of the whey protein cluster for the utilization in low-calorie food technology. Paper presented at International Conference on Production and Processing of Agricultural Raw Materials; 26-29 February 2020; Voronezh, Russian Federation.
CrossRef - Alvarez V. B., Wolters C.L., Vodovotz Y., Ji T. Physical properties of ice cream containing milk protein concentrates. Journal of Dairy Science. 2005;88(3):862–871.
CrossRef - Mostafavi F. S., Tehrani M. M., Mohebbi M. Rheological and sensory properties of fat reduced vanilla ice creams containing milk protein concentrate (MPC). Journal of Food Measurement and Characterization. 2016;11:567-575.
CrossRef - Hossain M. K., Petrov M., Hensel O., Diakité M. Microstructure and Physicochemical Properties of Light Ice Cream: Effects of Extruded Microparticulated Whey Proteins and Process Design. Foods. 2021;10(6):1433.
CrossRef - Puangmanee S., Hayakawa S., Sun Y., Ogawa M. Application of Whey Protein Isolate Glycated with Rare Sugars to Ice Cream. Food Science and Technology Research. 2008;14:457-457.
CrossRef - Milliatti M. C., Lannes S. C. Impact of stabilizers on the rheological properties of ice creams. Food Science and Technology. 2018;38(4):733–739.
CrossRef - Pandiyan C., Kumaresan G. D., Villi R. A., Rajarajan G. Incorporation of whey protein concentrate in ice cream. International Journal of Chemical Sciences. 2010;8(5):563-567.
- Królczyk J. B., Dawidziuk T., Janiszewska-Turak E., Sołowiej B. Use of Whey and Whey Preparations in the Food Industry – a Review. Polish Journal of Food and Nutrition Sciences. 2016;66(3):157-165.
CrossRef - Moschopoulou E., Dernikos D., Zoidou E. Ovine ice cream made with addition of whey protein concentrates of ovine-caprine origin. International Dairy Journal. 2021;122:105146.
CrossRef - Danesh E., Goudarzi M., Jooyandeh H. Short communication: Effect of whey protein addition and transglutaminase treatment on the physical and sensory properties of reduced-fat ice cream. Journal of Dairy Science. 2017;100(7):5206-5211.
CrossRef - Camelo-Silva C., Barros E. L., Canella M. H., Verruck S., Prestes A. A., Vargas M. O., Maran B. M., Esmerino E. A., Silva R., Balthazar C. F., Calado V., Prudêncio E. S. Application of skimmed milk freeze concentrated in production of ice cream: physical, chemical, structural and rheological properties. Food Science and Technology International. 2022:42.
CrossRef - Shobanova T. V., Tvorogova A. A. Influence of fat phase on technologically important indicators of ice cream plombir without emulsifiers. Food systems. 2018;1(2):4-11.
CrossRef - Amador J., Hartel R. W., Rankin S. The effects of fat structures and ice cream mix viscosity on physical and sensory properties of ice cream. Journal of Food Science. 2017;82(8): 1851–1860.
CrossRef - Goff H. D., Hartel R. W. Ice Cream. Boston, MA: Springer; 2013.
CrossRef - Goff H.D., Verespej E., Smith A.K. A study of fat and air structures in ice cream. International Dairy Journal. 1999;9:817-829.
CrossRef - ISO. Sensory analysis — General guidelines for the selection, training and monitoring of selected assessors and expert sensory assessors. Standard No. 8586:2012, Geneva, Switzerland.
- Patel M.R., Baer R.J., Acharya M.R. Increasing the protein content of ice cream. Journal of dairy science. 2006;89(5):1400-6 .
CrossRef - Heino A., Uusi-Rauva J., Rantamäki P., Tossavainen O. Functional properties of native and cheese whey protein concentrate powders. International Journal of Dairy Technology. 2007;60:277-285.
CrossRef - Goff H.D., Kinsella J.E., Jordan W.K. Influence of Various Milk Protein Isolates on Ice Cream Emulsion Stability. Journal of Dairy Science. 1989;72:385-397.
CrossRef - Roy S., Hussain S.A., Prasad W.G., Khetra Y. Quality attributes of high protein ice cream prepared by incorporation of whey protein isolate. Applied Food Research. 2021;2:100029.
CrossRef - El-Zeini H.M., Ali A.R., Awad R.A., El-Ghany Y.F. Texture evaluation of whey protein concentrate incorporated ice cream by Back Extrusion technique. International Journal of Environment, Agriculture and Biotechnology. 2018;3:6-13.
CrossRef
Accepted on: 07 March 2023
Second Review by: Parameshwari S. India
Final Approval by: Prof. Jiwan S. Sidhu


Web of Science Coverage
Emerging Sources Citation Index (ESCI)
2024 Journal Impact Factor: 1.1
Scopus Journal Metrics
CiteScore 2025: 2.6
CiteScore Details
Sustainable Nutrition: Food Systems, Nutrient Retention, and Public Health Impact
![]()
This journal is a member of, and subscribes to the principles of, the Committee on Publication Ethics (COPE)


