Effect of Health-Related Behavior and Nutrition Intake on the Blood Lipids Levels
Joo-Eun Lee*
Department of Food and Nutrition, Seowon University. Cheongju City, South Korea.
Corresponding Author E-mail: joody88@hanmail.net
DOI : http://dx.doi.org/10.12944/CRNFSJ.11.1.15
Download this article as:
![]()
Preventing hyperlipidemia remains of critical importance as one of the main risk factors for cardiovascular disease, which is the leading cause of death every year. Therefore, the present study investigated the effect of health-related behavior and nutritional intake on blood lipid levels in adult men and women. Survey data from the 2019 National Health and Nutrition Examination conducted by the Korea Disease Control and Prevention Agency on 6,606 adults were analyzed to evaluate the effect of drinking, smoking, exercise, and nutrient intake on blood cholesterol, triglyceride, and HDL cholesterol. Blood total cholesterol showed significant differences in the mean based on the level of drinking, and blood HDL-cholesterol and triglyceride showed significant differences in the mean levels of drinking, smoking, and exercise. In regression analysis, blood total cholesterol was significantly affected by body mass index (BMI), education level, and menopause. Blood HDL-cholesterol was significantly affected by BMI, menopause, drinking, smoking, exercise, dietary intake of omega-3 fatty acids, and dietary cholesterol, and blood triglyceride level was significantly affected by BMI, menopause, smoking, and exercise. Obesity, exercise, eating habits, smoking, and women's menopause were the main factors contributing to hyperlipidemia, so awareness of these factors should be raised.
KEYWORDS:BMI; Exercise; Hyperlipidemia; Nutritional intake; Smoking;
Introduction
According to the World Health Organization (WHO), ischemic heart disease, known as one of the cardiovascular diseases, is the most common cause of death worldwide, followed by stroke. In particular, global statistics show an unprecedented increase in the number of people who died of ischemic heart disease in the past 20 years, and this increasing trend is likely to continue.1,2 Among the many risk factors for cardiovascular diseases are intrinsic factors, such as sex, age, race, and genetics; disease factors, such as obesity, high blood pressure, and dyslipidemia; and lifestyle factors, particularly eating, drinking, smoking, and exercise habits.3,4 Hyperlipidemia is dyslipidemia characterized by a marked increase in triglyceride (TG), total cholesterol (TC), and low-density lipoprotein cholesterol (LDL-C) and a marked decrease in high-density lipoprotein cholesterol (HDL-C) in the blood.4 Coupled with a rapidly aging demographic in Korea, the annual prevalence of Korean adults diagnosed with dyslipidemia, such as high cholesterol and hypertriglyceridemia, is increasing due to an increase in the westernized eating pattern and changes in living conditions. Between 2002 and 2018, hypertriglyceridemia diagnoses increased nearly eight-fold, from 1.5 million to 11.6 million.5
Studies have shown that the risk factors for hyperlipidemia are differentially associated with the situation of each country and region, the level of treatment, and the level of perception of diseases.5,6 In particular, consistent management of hyperlipidemia risk factors was critical to lessen the risk’s effect.6 Age, sex, occupation, education level, living environment, overweight, smoking, and diseases, such as obesity, high blood pressure, and diabetes, have been identified as risk factors for dyslipidemia. In middle-aged men, it was shown that older age, and higher levels of smoking or drinking, overweight or obesity, and hypertension or diabetes, increased the prevalence of dyslipidemia or its correlation.7,8 In addition, women were also affected by menopausal status; women in menopause tended to have worse blood lipid profiles than women not in menopause.8,9
Abnormal lipidemia can be improved through dietary intervention and nutrition adjustment to improve weight control or blood lipids.10-12 Guidelines for preventing cardiovascular disease and improving blood lipids suggest nutrition management by following food intake recommendations, such as consuming fruits, vegetables, fish, and whole grains, increasing unsaturated fat instead of saturated fat, and reducing cholesterol, salt, and sweeteners, besides lifestyle improvements, such as nonsmoking, moderate drinking, and regular exercise.3,13 Similarly, aerobic exercise, smoking cessation, and stress management have been shown to improve blood lipids and reduce the risk of heart disease.14-16 This study aims to prepare basic data for the prevention of risk factors as possible major causes of cardiovascular disease by investigating the effect of health behavior and nutritional intake on the blood lipids of adults. Data for this study were obtained from the 2019 Korean National Health and Nutrition Examination Survey (KNHANES) conducted annually by the Korea Disease Control and Prevention Agency (KDCA).
Materials and Methods
Study purpose and participants
The study was conducted to determine how blood TC, HDL-C, and TG levels in adults are affected by health-related behaviors, such as exercise, smoking, drinking, and nutrition intake. Of the 8,110 people who participated in the 2019 KNHANES, 6,606 adults were selected as participants, excluding those who were missing in the survey and those who were not adults.
Research data and ethics approval
The data used in this study were selected from the original data of the 2019 KNHANES to meet the study purpose. The original data were downloaded from the KDCA website (http://www.kdca.go.kr) after authenticating the real name of the researcher and stating the purpose of the study. The 2019 KNHANES was conducted with approval from the KDCA’s Research Ethics Review Committee (approval number: 2018-01-03-C-A), and all participants prepared consent forms under the National Health Promotion Act. The present study was carried out after obtaining research approval from the bioethics review committee of the university affiliated with the researcher (1040820-202111-HR-005-02).
Survey design and contents
The KNHANES consists of a health survey, a nutrition survey, and a health examination survey based on Article 16 of the National Health Promotion Act in Korea. The health survey includes a household survey, a health interview survey, and a health behavior survey. The household survey collects information on the number of household members, household type, and household income. The health interview survey investigates several factors, such as medication use and activity restrictions, as well as education, economic, and physical activities. The health behavior survey (self-entry survey) investigates smoking, drinking, mental health, safety awareness, and gum and teeth health. The nutrition survey examines the current status of dietary behavior, dietary supplements and nutritional knowledge, and the contents of food intake (24-h recall method) 1 day before the survey. The health examination survey consists of body measurements, blood pressure and pulse measurements, blood and urine tests, and gum and teeth health tests.
Among the original data of the KDCA, sex, age, weight, height, and education were classified as demographic characteristics, and drinking, smoking, and exercise were classified as health-related behaviors in this study. A composite sample analysis method reflecting stratification variables, cluster variables, and weights was applied to ensure the representation and effectiveness of stratification sampling in KNHANES.17 A composite sample frequency analysis was conducted on the demographic characteristics and health-related behaviors, and body mass index (BMI) was obtained by height and weight. Based on data for Asians,18,19 BMI was classified as less than 18.5 for underweight, 18.5-22.9 for normal, 23-24.9 for overweight, and 25 or more for overweight.
In the health-related behaviors, an exercise was explained as physical activity causing slight shortness of breath or beating slightly faster for more than 10 min, where physical activity included examples of medium-intensity sports, exercise, and leisure activities, such as fast walking, light running (jogging), weight training (anaerobic exercise), golf, dance sports, and Pilates. Among the health examination data, blood lipid concentrations (TC, TG, and HDL-C) were used for this study. In the 2019 KNHANES, blood was collected after 8 h on an empty stomach and measured using an enzyme method. It was also analyzed using a Hitachi Automatic Analyzer 7600 (Hitachi, Tokyo, Japan). Regarding the nutrition intake, the data on the intakes of total calories, carbohydrates, proteins, fats, saturated fats, unsaturated fats, omega-3 fatty acids, and omega-6 fatty acids were selected for analysis from the nutrition survey results of the 24-h recall method a day before the survey (Figure 1).
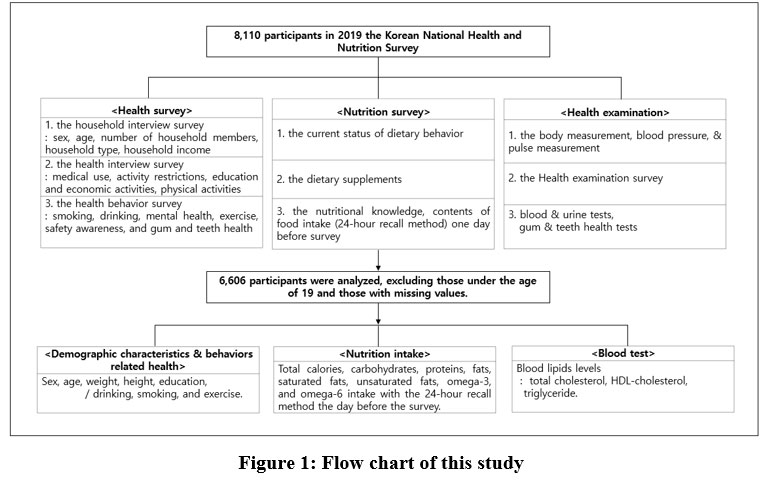 |
Figure 1: Flow chart of this study |
Data Analysis
The Statistical Package of Social Science (SPSS) software; version 18.0. for Windows was used to perform the statistical analysis. A frequency analysis was conducted on demographic characteristics and health-related behaviors. ANOVA analysis was conducted to determine whether there was a difference in the mean values between demographic characteristics and health-related behaviors for blood lipid concentrations (TC, TG, and HDL-C). It was also used to see if there is a difference in average intake between total calories consumed during the day and the amounts of carbohydrate, protein, fat, saturated fat, unsaturated fat, omega-3 fatty acids, and omega-6 fatty acids according to the classification criteria of TC, TG, and HDL-C in the blood. BMI, education, drinking, smoking, exercise, and nutrients were used as independent variables to perform the binary logistic regression analysis, and blood lipid concentrations were divided into undesirable and desirable levels (0 and 1, respectively) according to major guidelines.3.20.21
Results
Blood Lipid Concentration According to Demographic Characteristics
Table 1 compares the average blood lipid concentrations according to the demographic characteristics of the 6,606 participants. There were 2,956 men (44.7%) and 3,650 women (55.3%) aged over 20. The age distribution of each age group between 20 and 60 years ranged from 12.3 to 18.8%, and the group of participants aged 70 and above comprised 18.1% of the participants. Of the participants, 38.8% were categorized with a normal BMI (18.5-23), 35.1% with obesity (BMI > 25), 22.4% with overweight (BMI 23-25), and 3.7% with underweight (BMI < 18.5).18,19 In terms of educational background, the largest proportion (3,263, 49.4%) had graduated from junior college or higher, followed by those who had graduated from high school (1,725, 26.1%).
Comparing the mean blood lipid concentrations according to demographic characteristics, the mean concentrations of TC, HDL-C, and TG differed significantly according to men’s and women’s ages, BMI, and educational background (P < 0.01, P < 0.001).
Table 1: Level of lipid in blood according to demographic characteristics.
| Characteristics | N (%) | Total cholesterol1) | HDL-cholesterol1) | Triglycerides1) | |
| Sex | Male | 2,956(44.7) | 194.82±37.7962) | 48.78±11.644 | 153.48±122.161 |
| Female | 3,650(55.3) | 190.15±38.115 | 55.95±12.884 | 114.32±74.578 | |
| P-value | 0.000*** | 0.000*** | 0.000*** | ||
| Age | 20-29 | 813(12.3) | 181.65a±31.537 | 55.66d±12.827 | 99.11a±70.478 |
| 30-39 | 985(14.9) | 194.96bc±34.393 | 54.27cd±13.232 | 126.71b±96.561 | |
| 40-49 | 1,182(17.9) | 200.25cd±35.223 | 54.01cd±13.168 | 140.48bc±120.245 | |
| 50-59 | 1,245(18.8) | 205.24d±39.117 | 53.19bc±13.076 | 145.61c±116.041 | |
| 60-69 | 1,186(18.0) | 190.43b±39.925 | 51.52b±11.813 | 137.96bc±96.015 | |
| >70 | 1,195(18.1) | 180.10a±38.195 | 49.15a±12.068 | 128.14b±78.497 | |
| P-value | 0.000*** | 0.000*** | 0.000*** | ||
| BMI | <18.5 | 245(3.7) | 181.19a±35.798 | 61.39d±13.217 | 83.62a±63.880 |
| 18.5≤-<23 | 2,563(38.8) | 190.74b±35.821 | 56.63c±13.179 | 106.60b±76.701 | |
| 23≤-<25 | 1,479(22.4) | 194.63b±39.860 | 51.49b±12.259 | 138.65c±99.878 | |
| ≥25 | 2,319(35.1) | 195.16b±38.777 | 48.42a±11.079 | 161.07d±118.587 | |
| P-value | 0.000*** | 0.0000*** | 0.000*** | ||
| Education level | ≤ Middle school | 1,618(24.5) | 186.18a±40.531 | 50.56a±12.389 | 135.54b±96.823 |
| High school | 1,725(26.1) | 194.73b±38.321 | 52.83b±12.673 | 136.79b±98.780 | |
| ≥ College | 3,263(49.4) | 194.93b±36.145 | 53.82b±13.036 | 127.12a±102.974 | |
| P-value | 0.000*** | 0.000*** | 0.001** | ||
| Total | 6,606(100.0) | 192.75±38.006 | 52.77±12.851 | 131.72±100.493 | |
1)mg/dl, 2)Mean±S.D. **P<0.01, ***P<0.001.
Blood Lipid Concentration According to Health-related Behavior
Table 2 shows the average blood lipid concentrations according to the health-related behavior of the participants to allow direct comparisons. In terms of alcohol consumption, drinking once a month was the most common, with 32.9%, followed by 30.6% drinking two to four times a month, 13.6% drinking two to three times a week, and 6.2% drinking more than four times a week. The majority (82.8%) of the participants did not smoke at all, 4.5% smoked less than 10 cigarettes a day, 7.8% smoked 11-19 cigarettes a day, and 4.9% smoked more than one pack a day. In addition, 77.8% did not exercise, 6.4% exercised once or twice a week, 9.8% exercised three or four times a week, and 6.0% exercised five or seven times a week. Mean blood cholesterol differed significantly according to drinking behavior (P < 0.05), and mean blood HDL-C and TG differed significantly according to drinking, smoking, and exercise patterns (P < 0.001).
Table 2: Level of lipid in blood according to health-related behavior.
| Characteristics | N (%) | Total cholesterol1) | HDL-cholesterol1) | Triglycerides1) | |
| Drinking | Not at all | 1,103(16.7) | 188.85a±38.4762) | 55.02c±14.361 | 122.68a±80.702 |
| 0<-≤1 time/month | 2,176(32.9) | 193.26ab±39.326 | 54.59c±13.799 | 125.36a±87.919 | |
| 1<-≤4 time(s)/month | 2,020(30.6) | 193.15ab±36.666 | 53.14bc±12.670 | 127.12a±80.410 | |
| 2-3 times/week | 897(13.6) | 192.72ab±36.389 | 51.91ab±12.480 | 146.73b±119.096 | |
| ≥4 times/week | 410(6.2) | 195.34b±39.693 | 50.84a±11.855 | 187.17c±186.406 | |
| P-value | 0.045* | 0.000*** | 0.000*** | ||
| Smoking | Not at all | 5,469(82.8) | 192.99±37.959 | 53.42b±12.823 | 125.06a±91.309 |
| 1-9 piece(s)/day | 297(4.5) | 191.00±37.425 | 52.45b±13.926 | 143.44ab±133.036 | |
| 10-19 pieces/day | 516(7.8) | 191.38±39.107 | 49.33a±11.733 | 156.81b±112.609 | |
| ≥20pieces/day | 324(4.9) | 192.47±37.573 | 47.43a±11.933 | 194.03c±153.157 | |
| P-value | 0.058 | 0.000*** | 0.000*** | ||
| Exercise | Not at all | 5,138(77.8) | 192.22±38.387 | 52.30a±12.695 | 134.49b±103.690 |
| 1-2time(s)/week | 422(6.4) | 192.81±35.150 | 52.20a±13.348 | 138.44b±104.990 | |
| 3-4times/week | 645(9.8) | 196.33±37.283 | 55.99b±12.991 | 115.55a±79.597 | |
| 5-7times/week | 401(6.0) | 193.19±37.309 | 53.67a±13.185 | 117.98a±82.395 | |
|
P-value |
0.075 | 0.000*** | 0.000*** | ||
| Total | 6,606(100.0) | 192.75±38.006 | 52.77±12.851 |
131.72±100.493 |
|
1) mg/dl, 2) Mean±S.D. *P<0.05, ***P<0.001.
Average Intake of Nutrients According to Blood TC Level
Table 3 shows the blood cholesterol measurements of the participants and the average intake of major nutrients according to the criteria for hypercholesterolemia. The average blood TC level of the group with normal blood TC (n = 3,877, 58.7%) was 167.82 mg/dL, that of the borderline group (n = 2,001, 30.3%) was 216.28 mg/dL, and that of the group with high blood cholesterol (n = 728, 11.0%) was 262.33 mg/dL.
The average daily energy intake of the moderate group was 1,905.39 kcal, with an average daily intake of 275.79 g carbohydrate, 70.02 g protein, 45.46 g fat, 14.45 g saturated fatty acids (SFAs), 14.65 g monounsaturated fatty acids (MUFAs), 11.85 g polyunsaturated fatty acids (PUFAs), 1.89 g omega-3 fatty acids, and 9.94 g omega-6 fatty acids. In addition, there were significant differences in the average intakes of energy, protein, fat, saturated fat, monounsaturated fat, polyunsaturated fat, omega-3 fatty acids, omega-6 fatty acids, and cholesterol excluding carbohydrates among the three groups according to the hypercholesterolemia criteria (P < 0.05, P < 0.01, P < 0.001).
Table 3: Nutritional intake according to the level of blood total cholesterol.
| Moderate ( < 200 mg/dL) | Boundary(200-239 mg/dL) | High ( ≥ 240 mg/dL) | P-value1) | |
| Energy(kcal) | 1,829.58ab2)±874.6403) | 1,905.39b±880.013 | 1,751.05a±773.173 | 0.000*** |
| Carbohydrate(g) | 274.31ab±113.531 | 275.79b±116.511 | 263.14a±107.383 | 0.173 |
| Protein(g) | 67.33b±39.867 | 70.02b±38.042 | 63.35a±33.278 | 0.596 |
| Fat(g) | 42.46ab±35.620 | 45.46b±35.275 | 40.76a±30.368 | 0.002** |
| SFA4)(g) | 13.59ab±12.748 | 14.45b±12.695 | 12.96a±10.750 | 0.015* |
| MUFA5)(g) | 13.68ab±13.346 | 14.65b±13.036 | 12.94a±11.050 | 0.004** |
| PUFA6)(g) | 10.97ab±8.889 | 11.85b±9.305 | 10.78a±8.163 | 0.009** |
| n-37)(g) | 1.73a±1.787 | 1.89b±1.746 | 1.75a±1.582 | 0.003** |
| n-68)(g) | 9.23ab±7.768 | 9.94b±8.105 | 9.04a±7.126 | 0.006** |
| Cholesterol(mg) | 240.77ab±227.208 | 261.71b±223.469 | 234.11a±221.148 | 0.001** |
| Mean(mg/dL)9) | 167.82±22.225 | 216.28±11.138 | 262.33±22.424 | – |
| N (%) | 3,877(58.7) | 2,001(30.3) | 728(11.0) | – |
1)One-Way ANOVA test was used, 2)a,b: different letters mean significant difference between groups by Scheffe’s multiple range test, 3)Mean±SD, 4)SFA: saturated fatty acids, 5)MUFA:mono-unsaturated fatty acids, 6)PUFA:poly-unsaturated fatty acid, 7)n-3:n-3 fatty acid, 8)n-6:n-6 fatty acid, 9)Mean of serum total cholesterol, *P<0.05, **P<0.01, ***P<0.001.
Average Intake of Nutrients According to Blood HDL-C Level
Table 4 shows the blood HDL-C levels of the participants grouped according to the HDL-C criterion for hyperlipidemia and compares the average nutrient intake across the groups. The average HDL-C level in the blood of the high-HDL-C group (n = 1,803, 27.3%) was 69.17 mg/dL, in the borderline group, which was the most common group (n = 3,686, 55.8%), it was 49.82 mg/dL, and in the low-HDL-C group (n = 1,117, 16.9%), it was 35.87 mg/dL. The average daily intake of carbohydrates was 260.89 g in the high-HDL-C group, 274.75 g in the borderline group, and 290.36 g in the low-HDL-C group. In the group with less than 40 mg/dL of HDL-C in the blood, the average carbohydrate intake was the highest, and there was a significant difference in the average intake of fat, saturated fat, simple unsaturated fat, and cholesterol, in addition to carbohydrates compared to the other two groups (P < 0.05, P < 0.01).
Table 4: Nutritional intake according to the level of blood HDL1)-cholesterol.
| High( ≥ 60 mg/dL) | Boundary(41-59 mg/dL) | Low( ≤ 40 mg/dL) | P-value2) | |
| Carbohydrate(g) | 260.89a3)±109.473 | 274.75b3)±113.911 | 290.36c3)±118.170 | 0.000*** |
| Fat(g) | 44.75b±32.886 | 43.43b±36.312 | 39.71a±33.771 | 0.001** |
| SFA(g)4) | 14.46b±11.795 | 13.85b±12.993 | 12.42a±12.059 | 0.002** |
| MUFA(g)5) | 11.46b±11.824 | 13.97b±13.634 | 12.71a±12.806 | 0.001** |
| Cholesterol(mg) | 252.86b±212.964 | 248.86b±235.218 | 227.11a±212.244 | 0.031* |
| Mean(mg/dL)6) | 69.17±8.731 | 49.82±5.253 | 35.87±3.708 | – |
1)HDL (high-density lipoprotein), 2)One-Way ANOVA test was used, Mean±SD, 3)a,b,c: different letters mean significant difference between groups by Scheffe’s multiple range test, 4)SFA: saturated fatty acids, 5)MUFA:mono-unsaturated fatty acids, 6)Mean of serum HDL-cholesterol, *P<0.05, **P<0.01, ***P<0.001.
Average Intake of Nutrients According to Blood TG Level
Table 5 shows the average blood TG value and the average nutrient intake of the participants divided into groups according to the criteria for hypertriglyceridemia. The average level in the group with normal blood TG (n = 4,716, 71.4%) was 88.62 mg/dL, 171.82 mg/dL in the borderline group (n = 964, 14.6%), 272.82 mg/dL in the group with high blood TG (n = 838, 12.7%), and 698.13 mg/dL in the group with very high blood TG (n = 88, 1.3%). In the group with very high blood TG of >500 mg/dL, the average daily energy intake was the highest at 2,135.61 kcal, and in the group with high blood TG of 200-499 mg/dL, the average daily intake of carbohydrates was the highest at 285.55 g. In the average nutritional intake according to the criteria for hypertriglyceridemia, total energy and carbohydrates differed significantly among the four groups (P < 0.01, P < 0.001).
Table 5: Nutritional intake according to the level of blood triglycerides.
| Moderate (≤ 149 mg/dL) | Boundary (150-199mg/dL) | High (200-499 mg/dL) | Very high( ≥500 mg/dL) | P-value1) | |
| Energy(kcal) | 1,812.50a2) ±838.1983) |
1,894.07a ±969.598 |
1,936.71ab2) ±881.865 |
2,135.61b ±943.392 |
0.000*** |
| Carbohydrate(g) | 270.32 ±112.605 |
279.09 ±119.523 |
285.55 ±112.643 |
275.56 ±118.962 |
0.001** |
| Mean(mg/dL)4) | 88.62 ±29.936 |
171.82 ±14.294 |
272.82 ±68.538 |
698.13 ±223.051 |
– |
| N (%) | 4,716(71.4) | 964(14.6) | 838(12.7) | 88(1.3) | – |
1)One-Way ANOVA test was used, 2)a,b: different letters mean significant difference between groups by Scheffe’s multiple range test, 3)Mean±SD, 4)Mean of serum triglycerides, **P <0.01, ***P <0.001.
The Effects of Demographic Characteristics, Health-related Behaviors, and Nutrients on Blood Lipids Levels
Through logistic regression analysis, the blood TC, HDL-C, and TG levels of adult men and women surveyed were general matters, such as BMI, education level, and health-related behaviors, such as drinking, smoking, exercise, and nutrients consumed. As shown in Table 6, BMI, education level, and menopause were significant factors linked to the blood TC level (P < 0.05, P < 0.01, P < 0.001). Moreover, the probability of a normal blood TC level decreased by 0.793 times as the BMI increased by the standard unit, decreased by 0.830 times as the level of education increased, and decreased by 0.471 times due to menopause.
Table 6: The effect of demographic characteristics, health-related behaviors and nutritional intakes on blood lipids levels (logistic regression analysis).
| Variables | Adjusted odds ratio for normal blood lipids levels | 95% CI | P-value | ||
| <Total cholesterol> | |||||
| BMI | <25 | reference | |||
| ≥25 | 0.793 | 0.714-0.881 | 0.000*** | ||
| Education | ≤ High school | reference | |||
| ≥ College | 0.830 | 0.715-0.963 | 0.014** | ||
| Menopause | No | reference | |||
| Menopause | 0.471 | 0.374-0.593 | 0.000*** | ||
| <HDL-cholesterol> | |||||
| BMI | <25 | reference | |||
| ≥25 | 0.560 | 0.507-0.618 | 0.000*** | ||
| Menopause | No | reference | |||
| Menopause | 0.497 | 0.384-0.643 | 0.000*** | ||
| Drinking | Not at all | reference | |||
| 0<-≤1 time/month | 1.176 | 1.021-1.236 | 0.048* | ||
| 1<-≤4 time(s)/ month | 1.424 | 1.140-1.778 | 0.002** | ||
| ≥2 times/week | 0.863 | 0.714-0.986 | 0.567 | ||
| Smoking | Not at all | reference | |||
| 1-9 piece(s)/day | 0.792 | 0.578-1.084 | 0.146 | ||
| 10-19 pieces/day | 0.564 | 0.453-0.703 | 0.000*** | ||
| ≥20 pieces/day | 0.416 | 0.320-0.540 | 0.000*** | ||
| Exercises | Not at all | reference | |||
| ≥ 1 time/week | 1.123 | 0.714-0.881 | 0.017* | ||
| n-3 Fatty acid (intake) | 1.701 | 1.016-2.848 | 0.044* | ||
| Cholesterol (intake) | 0.998 | 0.997-1.000 | 0.048* | ||
| <Triglycerides> | |||||
| BMI | <25 | reference | |||
| ≥25 | 0.515 | 0.464-0.573 | 0.000*** | ||
| Menopause | No | reference | |||
| Menopause | 0.505 | 0.390-0.655 | 0.000*** | ||
| Smoking | Not at all | reference | |||
| 1-9 piece(s)/day | 0.685 | 0.490-0.958 | 0.027* | ||
| 10-19 pieces/day | 0.475 | 0.376-0.599 | 0.000*** | ||
| ≥20 pieces/day | 0.260 | 0.201-0.337 | 0.000*** | ||
| Exercises | Not at all | reference | |||
| ≥ 1 time/week | 1.213 | 1.090-1.350 | 0.000*** | ||
*P<0.05, **P<0.01, ***P<0.001.
BMI, menopause, drinking, smoking, exercise, intakes of PUFAs and omega-3 fatty acids, and cholesterol were significant factors associated with the blood HDL-C level (P < 0.05, P < 0.01, P < 0.001). Furthermore, the probability of a normal blood HDL-C level decreased by 0.560 times as BMI increased and decreased by 0.497 times due to menopause. Among the health-related activities, as the degree of drinking and smoking increased by the nominal number of units, the probability of a normal blood HDL-C level decreased by 0.380 and 0.849 times, respectively. On the contrary, exercise increased the probability of a normal blood HDL-C level by 1.123 times.
BMI, menopause, smoking, and exercise were significant factors linked to the blood TG level (P < 0.001). In addition, the probability of a normal blood TG level decreased by 0.515 times as the nominal units of BMI increased, decreased by 0.505 times due to menopause, decreased by 0.750 times as the number of smoking units increased, and increased by 1.213 times consequent to exercise.
Discussion
The present study analyzed the results of the 2019 KNHANES conducted by the KDCA to prepare data for risk factors that may be major causes of cardiovascular disease by investigating demographic characteristics, such as sex, age, BMI, education level, alcohol, smoking, exercise, and nutrient intakes. Among the demographic characteristics, women showed significantly lower average blood total cholesterol and TG levels but a higher average HDL-C level than men. However, in women, menopause affects blood lipid concentration, and the regression analysis of this study showed that the probability of normal blood lipid levels in menopause decreased by 0.471 to 0.505 times.
The average TG level tends to be lower in the level of adult women in their 20s and 30s than men in 20s and 30s, but that of women gradually increases compared to men in their 40s and 50s, and rapidly increases in their 50s, the age of menopause.22,23 Age-related changes in blood lipid concentration of women differ from those of men. HDL-C decreases rapidly in women compared to men, in whom HDL-C decreases to a plateau from their late 40s.23 In the present study, the average blood total cholesterol and TG gradually increased with age in adult men and women from 20 years until peaking somewhere in their 50s and then gradually decreasing into their 60s and 70s.
According to data from the 2016-2018 KNHANES, women tend to be higher than men after their mid-50s, and men’s TC and TG peak in their early 50s but gradually decrease after age 60. Conversely, women’s TG increases rapidly in their 50s, showing a higher average than men in their late 60s.3 In the regression analysis of the present study, as adults age, the probability of normal blood cholesterol and HDL-C levels decreased by 0.8 times, and serum cholesterol and TG peaked in their 50s. Both adult men and women need to manage their blood lipid levels as they age, especially for men in their 40s and 50s and women after menopause.3,5-7
According to the results of the present study, all serum lipid levels deteriorated rapidly in those with overweight and obesity compared to underweight or normal weight, as categorized by BMI, and the regression analysis also showed a 0.5-0.7 times decrease in the probability of being within the normal BMI range. Other studies have also shown that obesity increases the incidence of dyslipidemia by at least 1.3 to 1.6 times.6,7,8.24 This is because dysregulation of lipoprotein metabolism in obesity causes excessive production of very-low-density lipoprotein or increased catabolism of high-density lipoprotein (HDL).25 Overweight- or obesity-related dyslipidemia can be improved by lifestyle modifications, such as diet restrictions and increased physical activity; thus, weight loss by improving eating habits and increasing exercise is recommended.24,25
Among the health-related behaviors analyzed in the present study, an increase in the average alcohol intake significantly increased blood total cholesterol and TG, decreased blood HDL-C, and decreased the probability of a normal HDL-C by 0.38 times. Excessive alcohol intake (>210 g/week for males; >140 g/week for females) can increase blood TG levels by affecting the synthesis of TG and lipoproteins in the liver.26,27 Conversely, moderate alcohol consumption (alcohol consumption <12 g/day) protects against stroke.28 In particular, wine consumption has been associated with lower mortality risk.29 However, as alcohol intake increases, it affects not only blood TG but also the body’s lipid index, which can negatively affect hyperlipidemia overall, pressing the need to raise awareness of excessive alcohol consumption.30
In the case of smoking, the present study showed that the higher the amount of smoking, the more negative the blood TG and HDL-C were, and the probability of being within the normal ranges decreased by 0.750 and 0.849 times, respectively. In addition to the significant difference in blood TG and HDL-C levels between non-smokers and smokers, these levels are also strongly correlated with the amount of smoking and the duration of the smoking habit, all of which can increase the risk of arteriosclerosis.31 A study of Pakistanis found that smokers in their 40s and 50s had a significantly higher prevalence of dyslipidemia than non-smokers and 1.22-1.85 times higher blood LDL-C, HDL-C, and TC than those with no smoking history.32
Even second-hand smoking can increase dyslipidemia. In adults exposed to second-hand smoke, women (1.214 times) had a higher prevalence of dyslipidemia than men (1.165 times), and older adults (age >60) (1.304 times) had a higher prevalence of dyslipidemia compared to adults less than 60 years old (1.130 times).33 Electronic cigarettes are another factor that increases dyslipidemia, highlighting the need to emphasize the negative health effects of any type of smoking on blood lipid levels.34
The results of the present study showed a significant difference in the average blood TG and HDL-C levels according to the degree of exercise among health-related behaviors. Furthermore, logistic regression showed that the probability of having normal blood TG and HDL-C levels increased by 1.213 and 1.123 times, respectively, as the amount of exercise increased. In this study, exercise was defined as physical activity that caused slight shortness of breath or slightly rapid heartbeat for more than 10 min and investigated the frequency of regular exercise (0-7 times a week), such as fast walking, light running (jogging), and weight training (muscle exercise). Regular exercise at an intensity that consumes calories or jogging at a normal speed of 27-29 km a week can improve the lipoprotein composition of blood, especially in the absence of significant weight loss, which can significantly reduce the concentration of low-density lipoprotein (LDL) particles in the blood and increase the average size of HDL.35,36 Based on the findings of the present study and previous studies, there is a need to publicize the long-term health benefits of regular exercise at recommended levels for improving blood lipids.
In this study, the difference in the average intake of major nutrients according to the blood TC standard was analyzed. The average intake of energy, carbohydrates, fats, saturated fats, monounsaturated fats, omega-3 and omega-6 fatty acids, and cholesterol of the boundary group was higher than that of the high group (≥ 240 mg/dL). The blood TC has been related to the amount of SFAs consumed, and replacing SFAs with MUFAs or PUFAs reduced the blood TC and LDL-C.37 In addition, if total dietary lipids increase, serum lipid improvement decreases by 0.626 times, and as saturated fatty acid intake increases, serum lipid improvement decreases by 0.561 times.38 However, reducing saturated fatty acid intake and replacing it with carbohydrates can worsen risk indicators of cardiovascular disease, such as increased blood triglycerides or reduced HDL cholesterol, so caution is needed.37 In the present study, the average carbohydrate intake was the highest in the high group with 200-499 mg/dL of blood TG. A previous meta-study demonstrated the cardiovascular disease prevention effect when substituting SFAs with PUFAs, and the risk of coronary heart disease in the dietary control group with 14.9% decreased by 19% compared to the control group with 5% average PUFA consumption of energy consumed.39
Regression analysis in this study showed that as the amount of PUFAs and omega-3 fatty acids consumed increased, the probability of a normal blood HDL-C increased by 1.589 and 1.701 times, respectively. However, unconditionally lowering SFAs does not reduce the risk of cardiovascular disease. In particular, foods such as fat-rich dairy products, unprocessed red meat, and dark chocolate contain high levels of SFAs but do not increase the risk of cardiovascular disease.40 In addition, the composition of food consumed is also important. The Mediterranean diet, which includes an abundance of seafood, olive oil, fruits, vegetables, nuts, and wine, is characterized by high consumption of fiber and unsaturated fatty acids.41-43 Adherence to the Mediterranean diet for an average of 4.8 years has been shown to lower the risk profile of cardiovascular disease by 0.72 to 0.70 times.42-44 Blood lipids are a major cause of cardiovascular disease. Therefore, it appears that a health-conscious daily diet is imperative for the improvement and management of blood lipids and, thus, the prevention of cardiovascular disease.
Conclusion
This study investigated the effect of health-related behavior and nutritional intake on blood lipid levels in South Korean adult men and women. Underweight and normal BMI have a higher risk of hyperlipidemia than overweight and obesity. Health-related behavior, especially the degree of alcohol consumption, was significantly linked to the mean blood total cholesterol, and the mean blood HDL-C and TG levels were significantly linked to drinking, smoking, and exercise. Logistic regression showed that blood total cholesterol was significantly associated with BMI, education level, and menopause; blood HDL-C was significantly associated with BMI, menopause, alcohol, smoking, exercise, intakes of PUFAs and omega-3 fatty acids, and dietary cholesterol; and blood TG levels were significantly associated with BMI, menopause, smoking, and exercise.
Evidence was provided to suggest an increase in the risk of hyperlipidemia with age in both adult men and women, especially in their 40s and 50s, emphasizing the importance of the management of blood lipid levels. In addition, women should be attentive to these levels after menopause. Excessive alcohol consumption and any type of smoking negatively affect blood lipid health. Additionally, because of the negative effect of overweight or obesity on hyperlipidemia, it is also important to improve lifestyle factors, specifically regularly exercising at a static level and adhering to a healthy diet to maintain a normal weight and improve blood lipid levels. This study has a limitation in that it analyzed the degree of influence of general lifestyle and nutrition that affects blood lipids levels with data from KNHANES. In future research, detailed studies on how blood lipids concentrations are affected in differentiated situations for specific lifestyles, specific diseases, and specific population groups are needed.
Acknowledgement
The author acknowledges the help received from the scholars whose articles are cited and included in references of this manuscript. The author is also grateful to authors / editors / publishers of all those articles, journals and books from where the literature for this article has been reviewed and discussed.
Conflict of Interest
The author declares no conflict of interest.
Funding Sources
The author received no financial support for the research, authorship, and/or publication of this article.
References
- World Health Organization. The top 10 causes of death. https://www.who.int/news-room/fact-sheets/detail/the-top-10-causes-of-death. Accessed October 28, 2022. https://eplus.seowon.ac.kr/DocZoomShareHub/ContentViewer/10540_2kp4yn8e8dw7lj5g?playeronly=true
- World Health Organization. Global Health Estimates: Life expectancy and leading causes of death and disability. 2019. https://www.who.int/data/gho/data/themes/mortality-and-global-health-estimates. Accessed October 28, 2022.
- Rhee E.J., Kim H.C., Kim J.H., et al. 2018 Guidelines for the management of dyslipidemia in Korea. J Lipid Atheroscler. 2019;8(2):78-131. doi.org/10.12997/jla.2019.8.2.78.
CrossRef - Nelson R.H. Hyperlipidemia as a Risk factor for cardiovascular disease. Prim C 2013;40(1):195–211. doi: 10.1016/j.pop.2012.11.003.
CrossRef - Cho S.M.J., Lee H.K., Lee H.H., et al. Dyslipidemia fact sheets in Korea 2020: an analysis of nationwide population-based data. J Lipid Ather 2021;10(2):202-209. doi: 10.12997/jla.2021.10.2.202.
CrossRef - Lu Y., Wang P., Zhou T., et al. Comparison of prevalence, awareness, treatment, and control of cardiovascular risk factors in China and the United States. J Am Heart Assoc. 2018;7(3):e007462. doi: 10.1161/JAHA.117.007462.
CrossRef - Gao H., Wang H., Shan G., et al. Prevalence of dyslipidemia and associated risk factors among adult residents of Shenmu City, China. PLoS On 2021;16(5):e0250573. doi:10.1371/journal.pone.0250573.
CrossRef - Xi Y., Niu L., Cao N., et al. Prevalence of dyslipidemia and associated risk factors among adults aged ≥35 years in northern China: a cross-sectional study. BMC Public Health. 2020;20(1):1068. doi: 10.1186/s12889-020-09172-9.
CrossRef - Park J.H., Lee M.H., Shim J.S., et al. Effects of age, sex, and menopausal status on blood cholesterol profile in the Korean population. Korean Circ J. 2015;45(2):141-148. doi: 10.4070/kcj.2015.45.2.141.
CrossRef - Gusnedi A.M., Witjaksono F., Mansyur M., et al. Promotion of optimized food-based recommendations to improve dietary practices and nutrient intakes among Minangkabau women of reproductive age with dyslipidemia. Asia Pac J Clin Nutr. 2020;29(2):334-347. doi: 10.6133/apjcn.202007_29(2).0016.
- Nordmann A.J., Nordmann A., Briel M, et al. Effects of low-carbohydrate vs low-fat diets on weight loss and cardiovascular risk factors: a meta-analysis of randomized controlled trials. Arch Intern Med. 2006;166(3):285-293. doi: 10.1001/archinte.166.3.285.
CrossRef - Chiavaroli L., Nishi S.K., Khan T.A., et al. Portfolio dietary pattern and cardiovascular disease: a systematic review and meta-analysis of controlled trials. Prog Cardiovasc Dis. 2018;61(1):43-53. doi: 10.1016/j.pcad.2018.05.004.
CrossRef - Arnett D.K., Blumenthal R.S., Albert M.A., et al. 2019 ACC/AHA Guideline on the primary prevention of cardiovascular disease: a report of the American college of cardiology/American heart association task force on clinical practice guidelines. 2019;140(11):e596-e646. doi:10.1161/CIR.0000000000000678
CrossRef - Marshall D.A., Walizer E.M., Vernalis M.N. Achievement of heart health characteristics through participation in an intensive lifestyle change program (coronary artery disease reversal study). J Cardiopulm Rehabil Prev. 2009;29(2):84-94. doi: 10.1097/HCR.0b013e31819a00b2.
CrossRef - Ornish D., Scherwitz L.W., Billings J.H., et al. Intensive lifestyle changes for reversal of coronary heart disease. 1998;280(23):2001-2007. doi:10.1001/jama.280.23.2001.
CrossRef - Manfredini F., D’Addato S., Laghi L., et al. Influence of lifestyle measures on hypertriglyceridaemia. Curr Drug Targets. 2009;10(4):344-355. doi: 10.2174/138945009787846407.
CrossRef - Korea Centers of Disease Control and Prevention. Guidelines for analysis of raw data of the national health and nutrition survey (SPSS). 2013. https://knhanes.kdca.go.kr/knhanes/sub03/sub03_06_02.do. Accessed October 28, 2022.
- World Health Organization expert consultation. Appropriate body-mass index for Asian populations and its implications for policy and intervention strategies. 2004;363(9403):157-163. doi: 10.1016/S0140-6736(03)15268-3.
CrossRef - Korean Society for the Study of Obesity. Diagnosis and evaluation of obesity. 2022. http://general.kosso.or.kr/html/?pmode=obesityDiagnosis. Accessed October 28, 2022.
- Grundy S.M., Stone N.J,. Bailey A.L., et al. 2018 AHA/ACC/AACVPR/AAPA/ABC/ACPM/ADA/AGS/APhA/ASPC/NLA/PCNA guideline on the management of blood cholesterol: executive summary: a report of the american college of cardiology/american heart association task force on clinical practice guidelines. J Am Coll Cardiol. 2019;73(24):3168-3209. doi:10.1016/j.jacc.2018.11.002.
CrossRef - Mach F., Baigent C., Catapano A.L., et al. 2019 ESC/EAS Guidelines for the management of dyslipidaemias: lipid modification to reduce cardiovascular risk. Eur Heart J. 2020;41(1):111-188. doi:10.1093/eurheartj/ehz455.
CrossRef - Park J.H., Lee M.H., Shim J.S., et al. Effects of age, sex, and menopausal status on blood cholesterol profile in the Korean population. Korean Circ J. 2015;45(2):141-148. doi: 10.4070/kcj.2015.45.2.141.
CrossRef - Ward E., Gold E.B., Johnson W.O., et al. Patterns of cardiometabolic health as midlife women transition to menopause: a prospective multiethnic study. J Clin Endocrinol Metab. 2019;104(5):1404-1412. doi: 10.1210/jc.2018-00941.
CrossRef - Chan D.C., Pang .J, Watts G.F.. Dyslipidemia in obesity. In Metabolic Syndrome. ed. Ahima, R. S. 2016. pp.525–540. Springer international publishing. https://doi.org/10.1007/978-3-319-11251-0_30. Accessed October 28, 2022.
CrossRef - Klop B., Elte, J.W., Cabezas M.C.. Dyslipidemia in obesity: mechanisms and potential targets. 2013;5(4):1218-1240. doi: 10.3390/nu5041218.
CrossRef - Bessembinders K., Wielders J, Wiel A. Severe hypertriglyceridemia influenced by alcohol (SHIBA). Alcohol Alcohol. 2011;46(2):113-116. doi: 10.1093/alcalc/agq088.
CrossRef - Hannuksela M.L., Rämet M.E., Nissinen A.E.T, et al. Effects of ethanol on lipids and atherosclerosis. Pathophysiology, 2004;10(2):93-103. doi: 10.1016/j.pathophys.2003.10.009.
CrossRef - Reynolds K., Lewis B., Nolen J.D.L., et al. Alcohol consumption and risk of stroke: a meta-analysis. JAMA. 2003;289(5):579-588. doi: 10.1001/jama.289.5.579.
CrossRef - Grønbaek M., Becker U., Johansen D., et al. Type of alcohol consumed and mortality from all causes, coronary heart disease, and cancer. Ann Intern Med. 2000;133(6):411-419. doi: 10.7326/0003-4819-133-6-200009190-00008.
CrossRef - Capurso N.A., Petrakis I. Dyslipidemia associated with heavy alcohol use. Am J Addict. 2016;25(3):188-190. doi: 10.1111/ajad.12347.
CrossRef - Haj Mouhamed D., Ezzaher A., Neffati F., et al. Association between cigarette smoking and dyslipidemia. Immunoanal Biol Special. 2013;28(4): 195–200. doi: 10.1016/j.immbio.2013.03.004.
CrossRef - Iqbal S., Ramzan M., Shahzad A. Evaluation of association between dyslipidemia and smoking routine of smokers in southern Punjab. Med Forum Mon. 2021;32:115-9. https://medforum.pk/article/28evaluation-of-association-between-dyslipidemia-and-smoking-routine-of-smokers-in-southern-punjab-1. Accessed October 28, 2022.
- Okekunle A.P., Asowata J.O., Adedokun B., Akpa O. Secondhand smoke exposure and dyslipidemia among non-smoking adults in the United States. Indoor Air. 2022;32(1):e12914. doi: 10.1111/ina.12914.
CrossRef - Jeong W. Association between dual smoking and dyslipidemia in South Korean adults. PloS one. 2022;17(7):e0270577. doi: 10.1371/journal.pone.0270577
CrossRef - Leon A.S., Sanchez O. Response of blood lipids to exercise training alone or combined with dietary intervention. Med Sci Sports Exerc. 2001;33(6 Suppl):S502-515. doi: 10.1097/00005768-200106001-00021.
CrossRef - Kraus W.E., Houmard J.A., Duscha B.D., et al. Effects of the Amount and Intensity of Exercise on Plasma Lipoproteins. N Engl J Med. 2002;347(19):1483-14 doi: 10.1056/NEJMoa020194.
CrossRef - Mente A., Dehghan M., Rangarajan S., et al. Association of dietary nutrients with blood lipids and blood pressure in 18 countries: a cross-sectional analysis from the PURE study. Lancet Diabetes Endocrinol 2017;5(10):774–7 doi: 10.1016/S2213-8587(17)30283-8.
CrossRef - Hooper L., Martin N., Jimoh O.F., et al. Reduction in saturated fat intake for cardiovascular disease. Cochrane Database Syst Rev. 2020;5(1):CD011737. doi:10.1002/14651858.CD011737.pub2.
CrossRef - Mozaffarian D., Micha R., Wallace S.. Effects on coronary heart disease of increasing polyunsaturated fat in place of saturated fat: a systematic review and meta-analysis of randomized controlled trials. PLoS Med. 2010;7(3):e1000252. doi: 10.1371/journal.pmed.1000252.
CrossRef - Astrup A., Magkos F., Bier D.M., et al. Saturated fats and health: a reassessment and proposal for food-based recommendations. J Am Coll Cardiol. 2020;76(7):844–8 doi: 10.1016/j.jacc.2020.05.077.
CrossRef - Senee A., Ishnoo Y.B. Jeewon R. An analysis of the contributors and factors influencing dietary patterns among the elderly population. Res. Nutr. Food Sci. 2022;10(3):895-903. doi.:10.12944/CRNFSJ.10.3.7.
CrossRef - Atalay B.G., Akkuş Ö.Ö., Yapıcı Y. Adherence to a mediterranean diet and cardio-metabolic risk in postmenopausal women by body composition. Asia Pac J Clin Nutr. 2022;31(2):312-9. doi:10.6133/apjcn.202206_31(2).0017.
CrossRef - Antoniazzi L., Arroyo-Olivares R., Bittencourt M.S., et al. Adherence to a mediterranean diet, dyslipidemia and inflammation in familial hypercholesterolemia. Nutr Metab Cardiovasc Dis. 2021;31(7):2014-22. doi: 10.1016/j.numecd.2021.04.006.
CrossRef - Estruch R., Ros E., Salas-Salvado J., et al. Primary prevention of cardiovascular disease with a mediterranean diet supplemented with extra-virgin olive oil or nuts. N Engl J Med. 2018;378(25):e34. doi: 10.1056/NEJMoa1800389.
CrossRef
Accepted on: 20 Feb 2023
Second Review by: Yaiza Taboada Iglesias España , Daniela Serban
Final Approval by: Dr Suhad Maatoug Bahijri


Web of Science Coverage
Emerging Sources Citation Index (ESCI)
2024 Journal Impact Factor: 1.1
Scopus Journal Metrics
CiteScore 2025: 2.6
CiteScore Details
Sustainable Nutrition: Food Systems, Nutrient Retention, and Public Health Impact
![]()
This journal is a member of, and subscribes to the principles of, the Committee on Publication Ethics (COPE)


