Effect of Processing Treatments on the Nutritional, Anti-Nutritional, and Bioactive Composition of Blue Maize (Zea mays L.)
Divya Chauhan1
, Naseer Ahmed1, Tajendra Pal Singh1, Priyanka Thakur1, Qurat-Ul-Eain Hyder Rizvi1, Ajar Nath Yadav2 and Harcharan Singh Dhaliwal2 1Department of Food Technology, Dr. Khem Singh Gill Akal College of Agriculture, Eternal University, Baru Sahib, Sirmour, India.
2Department of Biotechnology, Dr. Khem Singh Gill Akal College of Agriculture, Eternal University, Baru Sahib, Sirmour, India.
Corresponding Author Email: krishankumar02007@gmail.com
DOI : http://dx.doi.org/10.12944/CRNFSJ.10.1.12
Download this article as:
![]()
Maize is considered as an important annual cereal crop cultivated widely throughout the world. Blue Maize (Zea mays L.) is a blue-colored variety of maize containing high content of anthocyanin and belongs to the family Poaceae. The current study aimed to evaluate the effect of soaking, germination, natural fermentation, and roasting on nutritional, anti-nutritional, and bioactive components of blue maize. The changes in chemical composition were studied after 12 and 24 h of soaking and 24, 48, and 72 h of germination treatment. The blue maize grains were subjected to natural fermentation for time intervals of 12, 24, and 36 h, and roasting treatment by heating at 180 °C on a hot plate for 10 s. The results revealed that the phenolic content increased significantly (p≤0.05) from 44.88 to 51.56 mg GAE/100g after 36 h fermentation and from 44.88 to 61.05 mg GAE/100g after 72 h of germination whereas it decreased from 44.88 to 35.73 mg GAE/100g during the roasting process. Further, there was a 44.02 and 20.22% increase in protein content during germination and fermentation processes, respectively, and a slight decrease of 2.16% after roasting treatment. The antioxidant activity increased significantly (p≤0.05) from 10.41 to 18.85% during germination and 10.41 to 14.50% during fermentation, respectively. But it was found to get decreased by 6.53% after the roasting process. The anti-nutrients such as phytic acid and tannins declined significantly (p≤0.05) during the processing treatments. Phytic acid decreased to the extent of 63.57, 55.99, and 27%, and tannin contents as 62.5, 50, and 41.66%, after germination, fermentation, and roasting processes, respectively. There was a significant (p≤0.05) increase in mineral contents after all processing treatments of blue maize.
KEYWORDS:Anthocyanin; Anti-Nutrients; Antioxidant Activity; Blue Maize; Fermentation; Germination; Roasting
Introduction
Maize or corn (Zea mays L.) is a leading crop of the world belonging to the family Poaceae. It is generally known as a staple food crop in various parts of the world as well as the third prominent crop of the world after rice and wheat 1. Due to its higher yield among the cereals, it is globally known as the ‘queen of cereals’. The United States of America (USA) is considered the major producer of maize and is contributing to about 35% of the total production of maize around the world. It is termed as the mother grain of the United States of America and it contributes a major role in driving the economy of the country 2. It is widely processed into numerous types of food products, and ingredients such as starch, cornmeal, grits, tortillas, flour, snacks, and breakfast cereals. Corn flour is commonly utilized to make chapattis or flatbread which is consumed mostly in the northern parts of India and around the Mediterranean3. There is increased attention of food scientists towards the therapeutic benefits of nutraceuticals or the phytochemical compounds present in maize 4 as well as the pigmented materials having sufficient anthocyanin contents. The antioxidant properties of various flavonoids, including anthocyanins and their advantageous effects on human health, are being studied5.
Pigmented maize i.e. purple, blue, and red maize are rich in anthocyanin and have been found to prevent colorectal carcinogenesis in male rats due to its high antioxidant potential and possesses anti-mutagenic and radical scavenging activities 6. These bioactivities are linked with anthocyanin components present in these crops 7. Blue maize (Zea mays L.) due to its high nutraceutical properties, is of great concern to various food scientists working on nutraceutical and functional foods. It has been reported to have high levels of phytochemicals and nutraceutical activity 8. Besides its nutritional characteristics, it has been reported to contain various anti-nutrients such as tannins and phytic acid which bind with various nutrients making them unavailable to our body 9. Traditional processing treatments like soaking, fermenting, germinating, and roasting have been utilized for improving the nutritional value of the cereals and pulses 10. The germination process is widely used in cereals and legumes for increasing the nutritive value mainly through the breakdown of anti-nutritional components 11. Processing techniques responsible for decreasing the anti-nutritional factors as well as minimizing the losses of micronutrients are of great interest to scientists. The thermal and biological processing treatments have the potential to increase the availability of nutrients in foods 10. Processing techniques like soaking, germination, fermentation and roasting lead to a decline in anti-nutrients such as phytic acid and increase the solubility of minerals in foods resulting in an improved bioavailability of mineral contents in legumes and cereals.
The study is aimed at investigating the changes in nutritional, anti-nutritional, and bioactive components after soaking, germination, fermentation, and roasting treatments of blue maize.
Materials and Methods
Materials
The blue maize used in the present investigation was obtained from the experimental farms of Eternal University, Baru Sahib, Sirmour, HP. The chemicals used were of ultrapure grade and purchased from standard manufacturers such as BDH chemicals, Qualigens, Merck India, Hi-Media, and Sigma.
Physico-Chemical Evaluation
Physico-chemical evaluation of raw maize, and that of the soaked, germinated, roasted, and fermented ones, was done at laboratories of the Department of Food Technology, Eternal University, Sirmour, Himachal Pradesh, India.
Physical parameter like a thousand-grain weight was estimated as per the methods of AACC12 and expressed as the weight of thousand grains in gram. Length, breadth, and thickness were measured with a Vernier caliper and expressed in mm. The functional characteristic such as bulk density and tap density was assessed as per the method described by Huang et al.13, and Jones et al.14, respectively. For bulk density, the grains were poured in a vessel of known volume, from a constant height. The mass of the sample occupying that volume was determined and bulk density was calculated as the ratio of mass with volume and expressed as g/ml. For tap density, the volume of 10 g grains was measured with a measuring cylinder (250 ml). The tap density was determined by tapping the graduated cylinder containing the sample until a further change in the volume of the sample was observed.
Similarly, the water absorption capacity and oil absorption capacity were estimated as per the method given by Sosulski and Slinkard15 respectively. For oil and water absorption capacity one g of sample for each treatment were weighed into a centrifuge tube and 10 ml of distilled water (water absorption capacity) or refined soybean oil (oil absorption capacity) was added. The contents of the centrifuge tubes were stirred for 30 s, with a glass rod. The suspension was kept for 30 min and the tube was then subjected to centrifugation at 2000 rpm for 10 min. The water or oil left after centrifugation was decanted and the amount of water or oil absorbed was calculated as the ratio of the volume of water or oil retained and weight of the sample and expressed as ml/g.
Moisture content was estimated as per the hot air-oven drying method of AOAC16. The crude fiber content (%) was accessed using the instrument Fibroplus, model FBS 08P (Pelican), crude protein contents (%) by the instrument Kjeloplus Kjelodist model CAS VA (Pelican), crude fat contents by instrument Soxoplus (%), model SPS 06 AS (Pelican Inc.), and ash contents (%) as per the method suggested by Ranganna17. The total carbohydrates (%) were determined by difference and calculated by deducting the total of crude fat, protein, ash content, crude fiber, and moisture content from 100. The calorific value (kcal/100g) was determined by multiplying the contents of fats, crude protein (N × 6.25), and carbohydrates with the Atwater factors of 9.10, 4.0, and 4.2 kcal/g for each component, respectively (WHO, 1973). Mineral contents such as manganese, copper, zinc, and iron were estimated as per AOAC16 using the instrument Atomic Absorption Spectrometer, model AA240FS (Agilent Technology, CA, USA).
Anthocyanin contents were estimated by adopting the pH differential method as given by Abdel-Aal et al.18. The anthocyanin levels were expressed as mg of cyanidin 3-glucoside equivalents (CGE) per 100 g of sample. The antioxidant activity was estimated by measuring the DPPH (1,1-diphenyl-2- picrylhydrazyl) radical-scavenging effect as per the method described by Bouaziz et al.19 and expressed as DPPH radical scavenging activity (% inhibition) and tannins (%) were accessed as per the method standardized by Saxena et al.20 by using Folin-Denis reagent and measuring the absorbance at 700 nm using a spectrophotometer. The extraction and quantification of phytic acid in the biofortified wheat derivatives was evaluated by Gao et al.21, by extraction of phytic acid in 0.2 N HCl buffer and further mixing with Wade reagent (0.03% FeCl3.6H2O + 0.3% sulfosalicylic acid). The standard curve was prepared using sodium phytate and absorbance of color reaction products for both samples and standards were read at 500 nm on a UV-Vis spectrophotometer (Labtronics). Total phenolic contents (mg GAE/100g) were estimated using Folin-Ciocalteu reagent as per the method of Ainsworth and Gillespie22 by detecting the absorbance at 765 nm and total phenolic contents were determined from the linear equation of a standard curve prepared with gallic acid.
Processing Treatments
The soaking and germination of grains were done as per the method used by Egli et al.23. The grains of blue maize were cleaned manually to remove foreign objects and soaked in distilled water in the ratio of 1:5. Soaking was done for 12 and 24 h at room temperature and oven-drying at 40°C for 24 h. Soaked grains were packed and stored at 4°C for further analysis. For germination, the grains of blue maize were soaked and subjected to germination treatment by dividing into several groups according to different germination treatments. The 30g seeds in each treatment were cleaned and steeped in 120 ml water in a beaker covered with muslin cloth for 16 h in dark at ambient conditions. The steeped seeds were drained off and were covered with moist muslin cloth for germination. Germination was carried out in an incubator at 24, 48, and 72 h at 25°C. The seeds were sprinkled periodically with water to keep the muslin cloth wet. Seeds germinated after each treatment were dried at 40°C in the oven for 24 h. Germinated and dried grains were packed and stored at 4°C in tight sealable packets until further analysis.
The blue maize seeds were subjected to roasting treatment by heating at 180 °C on a hot plate for 10 s. The seeds were cooled and converted to fine flour by a kitchen grinder (Sujata, Powermatic Plus) at high speed to get the flour. The flour obtained was sieved through a 60-mesh stainless steel sieve, packed in an airtight container, and stored at 4 °C 24 till further analysis.
For the fermentation treatment process, a 100 g sample (flour) of blue maize was immersed in 300 ml of distilled water without washing and allowed to undergo the fermentation process in an incubator at a temperature of 37 °C for 72 h. The fermentation process was accomplished by the microorganisms naturally present in maize flour. The sample was agitated and mixed well at an interval of 12 h and the process was terminated at different time intervals i.e. 12, 24, and 36 h. The samples collected at each period were oven-dried at 50 °C for about 8 h until a constant weight was obtained. The dried samples were ground in a blender, and sieved by passing through a 60-mesh stainless steel sieve, packed airtight in polypropylene bags, and stored at 4 °C until used for analysis25.
Statistical Analysis
The data obtained during the study were evaluated using one-way analysis of variance (ANOVA) using IBM SPSS Statistics 26 software. Values in tables were expressed as mean ± Standard Deviation and the differences in variables were considered significant at the level of p≤0.05 according to Duncan’s LSD post hoc analysis according to Duncan’s LSD post hoc analysis.
Results and Discussion
The blue maize after processing treatments was subjected to physicochemical analysis. The results of analytical studies carried out on raw and processed grains are discussed under the following headings.
Nutritional, Functional, Anti-Nutritional, and bioactive components of Raw Blue Maize
The grains of blue maize were subjected to physicochemical analysis and data about nutritional, bioactive, and anti-nutritional components is presented in Table 1 and Figure 1. The physical and functional characteristics of raw maize are presented in Figure 1. The data shows that the length, width, and thickness of grains were 7.03, 6.97, and 3.77 mm, respectively. The thousand kernel weight of grains was found as 123.63 g. whereas, the bulk and tap density of grains were reported as 0.93 and 1.03 g/ml, respectively. Chaparro Acuña et al.26 reported the bulk density of blue maize seeds as 0.92 g/ml. The value for water absorption capacity was found as 1.30 ml/g whereas that for the oil absorption capacity was 1.18 ml/g. The swelling capacity of maize grains was estimated as 46.37%.
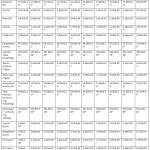 |
Table 1: Effect of Processing Treatments at Different Time Intervals on the Nutritive Value of Blue Maize. |
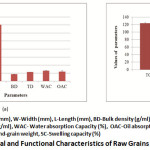 |
Figure 1: Physical and Functional Characteristics of Raw Grains of Blue Maize. |
Blue maize was found to be a rich source of nutritional components. It contains 12.52% of moisture, 7.86% of crude proteins, 4.37% of crude fat, 2.33% ash content, and 67.46% of carbohydrates. Sagbo et al.27 reported that the moisture, fat, and ash contents ranged from 6.09-11.57%, 2.87-12.54%, and from 1.09-5.46%, respectively. Blue maize was found a rich source of bioactive constituents such as polyphenolic and anthocyanin components. It contained 44.88 mg GAE/100g of polyphenolic components. Whereas, the level of anthocyanin content as reported in blue maize was 543.97 mg CGE/kg (Cyanidin 3-glucoside equivalent/100g). Lopez-Martinez et al.28 found that anthocyanin contents of different types of maize grains ranged between 93–851 mg CGE/100g in purple maize, 76–120 mg CGE/100g in black maize, and 85–154 mg CGE/100g in red phenotypes of pigmented maize. Due to its high polyphenolic and anthocyanin contents, blue maize was found to have high antioxidant activity of 10.41%. Anti-nutritional factors responsible for chelating minerals and making them unavailable to our body such as tannin and phytic content were reported as 0.24 mg/g and 1.51 mg/g, respectively. The mineral contents such as Cu, Mn, Fe, and Zn have been found as 1.44, 0.64, 3.60, and 0.64 ppm, respectively.
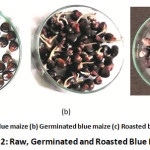 |
Figure 2: Raw, Germinated and Roasted Blue Maize. |
Effect of Processing Treatments on Nutritional and Anti-Nutritional Components of Blue Maize
Nutritional Characteristics
The changes in physicochemical characteristics of blue maize were observed after soaking for 12 and 24 h; germination for 24, 48, and 72 h; fermentation for 12, 24 h, and 36 h and roasting treatment and results obtained are presented in Table 1. There was a significant (p≤0.05) decrease in moisture as well as the fat content of blue maize after soaking and germination treatments. The moisture and fat contents decreased from 12.52 to 11.06 and 4.37 to 3.85%, respectively in grains subjected to soaking as well as germination treatments and further drying in a hot air oven. There was a 7.34 % decrease in moisture content in samples germinated for 72 h. Ghavidel and Prakash29 reported a significant reduction in the fat content of some legumes after 36 h of germination treatment.
The moisture content of fermented grains decreased significantly (p≤0.05) from 12.52% to 11.59%. There was a slight (0.93%) but non-significant decrease in moisture content during the fermentation process. The fat contents of blue maize decreased from 4.37 to 4.26% during the fermentation process resulting in a 2.51% decrease in fat content during the fermentation process. Afify et al.30 reported a decline in fat content of maize after 36 h of fermentation and associated it with higher lipolytic activity during the germination process, which hydrolyzed the fat components and provided the essential energy for growth activities in seed 31,32.
In the roasting process, a significant (p≤0.05) reduction in the moisture content was observed and values decreased from 12.52% to 5.83% resulting in a 53.43% decrease in the moisture content of roasted blue maize. Whereas, the values for the fat content of roasted grains increased from 4.37% to 5.17%. There was an 18.3% increase in the fat content of blue maize samples. Oboh et al.33 reported an 18.19% increase in fat content in yellow maize grains during the roasting process. The increase in the crude fat content during roasting might be connected with the heat-induced breakdown of the bonds existing between the fat as well as the matrix of the maize, resulting in effective release or mobilization of the oil reserve in the maize grains after roasting treatment.
There was a significant (p≤0.05) rise in the fiber content of blue maize and values increased from 5.47 to 6.94% during soaking and germination treatments. There was a 26.8 % increase in fiber content during germination for 72 h. Mlakar et al.34 reported an 18.75% increase in crude fiber contents during germination treatment of amaranth grains. It has also been found to be associated with the loss of dry matter due to enzymatic hydrolysis of starch resulting in the increase of the cellular structures like lignin, cellulose, and hemicelluloses during the germination 35,36. In the case of fermentation processing treatment, the values for fiber content decreased significantly (p≤0.05) from 5.47 % to 5.25% after fermentation for 36 h.
 |
Table 1: Effect of Processing Treatments at Different Time Intervals on the Nutritive Value of Blue Maize. |
There was a 4.02% decrease in fiber content during the fermentation of blue maize for 36 h. During the roasting process, crude fiber content reduced significantly (p≤0.05) from 5.47% to 4.97% resulting in a 9.14% decrease in the fiber content of roasted blue maize. Oboh et al.33 reported a 13.69% decrease in crude fiber content in roasted maize grains and attributed it to the structural changes in the cell wall of germinated grains. The increased temperature during roasting may lead to the rupture of weak bonds amongst polysaccharide chains as well as glycosidic linkages in the fiber. A loose association between fiber molecules and depolymerization of the fibers resulted in the solubilization and hence decrease in crude fiber contents after the roasting process.
The ash content of grains declined significantly (p≤0.05) during the germination process and values decreased from 2.33% to 1.90% contributing to an 18.4% decrease in ash content. But the values for proteins got increased significantly (p≤0.05) from 7.86% to 11.35% during germination of blue maize grains for 72 h. There was a 44.40% enhancement in protein content after 72 h of germination. Ugwuona et al.37 and Nwosu et al.38 reported a significant (p≤0.05) increase in proteins in germinated soybean flour. In the case of fermentation, a non-significant (p≤0.05) decrease in ash content was observed and values decreased from 2.33 to 2.18%. Protein contents enhanced significantly (p≤0.05) from 7.86 to 9.45% in maize resulting in a 20.22% increase in protein contents in maize after the fermentation process. The significant increase in the protein content after the fermentation process has been credited to the upsurge in nitrogen content which gets released when the microorganisms utilized the carbohydrate contents for energy 39. A progressive increase in amino acids was observed by Brunetto et al.40 during fermentation of Criollo cocoa beans resulting in increasing the protein content of beans. Similar results were observed by Pranoto et al.41 during the natural fermentation of sorghum flour. In roasting, there was a slight increase in ash content, and values increased from 2.33% to 2.51% in roasted grains. Oboh et al.33 reported that roasting did not cause a significant change in the ash content (1.93-2.00%) during the roasting of white maize flour.
The carbohydrate content of blue maize decreased from 67.33% to 64.90% during germination for 72 h resulting in a slight (3.61%) but non-significant decrease in carbohydrate contents. Germination facilitated the conversion of complex carbohydrate components into simple sugars by the activation of enzymes like α-amylase resulting in improved digestibility 42 and release of energy for growth activities in the seed 43. The changes in calorific value of blue maize were non-significant (p≤0.05) during the germination process. Similarly, during fermentation, the reduction in carbohydrate content and calorific value of fermented flour was non-significant (p≤0.05). The values for carbohydrates decreased from 67.46 to 67.27% and calorific values from 353.96 to 339.45 kcal/100g. During the roasting process, the values for carbohydrate contents increased significantly (p≤0.05) from 67.46% to 73.02% resulting in an 8.24% increase in values of carbohydrates. Similarly, calorific values increased from 353.96 to 386.49 kcal/100g contributing to an 8.41% increase in carbohydrate contents. According to Adegoke and Adebayo 44, roasting resulted in increasing the carbohydrates contents of the maize. Since the carbohydrate contents of plant foods are calculated by difference, the changes in proteins, fibers, and moisture contents of the maize after roasting will ultimately affect the values for carbohydrate contents, and hence increased values were observed.
Phenolic Content, Antioxidant Activity and Anthocyanin Contents
In the case of soaking and germination, phenolic contents increased significantly (p≤0.05) from 44.88 to 61.05 mg GAE/100g. There was a 36.02% increase in phenolic substances after 72 h of germination. Cornejo et al.45 reported a 14.88% increase in phenolic contents after 72 h of germination. Whereas Đorđević et al.46 reported a 22% increase in total phenolic content of four maize samples. During the roasting process, the total phenolic components decreased significantly (p≤0.05) from 44.88 mg GAE/100g to 35.73 mg GAE/100g. There was a 20.38% decrease in phenolic content after the roasting of blue maize (Table 1).
The anthocyanin contents decreased significantly (p≤0.05) from 543.96 mg CGE/kg to 527.01 mg CGE/kg after germination for 72 h. There was a 3.11% decrease in anthocyanin content after 72 h of germination. During fermentation, the values decreased from 543.96 mg CGE/kg to 526.38 mg CGE/kg resulting in a 3.23% decrease in anthocyanin content after 36 h of fermentation. Similarly, during the roasting process, there was a 5.07% decrease in the anthocyanin content of roasted blue maize and values decreased from 543.96 to 516.33 CGE/kg (Table 1).
There was an 81.07% increase in antioxidant activity in blue maize grains during the germination process and grains germinated for 72 h were observed to have the highest antioxidant activity (18.45%) and it was recorded lowest in raw grains (10.41%). Acosta-Estrada et al.47 stated that this increment in antioxidant activity during germination is linked to the release of phenolic components from cell walls or interaction between protein and starch components of the seed. In the case of fermentation, the antioxidant activity increased significantly (p≤0.05) from 10.41 to 14.50%. There was a 39.28% increase in antioxidant activity. Whereas a significant (p≤0.05) decrease (6.53%) in antioxidant activity was observed after the roasting process and values decreased significantly from 10.41% to 9.73% (Table 1).
Anti-Nutritional Components
The processing techniques were quite effective in decreasing the anti-nutritional components like phytic acid and tannin contents. Tannin contents decreased significantly (p≤0.05) from 0.24 mg/g to 0.09 mg/g in blue maize. There was a 62.5% reduction in tannin contents during the germination of blue maize grains when compared to raw grains. Results are comparable with the findings of Siwatch et al.48, and Sindhu et al.24 who reported 36.25 and 59.96%, reduction in tannin content in amaranth grain, respectively, after 48 h of germination. Similarly, Shimelis and Rakshit49 reported a significant (p≤0.05) decrease in tannins contents during germination and reported it to be due to the leaching out of tannins in water during soaking. Similarly, there was a significant (p≤0.05) decrease (63.57%) in phytic acid content after the germination of grains for 72 h. Egli et al.23 observed a 56.09% decrease in phytic content after germination of grains. Luo et al.50 hypothesized that phytic acids get reduced due to significant (p≤0.05) enhancement in activity of phytase enzyme during germination leading to increased availability of minerals.
In fermentation, the tannin contents decreased from 0.24 mg/g to 0.12 mg/g. There was a significant (p≤0.05) reduction of 50.01% in tannin contents after 36 h of fermentation when compared to raw grains. Similarly, the values for phytic content decreased significantly (p≤0.05) from 1.51 to 0.74 mg/g during fermentation of grains for 36 h. There was a 50.99% decrease in phytic content after the fermentation process. Towo et al.51 found that the fermentation process resulted in a significant (p≤0.05) reduction of phytic acid contents in the sorghum gruels. Greiner et al.52 stated that cereal phytase works best at the optimal pH of 5.0 and it accelerates the hydrolysis of phytic acid contents to inorganic phosphate and inositol at its optimum pH level. Microbial phytase present in microorganisms hydrolyse phytic acid during fermentation and accounts for the decline in phytic acid in the fermented food products 53. During roasting, the tannin contents decreased from 0.24 to 0.14%. There was a 41.66% reduction in tannin contents when compared to raw grains. Similarly, the phytic acid content also gets reduced significantly (p≤0.05) from 1.51 to 1.09% resulting in a 27.81% decrease in phytic content in roasted blue maize grains (Table 1).
Mineral Components
There was a significant (p≤0.05) increase in mineral contents of processed blue maize grains. Values for the Cu and Mn content increased significantly (p≤0.05) from 1.44 to 2.07 ppm and 0.64 ppm to 0.81 ppm, respectively during the soaking and germination treatments. The Fe content increased significantly (p≤0.05) from 3.60 to 4.87 ppm and values for Zn content increased from 0.64 to 0.73 ppm during the soaking and germination treatments of grains for 72 h. The values for Cu, Mn, Fe, and Zn contents increased by 43.75, 26.56, 35.27, and 14.06%, respectively after 72 h of germination in blue maize. Results are comparable with the findings of Guardianelli et al.54 who reported an increase in zinc, copper, and manganese after 24 h of germination in amaranth grains.
In the case of fermentation, a similar increase in mineral contents was observed. Cu content increased significantly (p≤0.05) from 1.44 to 2.33 ppm, Mn from 0.64 to 0.99 ppm, Fe from 3.60 to 5.18 ppm, and Zn contents from 0.64 to 0.86 ppm. There was a 61.80%, 54.68%, 43.88%, and 34.37% increase in Cu, Fe, Zn, and Mn content, respectively during the fermentation treatment of grains for 36 h. In the case of roasting the values for Cu content increased from 1.44 to 1.47 ppm, Fe content from 3.60 to 3.99 ppm, and Zn from 0.64 to 0.70 ppm during the roasting treatment. Oboh et al.33 reported that mineral contents were found to get increased after roasting in different cultivars of maize grains (Table 1).
Conclusions
This study aimed to evaluate the effect of processing techniques on nutritional composition, anti-nutritional compounds as well as bioactive components of blue maize. Soaking, germination, natural fermentation, and roasting processes were found effective in increasing the nutritional value and decreasing the anti-nutritional components in processed grains. It was observed that there was a significant (p≤0.05) increase in protein content of germinated and fermented grain samples. Total phenolic components and antioxidant activity were found to get increased significantly (p≤0.05) during germination as well as fermentation treatments. Mineral contents were found to get increased significantly (p≤0.05) after processing treatments. Leaching of tannins during soaking and their further degradation during germination and significant (p≤0.05) increase in the activity of enzyme phytase resulted in the reduction of anti-nutritional components, thereby increasing mineral availability. Therefore, the use of processing techniques can enhance the nutritional value and functionality of this underutilized grain and it can be successfully utilized for the development of innovative functional food products.
Acknowledgment
The authors are thankful to Vice-Chancellor, Eternal University for providing the motivation and research infrastructure and the Ministry of Food Processing Industries, Govt. of India for financial assistance.
Funding Source
This research is supported by the Ministry of Food Processing Industries (MoFPI) Govt. of India grant (F. No. 5-11/2010-HRD) for the development of infrastructural capability at the University.
Conflict of Interest
The authors declare no conflict of interest.
References
- Sandhu KS, Singh N, Malhi NS. Some properties of corn grains and their flours I: Physicochemical, functional and chapati-making properties of flours. Food Chemistry, 2007. 101(3): 938-46.
CrossRef - Milind P, Isha D. Zea maize: a modern craze. Int Res J Pharm, 2013. 4(6): 39-43.
CrossRef - Mehta DC, Dias FF. Maize: Perspectives and applications in India. Starch‐Stärke, 1999. 51(2‐3): 52-7.
CrossRef - Rouf Shah T, Prasad K, Kumar P. Maize—A potential source of human nutrition and health: A review. Cogent Food & Agriculture, 2016. 2(1): 1166995.
CrossRef - Yao LH, Jiang Y-M, Shi J, et al. Flavonoids in food and their health benefits. Plant foods for human nutrition, 2004. 59(3): 113-22.
CrossRef - Hagiwara A, Miyashita K, Nakanishi T, et al. Pronounced inhibition by a natural anthocyanin, purple corn color, of 2-amino-1-methyl-6-phenylimidazo [4, 5-b] pyridine (PhIP)-associated colorectal carcinogenesis in male F344 rats pretreated with 1, 2-dimethylhydrazine. Cancer letters, 2001. 171(1): 17-25.
CrossRef - Oki T, Masuda M, Furuta S, Nishiba Y, Terahara N, Suda I. Involvement of anthocyanins and other phenolic compounds in radical‐scavenging activity of purple‐fleshed sweet potato cultivars. Journal of Food Science, 2002. 67(5): 1752-6.
CrossRef - Urias-Peraldí M, Gutiérrez-Uribe JA, Preciado-Ortiz RE, Cruz-Morales AS, Serna-Saldívar SO, García-Lara S. Nutraceutical profiles of improved blue maize (Zea mays) hybrids for subtropical regions. Field Crops Research, 2013. 141: 69-76.
CrossRef - Okafor UI, Omemu AM, Obadina AO, Bankole MO, Adeyeye SA. Nutritional composition and antinutritional properties of maize ogi co-fermented with pigeon pea. Food science & nutrition, 2018. 6(2): 424-39.
CrossRef - Kayodé AP. Diversity, users’ perception and food processing of sorghum: implications for dietary iron and zinc supply: Wageningen University and Research, 2006.
- Afify AE-MM, El-Beltagi HS, Abd El-Salam SM, Omran AA. Bioavailability of iron, zinc, phytate and phytase activity during soaking and germination of white sorghum varieties. Plos one, 2011. 6(10): e25512.
CrossRef - Approved methods of the American association of cereal chemists: Amer Assn of Cereal Chemists, 2000.
- Huang S, Shiau C, Liu T, Chu C, Hwang D-F. Effects of rice bran on sensory and Physico-chemical properties of emulsified pork meatballs. Meat Science, 2005. 70(4): 613-9.
CrossRef - Jones D, Chinnaswamy R, Tan Y, Hanna M. Physiochemical properties of ready-to-eat breakfast cereals. Cereal Foods World, 2000. 45(4): 164-8.
- Sosulski F, Slinkard A. Functional properties of ten legume flours. 1976.
CrossRef - Official Methods of Analysis. Washington, DC; 1990. p. 684.
- Ranganna S. Handbook of analysis and quality control for fruit and vegetable products: Tata McGraw-Hill Education, 1986.
- Abdel-Aal E-SM, Young JC, Rabalski I. Anthocyanin composition in black, blue, pink, purple, and red cereal grains. Journal of agricultural and food chemistry, 2006. 54(13): 4696-704.
CrossRef - Bouaziz M, Fki I, Jemai H, Ayadi M, Sayadi S. Effect of storage on refined and husk olive oils composition: Stabilization by addition of natural antioxidants from Chemlali olive leaves. Food Chemistry, 2008. 108(1): 253-62.
CrossRef - Saxena V, Mishra G, Saxena A, Vishwakarma K. A comparative study on quantitative estimation of tannins in Terminalia chebula, Terminalia belerica, Terminalia arjuna and Saraca indica using spectrophotometer. Asian Journal of Pharmaceutical and Clinical Research, 2013. 6(3): 148-9.
- Gao Y, Shang C, Maroof M, et al. A modified colorimetric method for phytic acid analysis in soybean. Crop Science, 2007. 47(5): 1797-803.
CrossRef - Ainsworth EA, Gillespie KM. Estimation of total phenolic content and other oxidation substrates in plant tissues using Folin–Ciocalteu reagent. Nature protocols, 2007. 2(4): 875-7.
CrossRef - Egli I, Davidsson L, Juillerat M, Barclay D, Hurrell R. The influence of soaking and germination on the phytase activity and phytic acid content of grains and seeds potentially useful for complementary feedin. Journal of food science, 2002. 67(9): 3484-8.
CrossRef - Sindhu R, Beniwal SK, Devi A. Effect of grain processing on nutritional and physico-chemical, functional and pasting properties of amaranth and quinoa flours. Indian Journal of Traditional Knowledge (IJTK), 2019. 18(3): 500-7.
- Park J, Sung JM, Choi Y-S, Park J-D. Effect of natural fermentation on milled rice grains: Physicochemical and functional properties of rice flour. Food Hydrocolloids, 2020. 108: 106005.
CrossRef - Chaparro Acuña SP, Gil González JH, Aristizábal Torres ID. Physicochemical characteristics and functional properties of vitabosa (mucuna deeringiana) and soybean (glycine max). Food Science and Technology, 2012. 32(1): 98-105.
CrossRef - Sagbo FS, Aïssi MV, Hounkpatin WA, Houedo C, Dansi A, Soumanou MM. Physicochemical and pasting properties of some local and improved maize varieties cultivated in Benin. International Journal of Biological and Chemical Sciences, 2017. 11(4): 1753-65.
CrossRef - Lopez-Martinez LX, Oliart-Ros RM, Valerio-Alfaro G, Lee C-H, Parkin KL, Garcia HS. Antioxidant activity, phenolic compounds and anthocyanins content of eighteen strains of Mexican maize. LWT-Food Science and Technology, 2009. 42(6): 1187-92.
CrossRef - Ghavidel RA, Prakash J. The impact of germination and dehulling on nutrients, antinutrients, in vitro iron and calcium bioavailability and in vitro starch and protein digestibility of some legume seeds. LWT-Food Science and Technology, 2007. 40(7): 1292-9.
CrossRef - Afify AE-MM, El-BELTAGI HS, Abd El-Salam SM, Omran AA. Effect of soaking, cooking, germination and fermentation processing on proximate analysis and mineral content of three white sorghum varieties (Sorghum bicolor L. Moench). Notulae Botanicae Horti Agrobotanici Cluj-Napoca, 2012. 40(2): 92-8.
CrossRef - Chauhan A, Saxena D, Singh S. Total dietary fibre and antioxidant activity of gluten free cookies made from raw and germinated amaranth (Amaranthus spp.) flour. LWT-Food Science and Technology, 2015. 63(2): 939-45.
CrossRef - Xu L, Chen L, Ali B, et al. Impact of germination on nutritional and physicochemical properties of adlay seed (Coixlachryma-jobi L.). Food chemistry, 2017. 229: 312-8.
CrossRef - Oboh G, Ademiluyi AO, Akindahunsi AA. The effect of roasting on the nutritional and antioxidant properties of yellow and white maize varieties. International journal of food science & technology, 2010. 45(6): 1236-42.
CrossRef - Mlakar SG, Turinek M, Jakop M, Bavec M, Bavec F. Nutrition value and use of grain amaranth: potential future application in bread making. Agricultura, 2009. 6(4): 43-53.
- Laxmi G, Chaturvedi N, Richa S. The impact of malting on nutritional composition of foxtail millet, wheat and chickpea. Journal of Nutrition and Food Sciences, 2015. 5(5): 1-3.
CrossRef - Zheng Y, He R, Zheng L, Hua P, Hu Q, Huang X. Change of anti‐nutrient and phytic acid contents in brown rice during sprouting period. Journal of the Chinese Cereals and Oils Association, 2006. 21: 1-4.
- Ugwuona F, Ogara J, Awogbenja M. Chemical and sensory quality of cakes formulated with wheat, soybean and cassava flours. Indian Journal of Life Sciences, 2012. 1(2): 1.
- Nwosu JN, Owuamanam C, Omeire G, Eke C. Quality parameters of bread produced from substitution of wheat flour with cassava flour using soybean as an improver. American Journal of Research Communication, 2014. 2(3): 99-118.
- Onyango C, Noetzold H, Ziems A, Hofmann T, Bley T, Henle T. Digestibility and antinutrient properties of acidified and extruded maize–finger millet blend in the production of uji. LWT-Food science and Technology, 2005. 38(7): 697-707.
CrossRef - Brunetto MdR, Gallignani M, Orozco W, et al. The effect of fermentation and roasting on free amino acids profile in Criollo cocoa (Theobroma cacao L.) grown in Venezuela. Brazilian Journal of Food Technology, 2020. 23.
CrossRef - Pranoto Y, Anggrahini S, Efendi Z. Effect of natural and Lactobacillus plantarum fermentation on in-vitro protein and starch digestibilities of sorghum flour. Food Bioscience, 2013. 2: 46-52.
CrossRef - Oghbaei M, Prakash J. Effect of primary processing of cereals and legumes on its nutritional quality: A comprehensive review. Cogent Food & Agriculture, 2016. 2(1): 1136015.
CrossRef - Zhang G, Xu Z, Gao Y, Huang X, Zou Y, Yang T. Effects of germination on the nutritional properties, phenolic profiles, and antioxidant activities of buckwheat. Journal of Food Science, 2015. 80(5): H1111-H9.
CrossRef - Adegoke G, Adebayo C. Production, nutritional profiles and storability of ‘Aadun’and ‘Kokoro’: two corn products. Plant Foods for Human Nutrition, 1994. 45(2): 139-44.
CrossRef - Cornejo F, Novillo G, Villacrés E, Rosell CM. Evaluation of the physicochemical and nutritional changes in two amaranth species (Amaranthus quitensis and Amaranthus caudatus) after germination. Food Research International, 2019. 121: 933-9.
CrossRef - Đorđević TM, Šiler-Marinković SS, Dimitrijević-Branković SI. Effect of fermentation on antioxidant properties of some cereals and pseudocereals. Food chemistry, 2010. 119(3): 957-63.
CrossRef - Acosta-Estrada BA, Gutiérrez-Uribe JA, Serna-Saldívar SO. Bound phenolics in foods, a review. Food chemistry, 2014. 152: 46-55.
CrossRef - Siwatch M, Yadav R, Yadav B. Chemical, physicochemical, pasting and microstructural properties of amaranth (Amaranthus hypochondriacus) flour as affected by different processing treatments. Quality Assurance and Safety of Crops & Foods, 2019. 11(1): 3-13.
CrossRef - Shimelis EA, Rakshit SK. Effect of processing on antinutrients and in vitro protein digestibility of kidney bean (Phaseolus vulgaris L.) varieties grown in East Africa. Food chemistry, 2007. 103(1): 161-72.
CrossRef - Luo Y-w, Xie W-H, Jin X-X, Wang Q, He Y-J. Effects of germination on iron, zinc, calcium, manganese, and copper availability from cereals and legumes. CyTA-Journal of Food, 2014. 12(1): 22-6.
CrossRef - Towo E, Matuschek E, Svanberg U. Fermentation and enzyme treatment of tannin sorghum gruels: effects on phenolic compounds, phytate and in vitro accessible iron. Food Chemistry, 2006. 94(3): 369-76.
CrossRef - Greiner R, Muzquiz M, Burbano C, Cuadrado C, Pedrosa MM, Goyoaga C. Purification and characterization of a phytate-degrading enzyme from germinated faba beans (Vicia faba var. Alameda). Journal of agricultural and food chemistry, 2001. 49(5): 2234-40.
CrossRef - Khetarpaul N, Chauhan B. Effect of fermentation by pure cultures of yeasts and lactobacilli on phytic acid and polyphenol content of pearl millet. Journal of Food Science, 1989. 54(3): 780-1.
CrossRef - Guardianelli LM, Salinas MV, Puppo MC. Chemical and thermal properties of flours from germinated amaranth seeds. Journal of Food Measurement and Characterization, 2019. 13(2): 1078-88.
CrossRef
Accepted on: 08 Mar 2022
Second Review by: Wong Yau Hsiung Malaysia
Final Approval by: Dr. Maria Papageorgiou


Web of Science Coverage
Emerging Sources Citation Index (ESCI)
2024 Journal Impact Factor: 1.1
Scopus Journal Metrics
CiteScore 2025: 2.6
CiteScore Details
Sustainable Nutrition: Food Systems, Nutrient Retention, and Public Health Impact
![]()
This journal is a member of, and subscribes to the principles of, the Committee on Publication Ethics (COPE)


