Introduction
The world’s one humped camel (Camelus dromedarius) population is estimated to be about 27 million,1 of which over 82.5 and 17.5% are found in Africa and Asia respectively. About 60% of the camels in Africa are found in Eastern Africa countries namely Somalia, Sudan, Ethiopia and Kenya. Kenyan camel population is estimated to be about 3 million, the third largest population in Africa after Somalia and Sudan.1,2 Camel produce more milk and for a longer period of time than other livestock during the dry season when milk from other livestock is limited.3 The world camel milk production stands at about 3 million tonnes. Africa produces 2.7 million tonnes of camel milk which is about 91% of the total world production while Asia accounts for 8.7% of the world camel milk production1. Kenya produces 937,000 tonnes of camel milk,1 though third in camel production in Eastern Africa, its camel milk production is ranked second after Somali.
Camel milk is a major source of food security and income and also serves a significant cultural function to the pastoral communities in Eastern African region.4,5,6,7,8 It forms basic diet and contributes up to 50% of total nutrient intake and 30% of their annual caloric intake of the pastoral communities.9 Surplus camel milk is usually sold in urban centres and the derived cash contributes to the household cash income. The health-promoting properties of camel milk are a strong boost for sale of camel milk and driver for intensification of camel dairy among the pastoral communities.10
Despite the major contribution of camel milk to livelihoods of the pastoral communities, there are a number of constraints in the pastoral camel milk value chain which prevent exploitation of camel milk potential in improving the livelihood of the pastoral community. Some of the constraints such as low hygiene status of the camel milk production and handling, and lack of cost-effective post-harvest handling technologies among others11,12,13,14 usually results to physiochemical and microbiological deterioration of milk, leading to high post-harvest quality and quantity losses.
The high nutrient content of milk makes it an excellent growth substrate for microorganism.15 Milk drawn from a healthy animal contains very low numbers of microorganisms.16 Microbial contamination of raw milk actually occurs after raw milk leaves the udder of healthy animal. Dairy animals infected with mastitis might shed large numbers of microorganisms into the milk.17 The use of contaminated water and containers, unhygienic handling and high ambient temperature conditions may contaminate the milk with spoilage and pathogenic microorganisms that are capable of degrading milk nutritional components like lactose, proteins and fats.15 The physical and chemical quality of milk18 is of major concern as the quality of milk is hardly maintained by the time they reach the consumer level. The total viable counts are indicative of sanitary quality and serious faults in production hygiene19 and fecal coliform counts of milk indicates unsuitability of milk for drinking.15
However, the magnitude of these quality and quantity losses at different stages along the camel milk value chain and contribution of the different quality parameters have not been quantified. The objective of this study was therefore to quantify these losses at different stages along the camel milk value chain and hence recommend stages where appropriate strategies could be devised to improve the quality of marketed camel milk.
Materials and Methods
Study area
The study was conducted alond camel milk value chain from Isiolo County. Isiolo county is a typical ASAL area in north-eastern in Kenya. The Isiolo camel milk value chain has both peri-urban and pastoral camel milk production systems and a thriving camel milk trade at the terminal market in Nairobi (Eastleigh estate). Isiolo County is a semi-arid area that experiences recurring droughts with devastating losses of livestock with most parts of the county having mean annual temperature between 24°C and 30°C.20
Sampling frame
The sampling frame used was as described by Bonfoh et al.,21 The sampling points/stages along the Isiolo camel milk value chain were herd milking level, collection level within the herd area (primary collection points), collection/bulking centre at Isiolo town (secondary collection point) where milk is cooled waiting transportation the next day to Nairobi, retailing point at Isiolo town and terminal market point (tertiary point) at Eastleigh estate, Nairobi. At camel herd level, 10 camel herds were purposively selected and a total of 66 udder pooled camel milk from lactating camels sampled. The milk at the herd level were directly from udder into 50ml sterile falcon tube.
The milk samples were also collected at collection level within the herd area (primary collection points), collection/bulking centre at Isiolo town (secondary collection point), retailing point at Isiolo town and terminal market point (tertiary point) at Eastleigh estate, Nairobi. A total of 43, 34, 12 and 36 milk samples were collected into 50ml sterile falcon tubes at primary collection point, secondary collection/bulking point, retailing point and terminal market point at Eastleigh Nairobi, respectively. The time of delivery the milk took from one level of market chain to another was also determined.
All milk were preserved in a cool boxes containing ice packs and transported to the nearby Isiolo County Referral and Teaching hospital for samples taken within Isiolo County and to the University of Nairobi, Department of Food Science Nutrition and Technology microbiology laboratory for samples taken from Eastleigh, Nairobi within 2-3 hours after sampling for Analysis. At each respective laboratories, the milk samples were divided into 2 portions. The first portion of milk sample was used for determination of milk physicochemical quality. The physicochemical test done were pH, titratable acidity and alcohol test. The second portion of milk sample was used for microbiological analysis. The milk samples were analysed for total viable counts, coliform counts, lactic acid bacteria counts and Staphylococcus aureus counts.
Physicochemical analysis of sample
Determination and interpretation of pH, titratable acidity and Alcohol test were done according to raw whole camel milk specification described by Kenya bureau of standards.22 The pH was done using digital pH metre model multi-parameter analysis peq meter 1.14 made in Belgium, titratable acidity was done using 0.1N NaOH titrated against 9ml of milk sample while Alcohol test was done using 75% alcohol.
Microbiological Analysis of sample
The milk samples were analysed for total viable counts, total coliform count, lactic acid bacteria counts and S. aureus counts
Total viable counts (TVC) were determined using plate count agar according to ISO 4833:2003 method.23 The plates were incubated at 30±1oC for 48 ±2 hours. Total coliform counts were determined according to ISO 4832:2006 method24 using MacConkey agar and incubating the plate at 300C for 48±2 hours. The lactic acid bacteria counts were determined by standard pour plate method using Rogosa agar and incubating plates at 350C for 48 ±2 hours under anaerobic conditions in a 5% carbon dioxide atmosphere.
S. aureus counts were determined according to ISO 6888-1:1999/Amd 1:2003 method.25 The milk or swab samples were inoculated onto the surface of Baird Parker agar. The plates were incubated at 37oC for 24 ±2 hours then re-incubated for a further 24 ±2 hours. Typical S. aureus colonies black or grey, shining and convex and surrounded by a clear zone which were partially opaque were counted. The TVC, coliform counts, lactic acid counts and S. aureus counts were expressed as colony forming units (cfu) per millilitre of the sample
Statistical analysis
The microbiological and physiological milk quality data was entered into Microsoft Excel 2013 to generate graphs and table presentation of the results. Both physiological and microbiological data were analysed using GENSTAT statistical packages 15th Edition. The microbiological data was transformed into log cfu/ml for analysis One-way analysis of variances was done to compare counts at different sampling points along the Isiolo market value chain. The results were then presented as the geometric means and the range counts at each point along the chain.
Results and Discussion
Physiochemical quality of milk at the herd level
Table 1 shows the pH, percentage lactic acid values and the percentage of milk samples that failed alcohol test at various points along the camel milk value chain. The composite milk of individual camels from same herd showed significant difference (p<0.05) in both pH and percent lactic acid. The mean pH along the Isiolo value chain ranged from 6.5 to 6.6, which was within the range of pH 6.4-6.7 stipulated in Kenya Bureau Standards (KEBS) standard for raw camel milk.22 This was relatively the same to other studies that reported pH range of 6.3 to 6.5.26,11,27 The lowest pH of camel milk of 4.49, 4.74 and 4.84 were recorded at retailing point in Isiolo, Eastleigh market, Nairobi and bulking point, respectively. However the pH for milk showed no significant differences at (p<0.05) along the various stages of camel milk value chain.
Table 1: The physiochemical quality of camel milk along the Isiolo pastoral value chain
|
Stage along the camel milk value chain |
N |
Average pH* |
Average percent (%) Lactic acid |
% sample fail Alcohol test |
Cumulative time (hrs) elapsed after milking |
| Individual camel composite milk | 37 | 6.59a ± 0.035(6.66 to 6.47) | 0.163a ± 0.0074 | 0a | < 1 |
| Milk at the primary collection points within the herd areas | 37 | 6.55a ±0.047(6.63 to 6.42) | 0.193b ±0.013 | 0a | 4 – 7 |
| Milk delivered to bulking/cooling hubs at Isiolo town | 28 | 6.52a ± 0.026(6.60 to 4.84) | 0.205b ±0.078 | 3.57b | 4-11 |
| Milk at retailing point in Isiolo town | 12 | 6.53a ± 0.052(6.63 to 4.49) | 0.196b ± 0.011 | 0a | 5-13 |
| Terminal Market at Eastleigh area, Nairobi | 42 | 6.49a ± 0.33 (6.60 to 4.74) | 0.207b ± 0.078 | 4.76c | 25-30 |
N= number of samples, Figure in brackets indicate pH ranges and Values with similar letters in the same column are not significantly different at 5% Percent lactic acid of milk at the herd level were significantly different (p<0.05) from the percent lactic acid of milk at other points along the camel milk value chain. However, the percent lactic acid of the milk samples taken at the final point of the chain at Eastleigh, Nairobi showed significant difference (p<0.05) to each other. Approximately four percent and five percent of milk delivered at bulking/cooling hub in Isiolo town and terminal market at Eastleigh area, Nairobi failed alcohol test. Alcohol test detects abnormal milk, such as a colostrum, milk from animals in late lactation, milk from animals suffering from mastitis and milk in which the mineral balance has been disturbed. Positive alcohol test indicates high acidity and milk has poor heat stability, hence unfit for any heat treatment or processing and therefore should be rejected, resulting to post-harvest loss.22
The milk samples that failed alcohol test at the bulking/cooling hub were not bulked instead were isolated from the rest. This reduced the risk of contaminating the other fresh milk. The milk that failed alcohol test at the terminal market at Eastleigh, Nairobi were significantly (p<0.05) higher than those at the bulking/cooling hub at Isiolo town. This could have been attributed to time lapse between overnight storing milk and transporting it the next day. The transport vehicles usually arrives at the Eastleigh market between 10-11 am. The milk samples that failed alcohol test did not show significant difference at (p<0.05) in percent lactic acid, indicating that alcohol test is more sensitive and better test for determining acid development in camel milk than pH and percent lactic acid.
Camel milk pH is more stable due its buffering phenomenon.28 This has been demonstrated by the stability of the pH along the Isiolo camel milk value chain. The pH along the chain showed no significant difference at (p<0.05) even after time lapse of upto 30 hours (Table 1) after milking. The percentage lactic acid of the milk at the herd was significantly (p<0.05) low compared to the percentage lactic acid along the chain. The percentage lactic acid shows that the milk should be showering but this was not visible since the milk does not form a firm coagulation.28,14
Microbiological quality of camel milk along the Isiolo pastoral value chain
All stages of the camel milk value chain had total viable counts (TVC) above the KEBS standard specification22 for either grade I (2.0×10⁵cfu/ml) or grade II (5x0x105cfu/ml) (Table 2). The TVC increased progressively along the chain, indicating either increased contamination or growth of contaminating microorganisms due to high holding time at ambient temperature and long holding time before cooling. Despite cooling the milk at Isiolo bulking/cooling hub and early morning transportation of milk to Nairobi, the TVC at the Eastleigh market, Nairobi was significantly (p<0.05) higher than counts at other chain points which showed no significant differences at.
Table 2: TVC, Total coliforms, Staphylococcus aureus and lactic acid bacteria of milk along the camel milk value chain
|
Type of microorganism |
Composite milk directly from the udder (n= 66) |
Milk at the primary collection point (n=43) |
milk at the retailing points around Isiolo (n=12) | Milk at the bulking/cooling hub before bulking (n=34) |
Milk at terminal Eastleigh market, Nairobi (n=36) |
| Geometric mean (cfu/ml) | Geometric mean(cfu/ml) | Geometric mean(cfu/ml) | Geometric mean(Cfu/ml) | Geometric mean(cfu/ml) | |
| Total Viable Counts (TVC) | 1.87 × 10⁶ a(5×10² – 3.78×10⁷) | 2.5 × 10⁶ a(3.6×10³– 3.3 ×10⁷) | 1.3 × 10⁷ a(1.7×10⁴ – 3.2×10⁷) | 1.4 × 10⁷ a(3.7×10³– 4.0×10⁷) | 8.1 × 10⁸ b(106 – 2.9 × 10⁹) |
| Coliforms | 1.2 × 10⁴ a (20 – 6.5×10⁴) | 2.3 × 10⁴ a(10 – 2.8 × 10⁵) | 6.9 × 10⁴ ab(1.0×10² –2.3× 10⁴) | 9.6 × 10⁵ b(10 – 5.5 × 10⁶) | 1.3 × 10⁷ c(104 – 6.0 × 10⁷) |
| Staphylococcus Aureus | 1.3 × 10⁴ a(1.2×101 – 5.6×10⁶) | 2.2 ×10⁴ a(20 – 2.5 × 10⁵) | 8.7 × 10⁴ b(3.2×10³ -2.1 × 10⁵) | 1.2 × 10⁶ c(3.2×10² – 2.6 107) | 2.0 × 10⁶ d(104 – 2.6 × 10⁷) |
| Lactic Acid Bacteria (LAB) | 6.0 × 10³ a(0 – 1.4 × 10⁵) | 3.0 × 10⁴ a(20 – 3.0 × 10⁶) | 3.9 × 10⁴ a(20 – 1.3 × 10⁴) | 4.8 × 10⁵ b(30 – 3.0×10⁶) | 1.3 × 10⁷ c(104 – 7.9 × 10⁷) |
Figures in brackets indicate range of counts (cfu/ml). The geometric mean values with similar letters in the same row are not
significantly different at 5%. n= number of samples
(p<0.05) to each other. This can be attributed to growth of psychrotrophic microorganisms, flavoured by extended cold storage of raw milk, a common practice in dairy sector and being recommended for ASALs
Psychrotrophic microorganisms are mostly environmental contaminants, from which they contaminate the animal (camel), utensil, water, and milkers’ hands and represent a significant percentage of spoilage microflora.29 Important characteristics of psychrotrophic microorganisms like pseudomonads are their abilities to produce large amounts of extracellular or intracellular thermoresistant enzymes (proteases, lipases and phospholipases) that hydrolyze milk proteins and lipids and can cause spoilage of milk.29,30
The significantly higher counts recorded at the Eastleigh market, Nairobi could be due to long time lapse from the time the milking to the terminal market. Generally the TVC counts recorded along the chain were high. This high count could be as a result of many factors among them the initial high ambient temperature and poor sanitation and hygiene along the chain and other environmental factors such as dusty milking area and surrounding air.27
Kaindi et al.,27 reported lower total viable counts along the same Isiolo chain than reported in this study. Other studies have also reported lower counts along the chain than the findings reported in the current study.11,14,31 This could be attributed to differences in sampling method used in the two studies. At the milking level, counts reported by Kaindi et al.,27 could be low due to sterilizing the teat with alcohol before milking hence preventing cross contamination from the camel udder and the milkers’ hands. Time lapse to reach the final market in Nairobi could also be another reason for his low TVC count. While the findings in this study showed a time lapse of 25 to 30 hours, Kaindi et al.,27 reported a time lapse of 21 to 25 hours. The results of the current study indicate that as the milk moves along the chain the TVC in the milk increases. Other studies have also shown similar microbiological quality trends along the pastoral value chain.11,14,31
Total coliforms counts increased significantly along the Isiolo camel value chain. The total coliform counts reported in the current study were lower compared to counts reported by Matofari et al.,31 Total coliform counts of composite milk directly from the udder level and milk at the primary collection point were not significantly different at (p<0.05). Also total coliform counts of milk at the retailing points around Isiolo and milk at the bulking/cooling hub before bulking were not significantly different (p>0.05). However, milk at Eastleigh terminal market, Nairobi had significantly (p<0.05) higher total coliform count than other previous stages of the chain. Since coliforms are naturally present in milk from a healthy udder, the 3-fold increase in total coliform count from 1.2×10⁴ cfu/ml at udder level to 1.3×10⁷cfu/ml indicates introduction of additional coliforms. The main source of this could be dirty milking environment and poor sanitation and hygiene practices of milk handling personnel and containers.
There were significant difference (p<0.05) in S. aureus counts along all points of the chain (Table 2). However, there were no significant differences at (p>0.05) in S. aureus counts of composite milk directly from the udder and milk at the primary collection point at herd level. Milk at the bulking/cooling hub at Isiolo before bulking and milk at terminal Eastleigh market, Nairobi had significantly higher S. aureus counts of greater than 106cfu/ml of milk. With reference to S. aureus counts, as an indicator organism for personnel hygiene,32 our study shows that hygiene status varied highly along the various stages of the chain. A study done along the same camel milk chain recorded a lower S. aureus count27 than reported in this study. However, the counts were slightly lower than those reported (mean score of 107 counts) in Qassim region in Saudi Arabia33.
There were significant differences (p<0.05) and increase in lactic acid bacteria counts along the various stages of the chain. Milk at the bulking/cooling hub at Isiolo before bulking had significantly lower lactic acid bacteria counts (4.8 × 10⁵cfu/ml milk) than milk at terminal Eastleigh market, Nairobi (1.3×10⁷cfu/ml milk) (Table 2). Lactic acid bacteria multiply in milk metabolize lactose resulting in acid development and carbon dioxide.34 High lactic acid bacteria counts contributes to the rejection of the milk as the acid produced will result to alcohol test failure.
Quantification of Post-harvest losses along the chain based on microbial quality
Quantification of Post-harvest losses based on Total Viable Count standards
Figure 1 shows the classification of camel milk samples along the value chain based on total viable plate count as stipulated in the revised Kenya Bureau of Standard specification for raw whole camel milk.22 Sixty seven (67) percent and 10%, of milk samples directly from the udder meet the specifications for grade I (TVC less than 2×10⁵cfu/ml) and grade II (TVC between 2×10⁵cfu/ml and 5×10⁵cfu/ml) raw whole camel milk. This could be due to the fact that some camels are milked even when they have mastitis and/or are sick, this result in udder milk having higher counts than accepted. Bulking of such milk with the milk from health animals leads to reduction of the quality of the whole bulked milk.
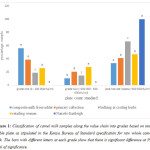 |
Figure 1: Classification of camel milk samples along the value chain into grades based on total viable plate as stipulated in the Kenya Bureau of Standard specification for raw whole camel milk. The bars with different letters at each grade show that there is significant difference at 5% level of significance. Click here to View figure |
Thirty nine (39) percent, 20% and 25% of milk at primary collection, bulking/cooling hub at Isiolo and retailing point at Isiolo town, respectively had TVC less than 2×10⁵cfu/ml and were classified as grade I whole raw camel milk. Only 20.45%, 14.29% and 23.5% of milk at primary collection, bulking/cooling hub at Isiolo and retailing point at Isiolo town, respectively had TVC between 2×10⁵cfu/ml and 5×10⁵cfu/ml were classified as grade II whole raw camel milk. Our study based on revised 2007 Kenya Bureau of Standards22 found that all milk at terminal Eastleigh market, Nairobi exceeded the 5×10⁵cfu/ml total viable counts limit for Grade II milk and were classified as rejected and unfit for processing. However, a study done along the same value chain and study site and based on the old 2007 Kenya Bureau of Standards reported that 75% of milk at final market at Nairobi was of poor quality and exceeded the acceptable microbiological limit of 106cfu/ml of milk (Grade III – 5×10⁴ to 5×10⁵cfu/ml and Grade IV – greater than 5×10⁵cfu/ml).27 This shows that the revised standard is too strict and does not reflect the true situation under pastoral system of milk production, thus need to revise it to accommodate the constraints of pastoral milk production. The milk samples at bulking/cooling centre were collected on arrival at the cooling centre before bulking, indicating that high post-harvest losses of milk occur before milk is delivered for cooling.
Quantification of Post-harvest losses based on coliforms count standards
Figure 2 shows the classification of camel milk samples along the value chain based on coliform counts as stipulated in the Kenya Bureau of Standard specification for raw whole camel milk.22 About 29% and 50%, of milk samples directly from the udder met the specifications for grade I milk (coliform counts of less than 1×10³cfu/ml) and grade II milk (coliform counts between 1×10³cfu/ml and 2×10⁴cfu/ml) raw whole camel milk, respectively. The low quality of udder milk could be due to milking some camels with mastitis, resulting in udder milk having higher coliform counts than accepted. Coliforms especially Escherichia coli has been implicated as one of the causative organism for mastitis.
Twenty seven (27) percent, 26.43% and 25% of milk at primary collection, bulking/cooling hub at Isiolo and retailing point at Isiolo town, respectively had coliform counts less than 1×10³cfu/ml and were classified as grade I whole raw camel milk. None of the milk at terminal Eastleigh market, Nairobi could meet the specifications for grade I (coliform counts of less than 1×10³cfu/ml) whole raw camel milk. About 46.51%, 22.14%, 41.67% and 7.5% of milk at primary collection, bulking/cooling hub at Isiolo, retailing point at Isiolo town and terminal Eastleigh market, Nairobi, respectively had coliform counts between 1×10³cfu/ml and 2×10⁴cfu/ml and were classified as grade II whole raw camel milk. The amount of milk classified as rejected based coliform counts, hence indicating post-harvest loss at various stages along value chain were 21.21%, 26.48%, 45.71%, 33.33% and 92.5% at individual composite udder milk, primary collection, bulking/cooling centre/hub at Isiolo centre, among retailing women at Isiolo town and Eastleigh market, Nairobi, respectively.
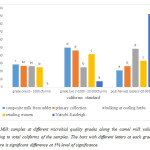 |
Figure 2: Milk samples at different microbial quality grades along the camel milk value chain according to total coliforms of the samples. The bars with different letters at each grade show that there is significant difference at 5% level of significance. Click here to View figure |
Using total viable counts and coliform counts as indicators of microbiological quality of camel milk, the results demonstrate that microbial quality of milk significantly (p<0.05) deteriorates as milk moves along the value chain. The high milk rejection rate and hence high post-harvest losses, can be attributed to long time of holding milk at high ambient temperatures, poor cleaning of milk containers resulting in accumulation microbial load and several/frequent transfers of milk into poorly cleaned containers as it moves along the camel milk value chain. However the high amount of grade II milk at retailing point could be due to holding the milk at high ambient temperature prior to and during sale.
Acknowledgements
The authors would like to thank the Federal Ministry of Education and Research (BMBF) in Germany through the RELOAD (Reducing Losses Adding Value) Project for funding this research. Also not forgetting Kenya Camel Association for the support he offered to get the camel herders.
Reference
- FAOSTAT. World camel population. Accessed at http://faostat3.fao.org/browse/Q/QA/E on 9th of March, 2015: (2015).
- KNBS (Kenya National Bureau of Statistics). 2009 Population and housing census. Nairobi: Ministry of Finance and Planning: (2010).
- Kaufmann B. Analysis of Pastoral Camel Husbandry in Northern Kenya. Hohenheim Tropical Agricultural Series No. 5. Verlag Josef Margraf, Weikersheim, Germany: (1998).
- Guliye A.Y, Noor I.M, Bebe B.O, Koskey I.S. Role of camels (Camelus dromedarius) in the traditional lifestyle of Somali pastoralists in northern Kenya. Outlook on Agriculture: 36(1):29–34: (2007).
CrossRef - Mahmoud H.A. Camel marketing in the Northern Kenya/Southern Ethiopia Borderlands. FAC Research Update 003. Brighton: Future Agricultures Consortium, University of Sussex: (2010).
- Mehari Y, Mekuriaw Z, Gebru G. Camel and camel product marketing in Babilie and Kebribeyah woredas of the Jijiga Zone, Somali Region, Ethiopia. Livestock Research for Rural Development 19(49).
http://lrrd.cipav.org.co/index.html: (2007a). - Mehari Y, Mekuriaw Z, Gebru G. Potentials of camel production in Babilie and Kebribeyah woredas of the Jijiga Zone, Somali Region, Ethiopia. Livestock Research for Rural Development 19(58). http://lrrd.cipav.org.co/ index.html: (2007b).
- Ministry of Livestock Development MoLD. Government of Kenya, (MoLD) annual report, Nairobi: (2007).
- Farah Z, Fischer A. The camel (C. dromedarius) as a meat and milk animal: handbook and product development. Vdf Hochschulverlag: (2004).
- Faye B. Focus on camels. http://www.new-ag.info/en/focus/focusItem.php. Accessed 13 September 2015: (2007).
- Farah Z. An Introduction to the Camel. In: Farah Z, Fishcher A (Eds) Milk and Meat from the Camel Handbook on Products and Processing, Vdf Hochschulver lag AG, ETH Zurich, Zurich/Singen, Switzerland: 25-28: (2004).
- Matofari J.W, Shitandi A, Shalo P.L, Nanua N.J, Younan M. A survey of Salmonella enterica contamination of camel milk in Kenya. African Journal of Microbiological Resources: 1(4):46-50: (2007).
- Wangoh J. Equipment for small scale milk plant. In: Farah Z, Fishcher A (Eds) Milk and Meat from the Camel Handbook on Products and Processing, Vdf Hochschulver lag AG, ETH Zurich, Zurich/Singen, Switzerland: 77-81: (2004).
- Younan M, Abdurahman O. Milk hygiene and udder health. In: Farah Z, Fishcher A (Eds) Milk and Meat from the Camel Handbook on Products and Processing, Vdf Hochschulver lag AG, ETH Zurich, Zurich/Singen, Switzerland: 67-76: (2004)Chatterjee S.N, Bhattacharjee I, Chatterjee S.K, Chandra G. Microbiological examination of milk in Tarakeswar, India with special reference to coliforms. African Journal of Biotechnology: 5:1383-1385: (2006).
- Singh B.D. Biotechnology: Expanding Horizons. 2nd Edn, Kalyani Publishers, India, ISBN-13: 9788127243524: 919: (2008).
- Bramley A.J, McKinnon C.H, Staker R.T, Simpkin D.L. The effect of udder infection on the bacterial flora of the bulk milk of ten dairy herds. Journal of Applied Bacteriology: 57: 317-323: (1984).
CrossRef - Kumar H, Wadhwa G, Palaha R, Gandhi R, Singh S. Microbiological quality analysis of ice creams sold by street hawkers: A case study of Jalandhar city, India. Internet Journal of Food Safety: 13:164-169: (2011).
- Bashir A, Usman A.D. Bacteriological analysis of some locally processed cow milks in Bauchi Metropolis, Nigeria. International Journal of Pure Applied Science: 2:47-54: (2008).
- Herlocker D.J, Shaaban S.B, Wilkes S. Range management handbook of Kenya. Volume II, 5: Isiolo District. Nairobi: Ministry of Agriculture, Livestock Development and Marketing. (1993).
- Bonfoh B, Wasen A, Traore A.P, Fane A, Spillmann H, Simbe F, Afaroukh I, Nicolet J, Farah Z, Zinsstag J. Microbiological quality of cow’s milk taken at different intervals from the udder to the selling point in Bamako (Mali). Food control 58:304-307: (2003).
- KEBS. Raw whole camel milk — Specification, KS 2061:2007 (confirmed 2013). Kenya: (2007).
- ISO. Microbiology of food and animal feeding stuffs. Horizontal method for the enumeration of microorganisms. Colony-count technique at 30uC. ISO 4833:2003. International Organization for Standardization, Geneva: (2003a).
- ISO. Microbiology of food and animal feeding stuffs. Horizontal method for the enumeration of coliforms. Colony-count technique. ISO 4832:2006. International Organization for Standardization, Geneva: (2006).
- ISO. Microbiology of food and animal feeding stuffs. Horizontal method for the enumeration of coagulase-positive Staphylococcus aureus and other species. Part 1. Technique using Baird agar medium. Amendment 1. Inclusion of precision data. ISO 6888-1:1999/Amd 1:2003. International Organization for Standardization, Geneva: (2003b).
- Ahmed A.l, Mohammeed A.A, Faye B, Blanchard L, Bakheit S.A. Assessment of quality of camel milk and garis, North Kordofan States Sudan. Research Journal of Animal and Veterinary Sciences: 5:18-22: (2010).
- Kaindi D.W, Schelling E, Wangoh J, Imungi J.K, Farah Z, Meile L. Microbiological quality of raw camel milk across the Kenyan market chain. Global Science book: 5(1):79-83: (2011).
- Attia H, Kherouatou N, Dhouib A. Dromedary milk lactic acid fermentation: microbiological and rheological characteristcs. Journal of industrial Microbiology and biotechnology 26:263-270: (2001).
CrossRef - Samarzija D, Zamberlin S, Pogacic T. Psychrotrophic bacteria and milk quality, Mljekarstvo: 62(2):77-95: (2012).
- Ledenbach L.H, Marshall R.L. Microbiological Spoilage of Dairy Products. In W.H. Sperber, M.P. Doyle (eds.) Compendium of the Microbiological Spoilage of Foods and Beverages, Food Microbiology and Food Safety. DOI: 10.1007/978-1-4419-0826-1: (2009).
CrossRef - Matofari J.W, Shalo P.L, Younan M, Nanua N.J, Adongo A, Qabale A, Misiko B.N. Analysis of microbial quality and safety of camel (Camelus dromedarius) milk chain and implications in Kenya. Journal of Agricultural Extension and Rural Development: 5(3):50–54: (2013).
- Dijk R, van den Berg D, Beumer R.R, de Boer E, Dijkstra A, Kalkmand P, Stegeman H, Uyttendaele M, Veenendaal H. Microbiologie van Voedingsmiddelen: methoden, principes en criteria (vierde druk). Uitgeverij Keesing Noordervliet, Houten, The Netherlands: (2007).
- El-Ziney M.G, Al-Turki A.I. Microbiological quality and safety assessment of camel milk in Saudi Arabia (Quassin). Applied Ecology and Environmental Research: 5:115-122: (2007).
CrossRef - Hutkins R.W. Metabolism of starter cultures. In E.H. Marth & J.L. Steele (Eds.) Applied dairy microbiology (2nd ed.).New York: Marcel Dekker: 207–241: (2001).

This work is licensed under a Creative Commons Attribution 4.0 International License.


